
Crude Oil Attempting a Stage 4 Continuation Breakdown and the US Stocks Watchlist – 14 March 2023
The full post is available to view by members only. For immediate access:
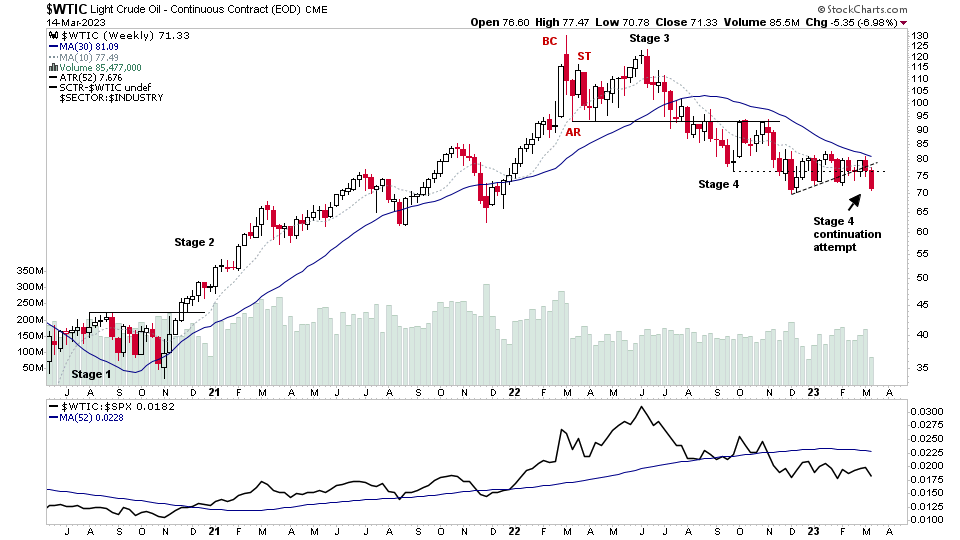
Crude Oil has been weakening gradually since topping a year ago in early March 2022, where it had what's know in the Wyckoff method as a Buying Climax (BC) and Change of Behaviour as the Automatic Reaction (AR). Which is often the first signs of early Stage 3 developing to take note of and to start trimming a position that you've held through the bulk of the Stage 2 advance for example, but at that point it is still officially considered in Stage 2, as it needs further structural, price, volume and relative strength characteristics to develop to officially move into Stage 3. But a Change of Character from the prior less volatile trending behaviour of Stage 2 should be taken note of, as exiting earlier in Stage 3 can save a lot of opportunity costs.
Crude Oil has been in Stage 4 downtrend since August 2022, where it broke down with a still rising 30 week MA, which then started to rollover by the end of the month, and the Stage Analysis Technical Attributes (SATA) score dropped from a high of an 8 in June 2022, to a low of 1 in September 2022, highlighting the next change of character from Stage 3 top to Stage 4 downtrend getting underway.
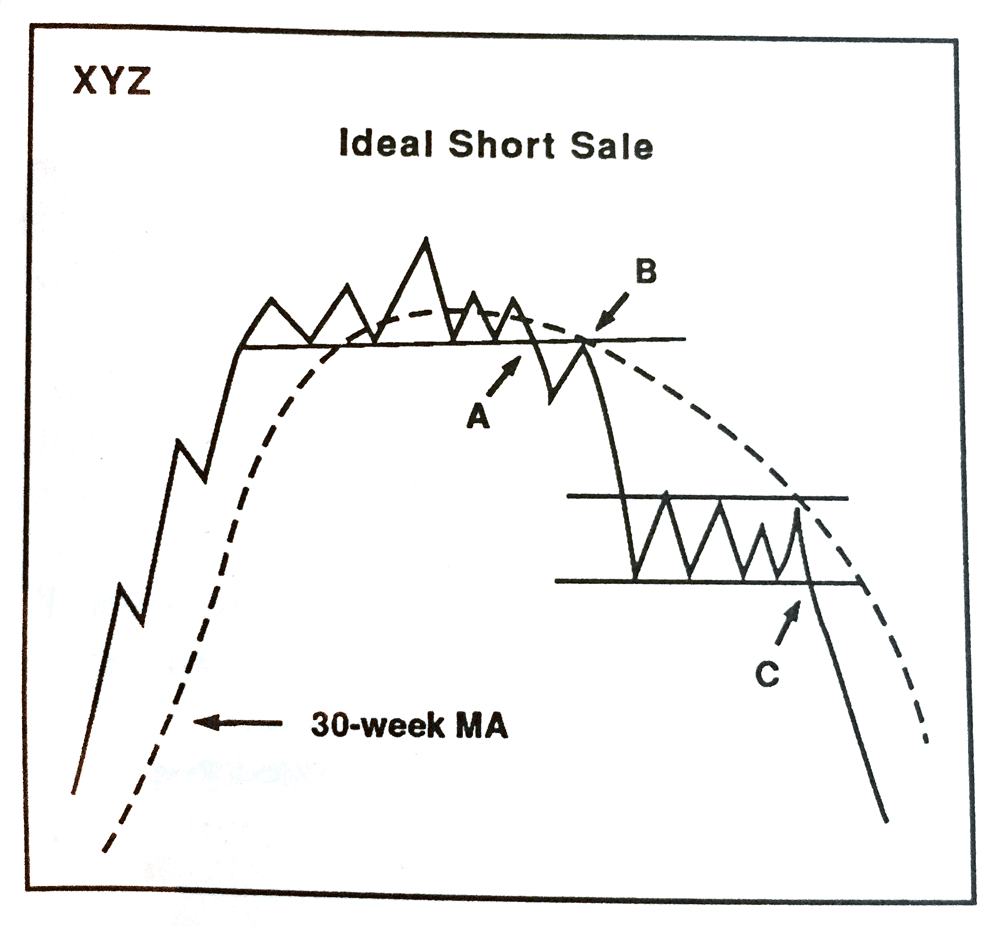
Currently, Crude Oil has been forming a sideways range within Stage 4 since late November 2022, and has failed to move back above the still declining 30 week MA, which if it did, might suggest signs of early Stage 1, but instead has made a continuation breakdown attempt today at potentially what Stan Weinstein referred to as point C in the short sale diagram from his 1988 book – Stan Weinstein's Secrets for Profiting in Bull and Bear Markets (Figure 7–13, page 229).
So with Crude Oil futures testing the Stage 4 continuation breakdown zone, Stan Weinstein's Stage Analysis methods approach is to drill down into the related sectors, groups and stocks for similar signs of weakness.
XOP is a major ETF that attempts to track the the S&P Oil & Gas Exploration & Production Select Industry Index, which covers the sub-industries of Integrated Oil & Gas, Oil & Gas Exploration & Production, and Oil & Gas Refining & Marketing and holds around 59 stocks currently. Which is only a small fraction of the stocks in the various Oil groups. But it is a modified equal weighted index with exposure to large, mid and small cap stocks, and so gives a better representation of the sector than the XLE, which is cap weighted in large cap S&P 500 stocks only.
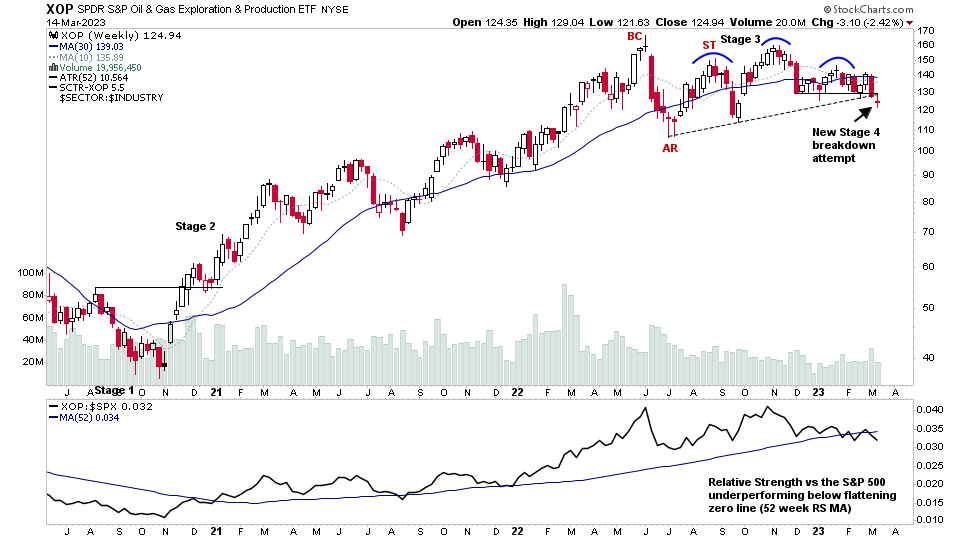
With Crude Oil weakening towards the bottom of it's range, the XOP ETF has made a Stage 4 breakdown attempt this week also, and so if looking for short ideas in the Oil stocks then its holdings are one place to start looking, which you can easily find by Googling "XOP holdings", and I also did a members video at the start of the 2023 on the Oil & Gas Stocks – Multiple Stage 4 Breakdowns & Technical Weakness – 3 January 2023 (36mins) which has numerous stocks highlighted that were in vulnerable positions at the time, and so might be worth reviewing to see how they've developed.
Become a Stage Analysis Member:
To see more like this – US Stocks watchlist posts, detailed videos each weekend, use our unique Stage Analysis tools, such as the US Stocks & ETFs Screener, Charts, Market Breadth, Group Relative Strength and more...
Join Today
Disclaimer: For educational purpose only. Not investment advice. Seek professional advice from a financial advisor before making any investing decisions.