
Stage Analysis Technical Attributes Scores – S&P 100 (OEX)
The full post is available to view by members only. For immediate access:
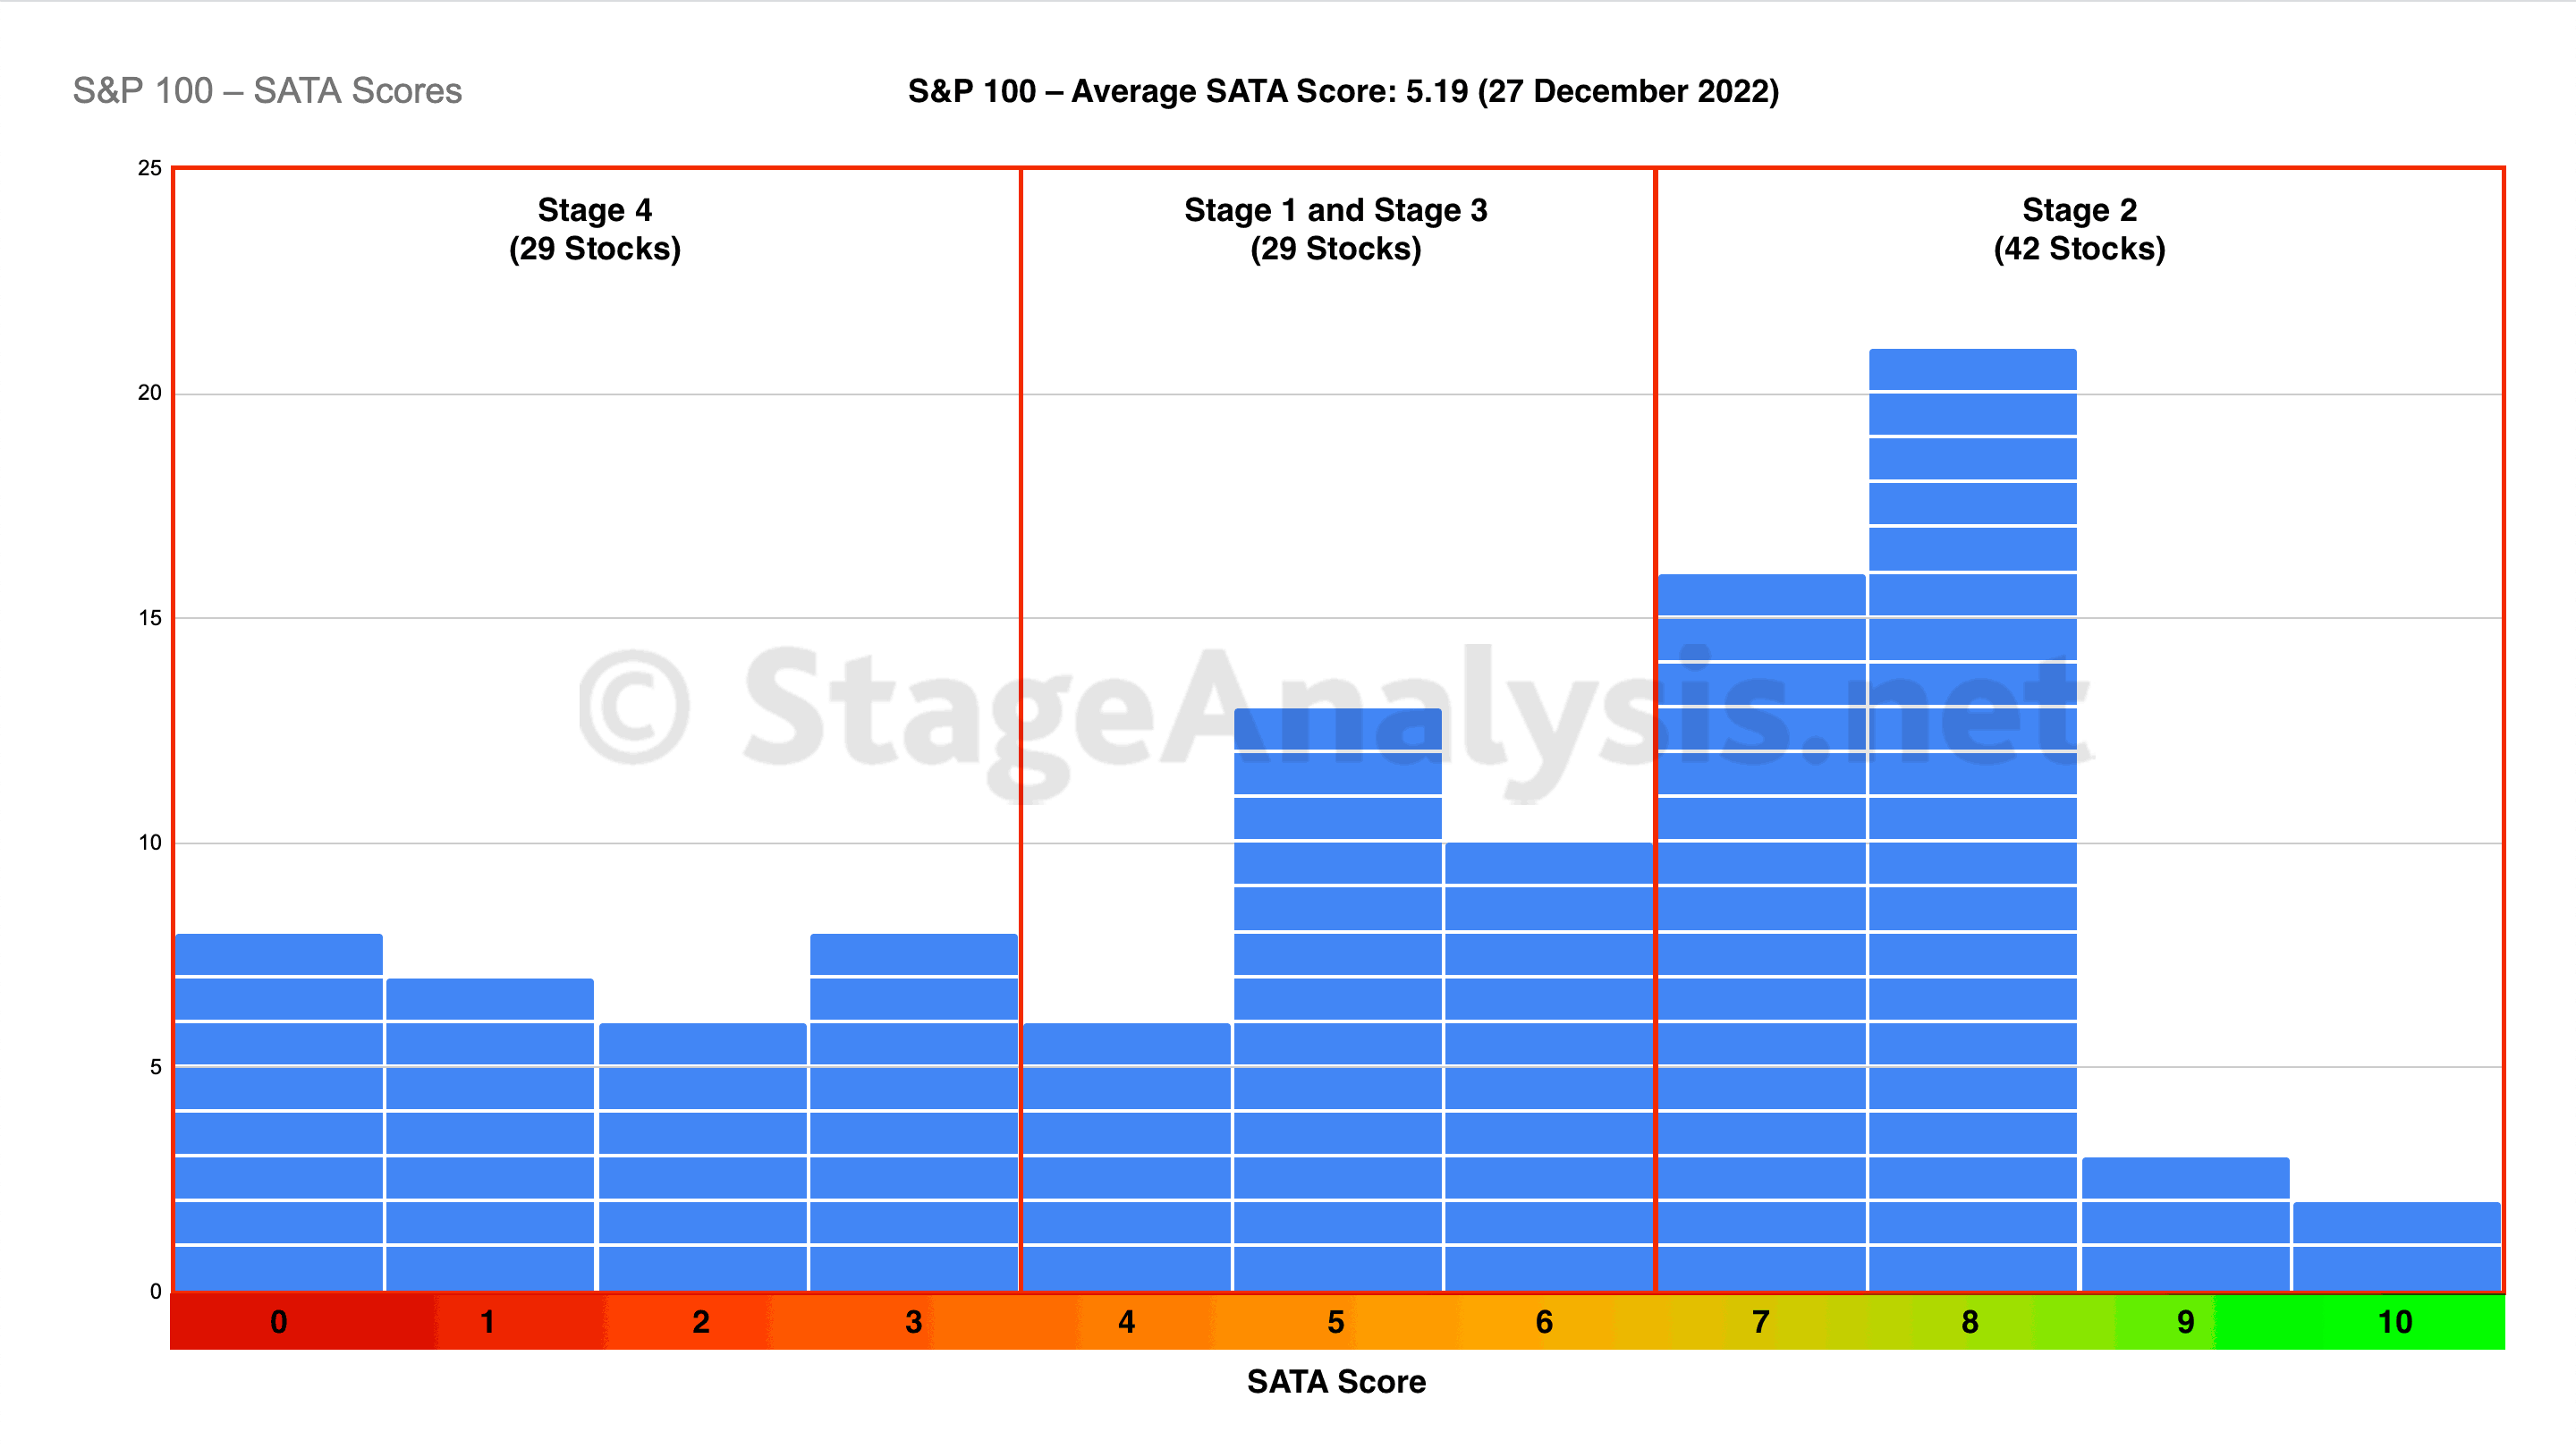
The S&P 100 comprises 100 major blue chip companies and is a sub-set of the popular S&P 500 index. So I thought it would be useful to look at the Stage Analysis Technical Attributes (SATA) weekly scores for all of the stocks in the S&P 100 as we come to the end of 2022, as it will give a picture of the current health of these 100 key stocks for the US market.
The SATA scores show a rough guide of the Stages of the individual stocks within the S&P 100, as everything above a 7 would be considered in the Stage 2 zone, 4-6 in the Stage 1 or Stage 3 zone, and 3 or below is the Stage 4 zone.
So currently the S&P 100 consists of:
- 42% Stage 2 zone
- 29% Stage 1 and Stage 3 zone
- 29% Stage 4 zone
Overall Average SATA Score: 5.19 (Stage 1 zone)
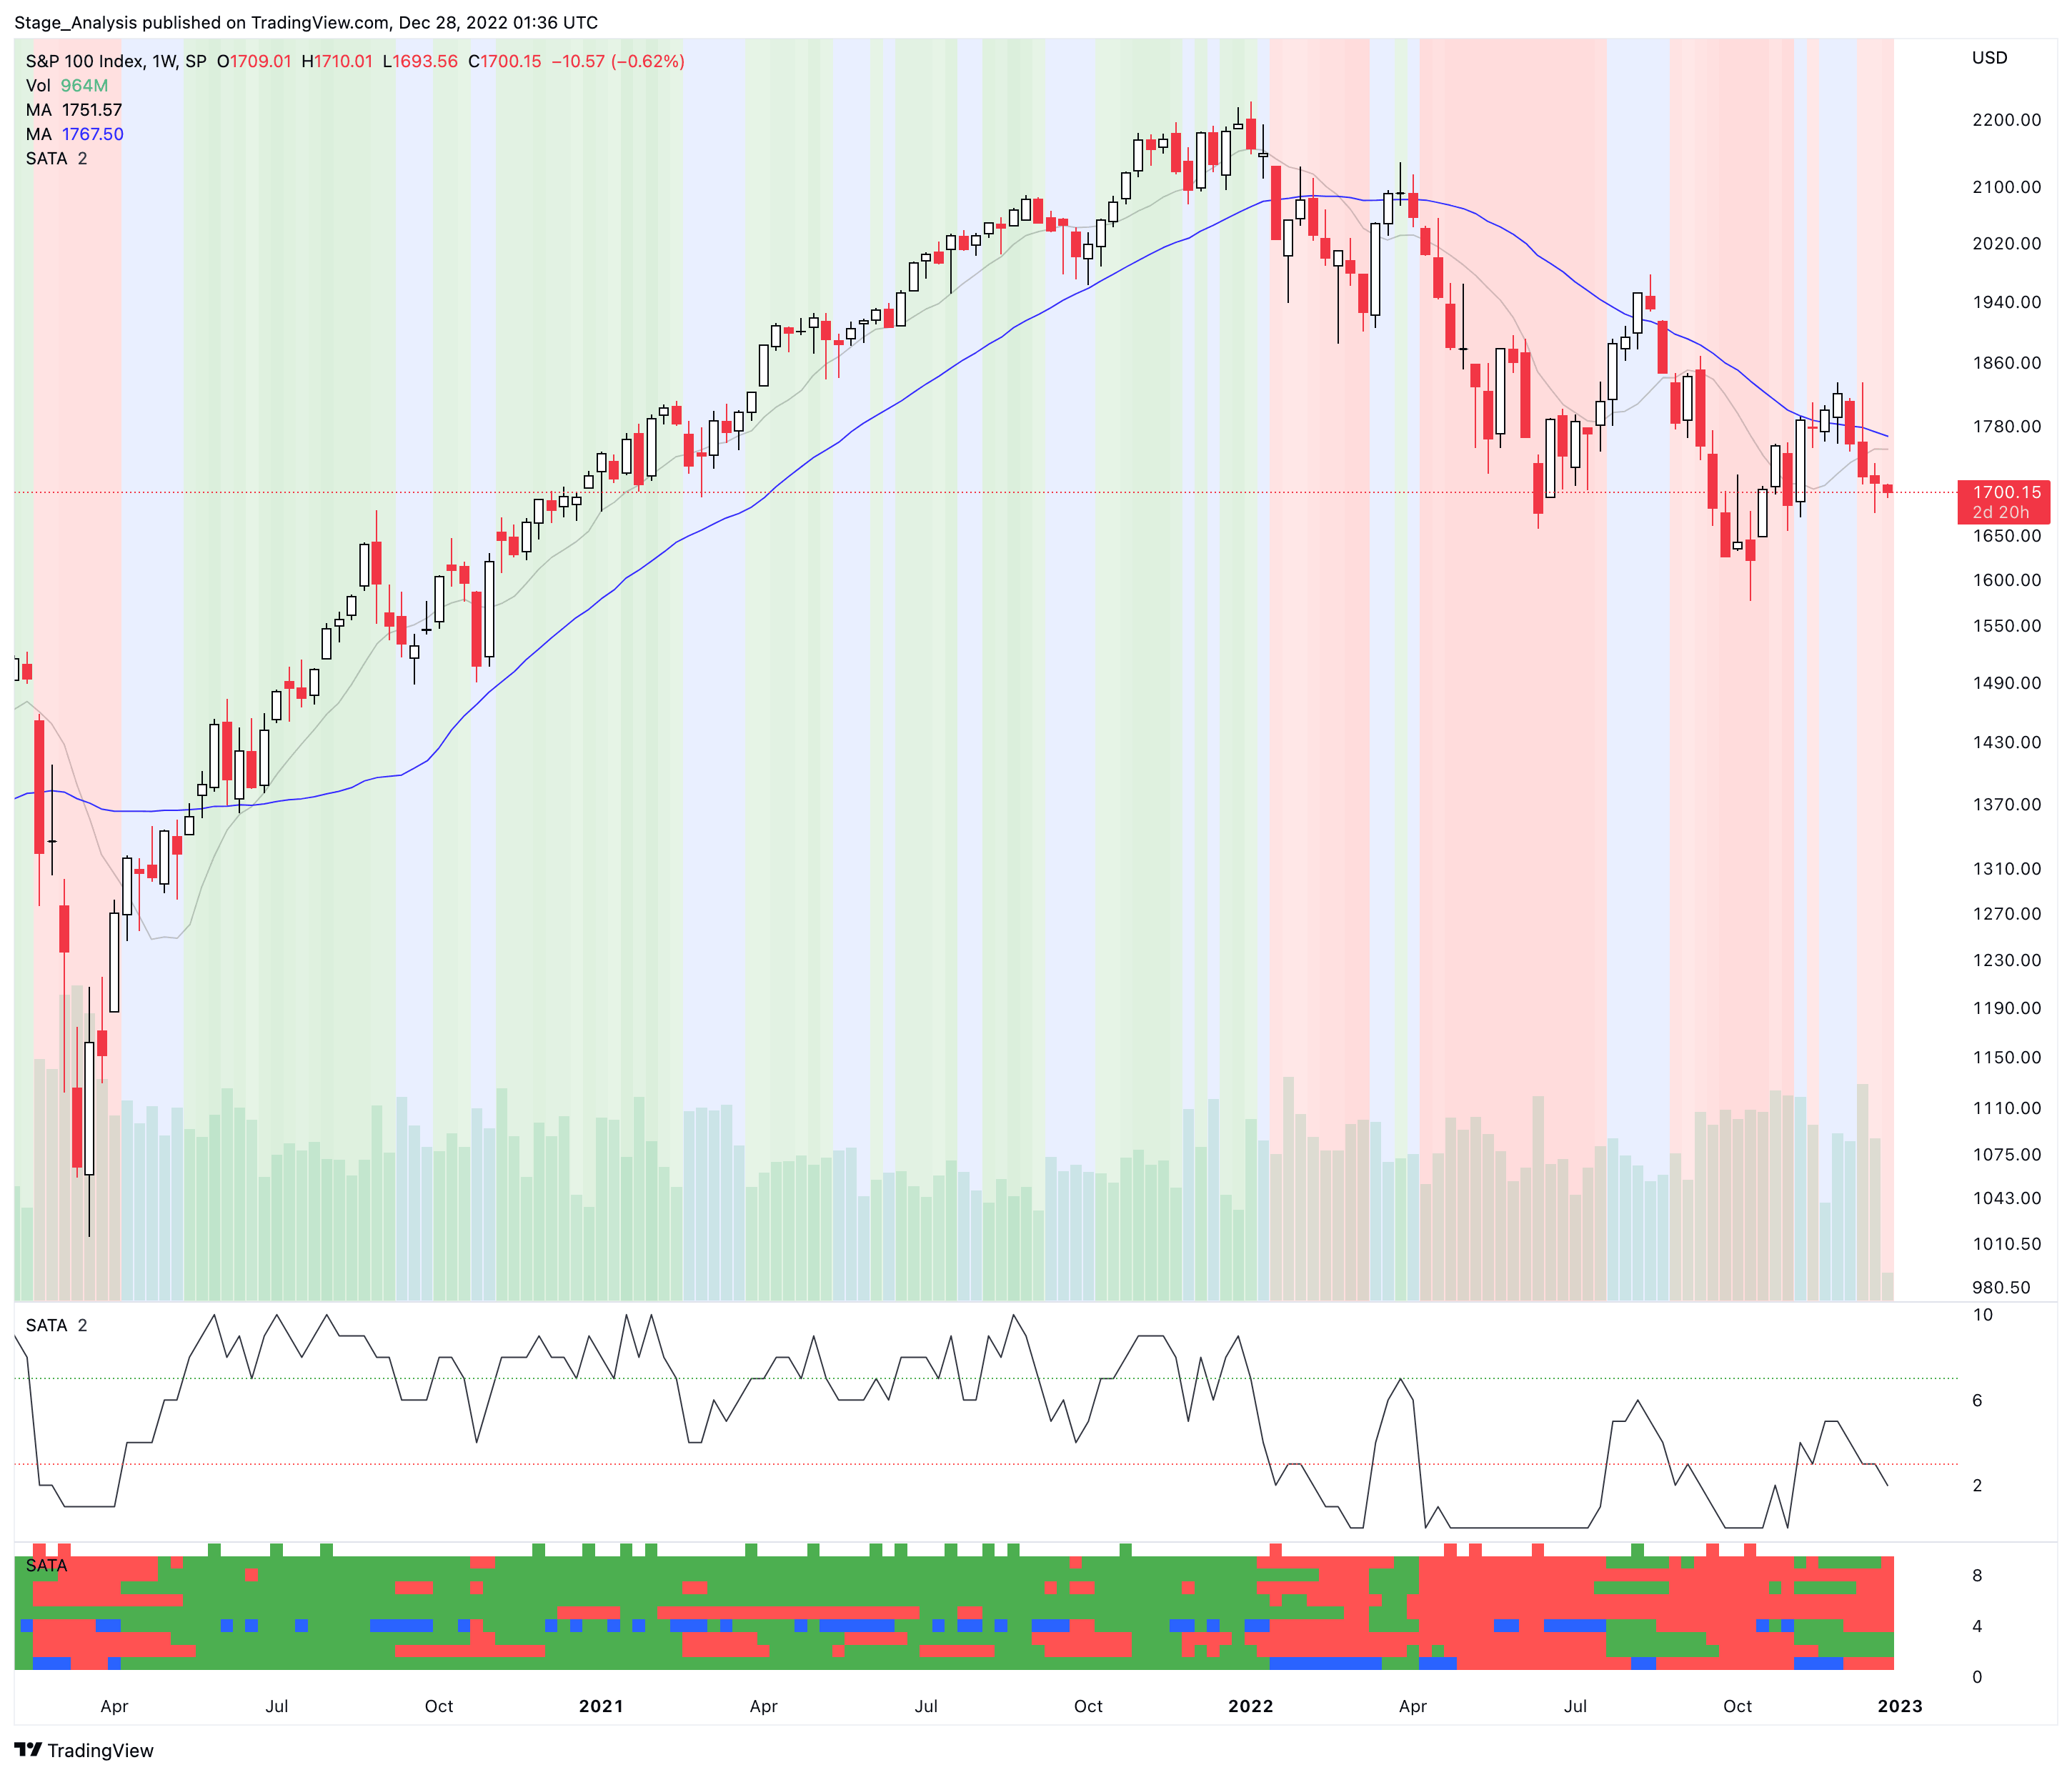
S&P 100 – SATA Weekly Chart
Below is the data tables of the S&P 100 stocks in order of their weekly SATA Score (Members only).
Become a Stage Analysis Member:
To see more like this – US Stocks watchlist posts, detailed videos each weekend, use our unique Stage Analysis tools, such as the US Stocks & ETFs Screener, Charts, Market Breadth, Group Relative Strength and more...
Join Today
Disclaimer: For educational purpose only. Not investment advice. Seek professional advice from a financial advisor before making any investing decisions.