
S&P 500 Testing the Top of the Intraday Stage 1 Range and the US Stocks Watchlist – 24 October 2022
The full post is available to view by members only. For immediate access:
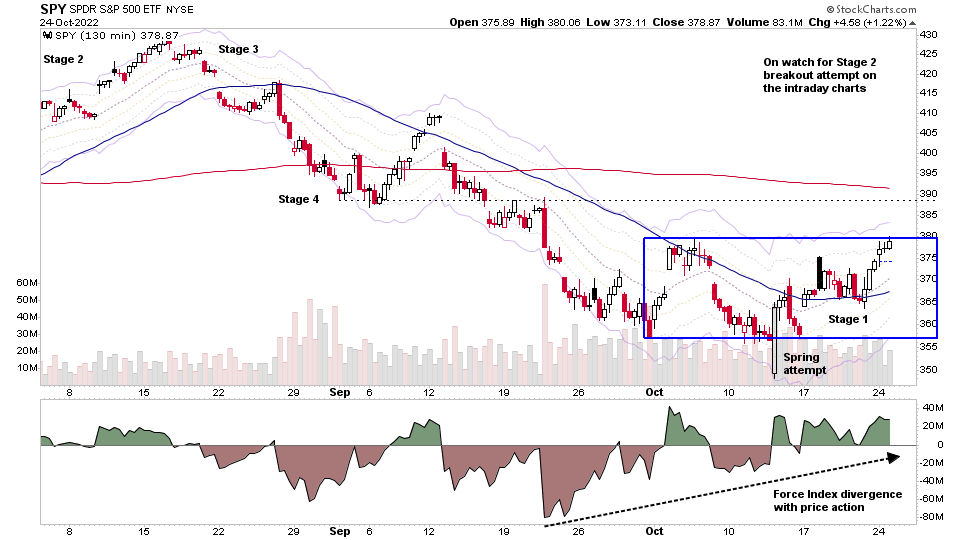
The S&P 500 (shown above via the SPY etf intraday 130 minute chart – 3 bars/day) continued higher towards the top of the October range that's developed as a Stage 1 base structure on the lower intraday timeframes, and is now testing the top of the range.
The indicator at the bottom of the chart is Force Index by Alexander Elder, which is an oscillator based on price and volume, and is calculated by:
Force Index(1) = {Close (current period)  -  Close (prior period)} x Volume
Force Index(13) = 13-period EMA of Force Index(1)
The 13-period EMA is used to smooth the oscillator, but other settings such as a faster 2-period EMA is also a popular setting.
Force Index is a useful alternative way to visualise the relationship between the price and volume action, and divergences can be used to help to spot potential turning points in bases, like which can be seen in the SPY chart above, with the supply peaks diminishing as price was still making lower lows, and then not going negative at all on Fridays low.
So this can be a useful indicator to look at to help to see the Effect versus the Result – which is one of the three Wyckoff laws to be aware of, and helps to spot a possible change in trend in the near future.
US Stocks Watchlist – 24 October 2022
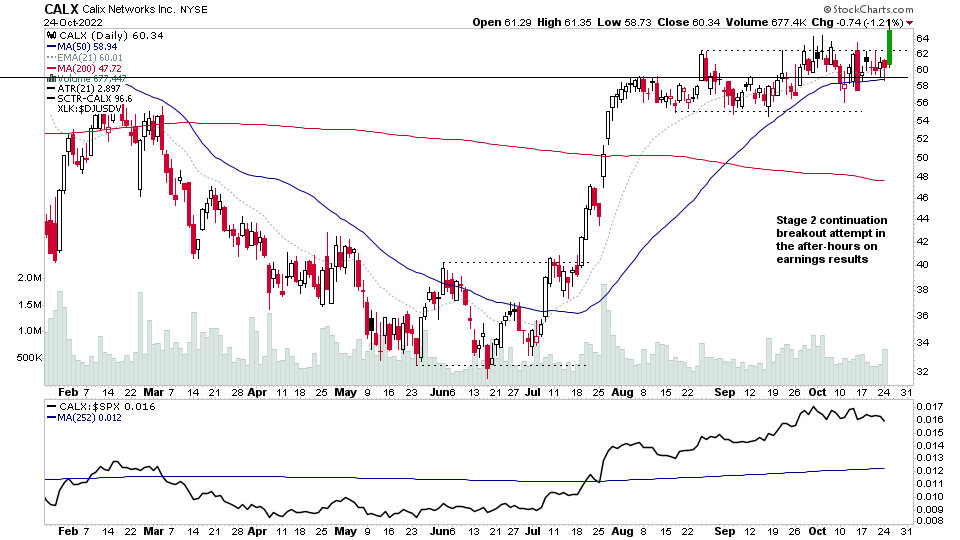
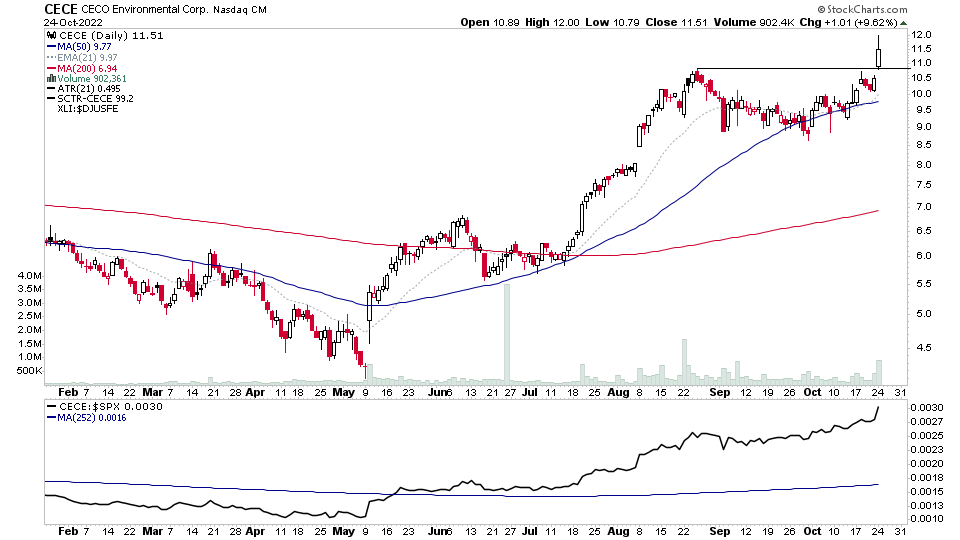
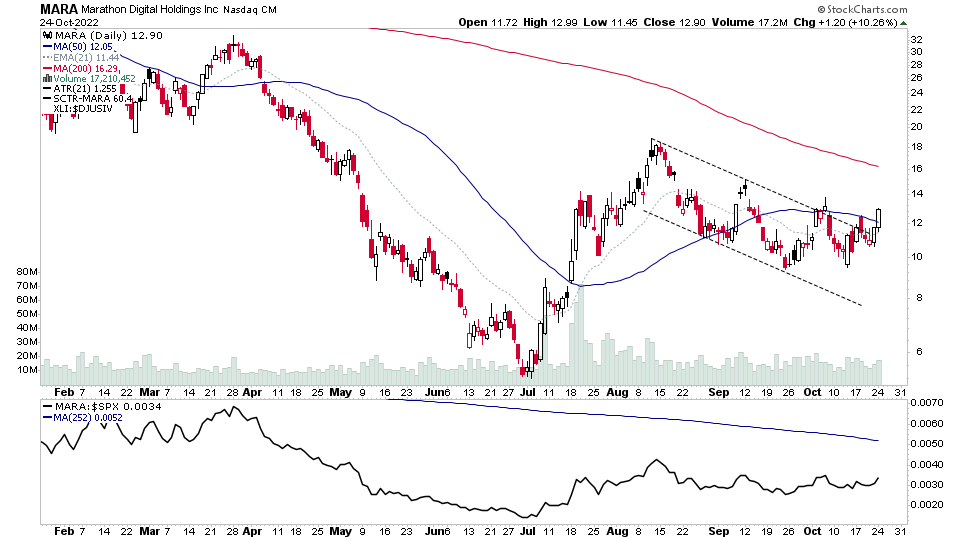
There were 18 stocks highlighted from the US stocks watchlist scans today
CALX, CECE, MARA + 15 more...
Become a Stage Analysis Member:
To see more like this – US Stocks watchlist posts, detailed videos each weekend, use our unique Stage Analysis tools, such as the US Stocks & ETFs Screener, Charts, Market Breadth, Group Relative Strength and more...
Join Today
Disclaimer: For educational purpose only. Not investment advice. Seek professional advice from a financial advisor before making any investing decisions.