
Market Breadth: Percentage of Stocks Above their 50 Day, 150 Day & 200 Day Moving Averages Combined
The full post is available to view by members only. For immediate access:
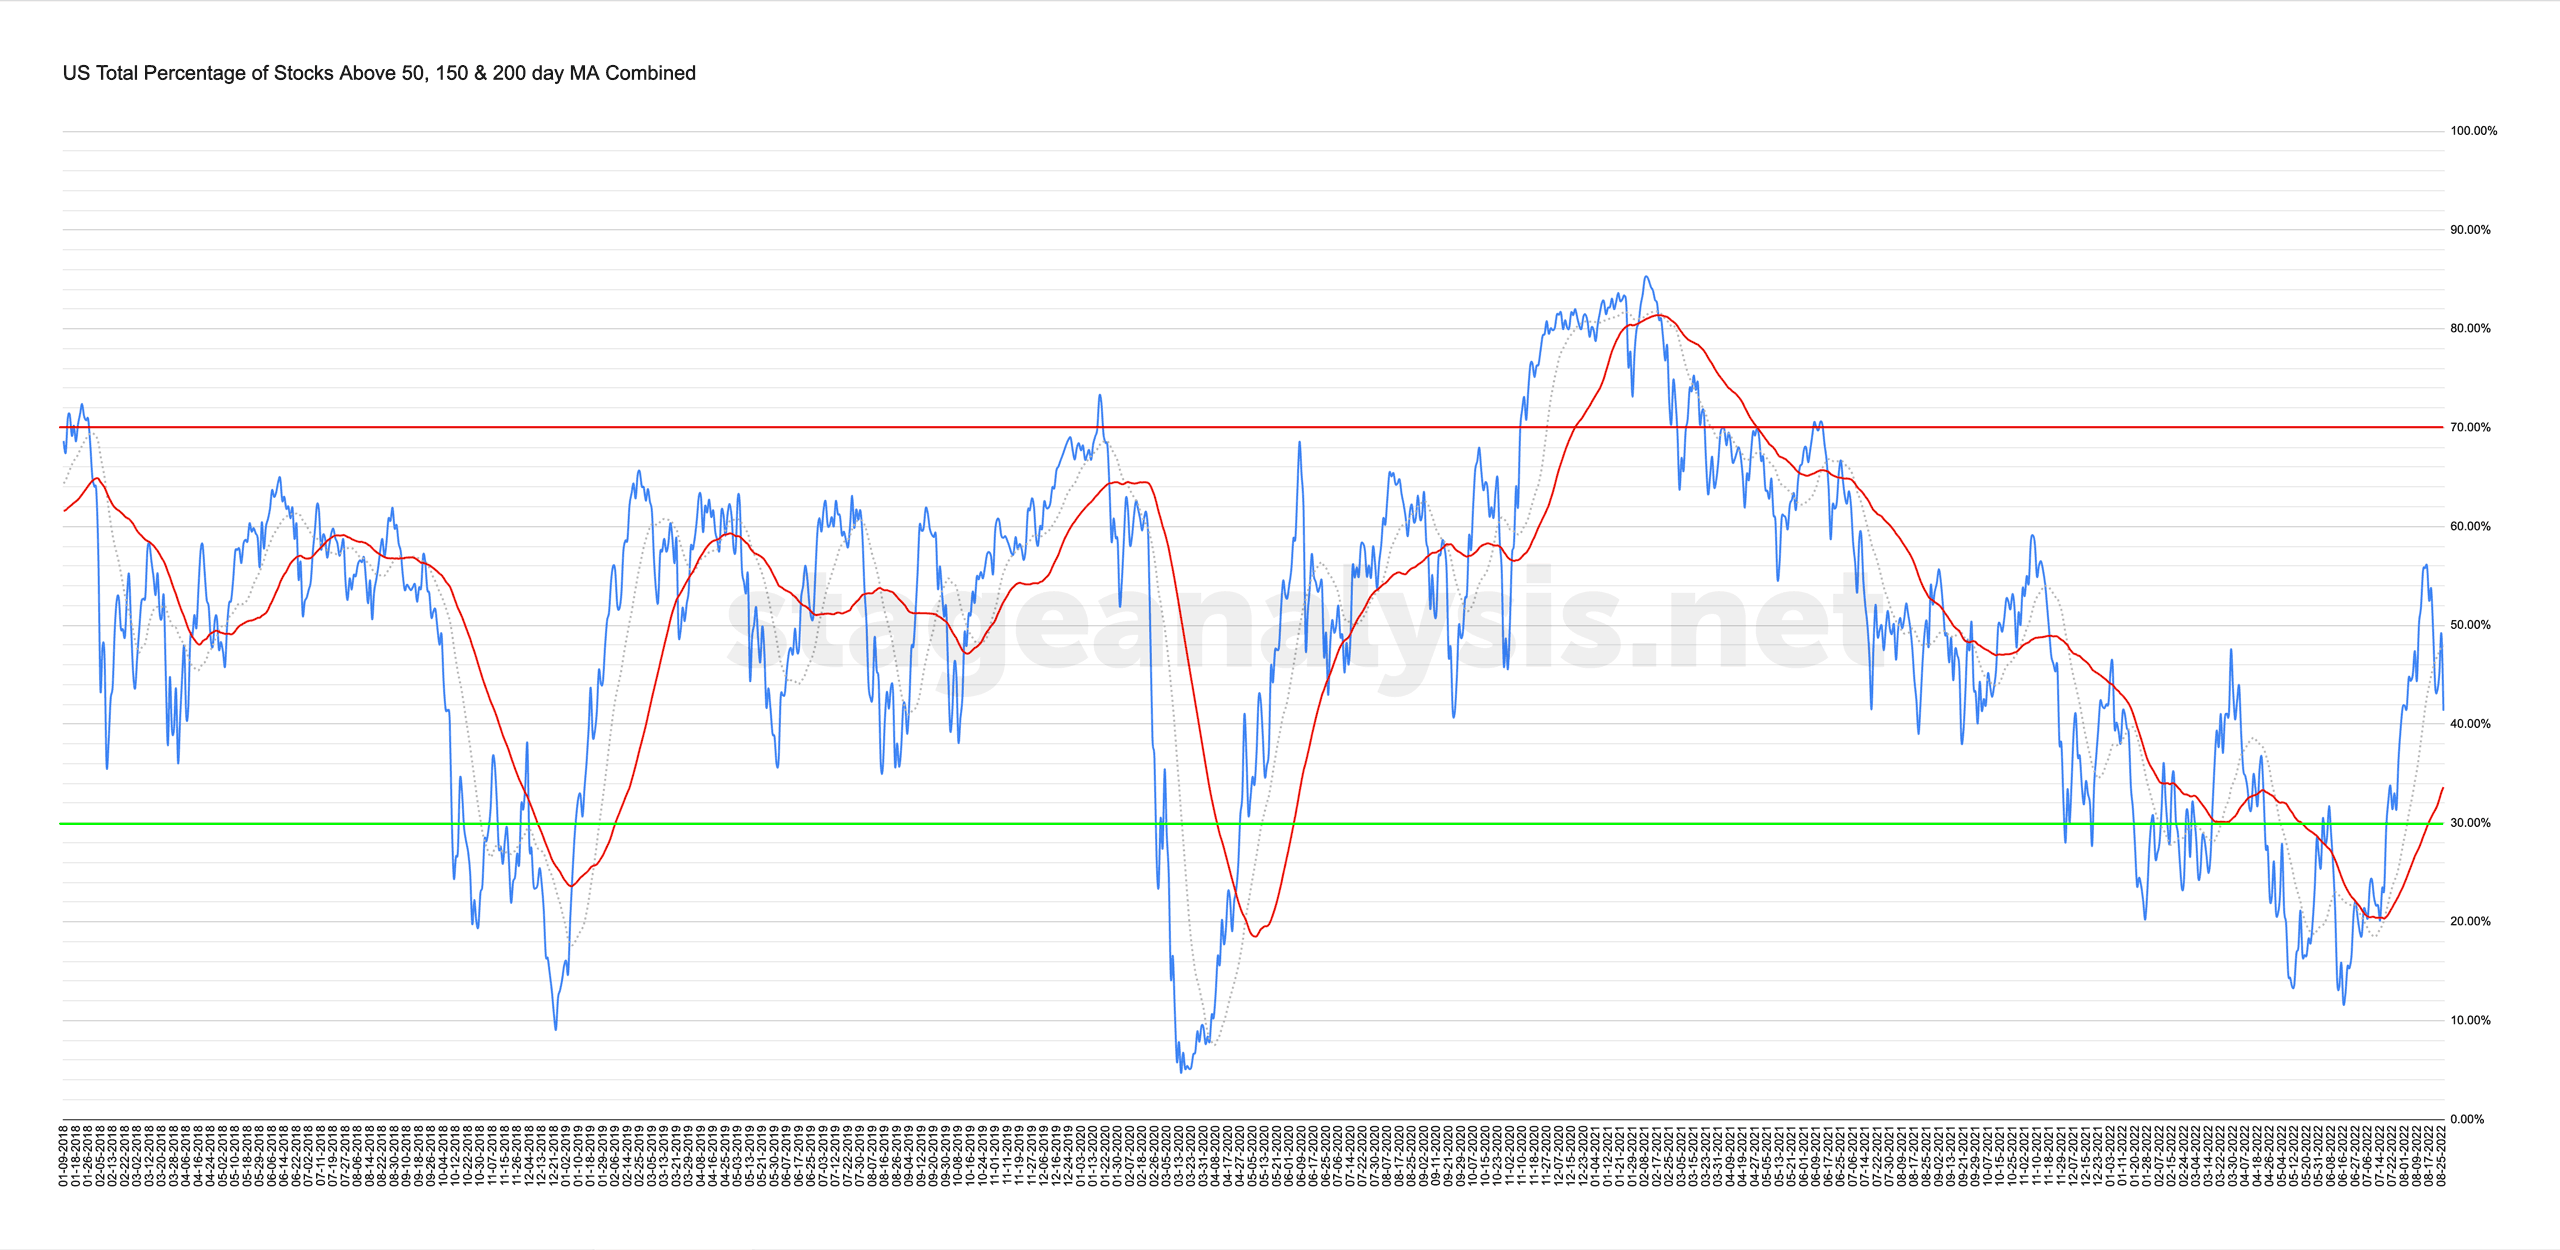
41.36% (-7.79% 1wk)
Status: Neutral Environment in the Stage 1 zone
The US Total Percentage of Stocks above their 50 Day, 150 Day & 200 Day Moving Averages extended last weeks pullback with a further decline of -7.79%, to close the week at 41.36%. So it just holds on to the lower end of the Stage 1 zone (between 40% to 60%) and hence could easily start to fall back into Stage 4 territory (by this breadth measure) if the decline continues for another week.
However, it remains +7.73% above its own rising 50 day MA, but has fallen below its 20 day MA. So the status shifts to a Neutral Environment in the Stage 1 zone with the P&F chart on Defense (see below).
I will talk more about this and all of the other combined moving average breadth charts from the full members post in detail during the Stage Analysis Members weekend video – which is scheduled for later on Sunday afternoon EST.
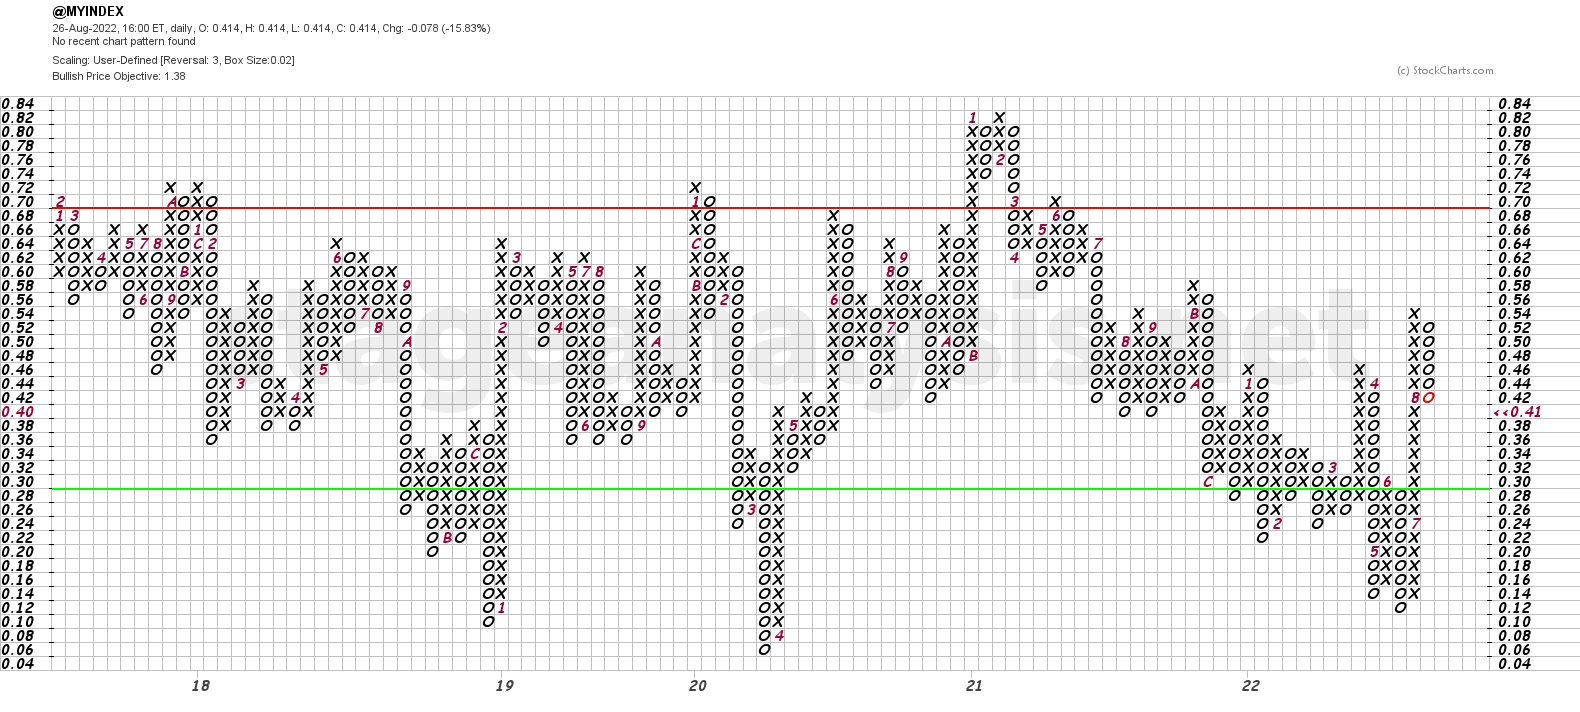
The Point & Figure chart reversed to a column of Os this week with the break below 48%, and dropped 6 O's to close the week at 41.36%. So the reversal to the column of O's changes the P&F status to Bull Correction and switches the strategy to Defense.
To learn more about the P&F statutes and how they are triggered, view the Bullish Percent article.
Become a Stage Analysis Member:
To see more like this – US Stocks watchlist posts, detailed videos each weekend, use our unique Stage Analysis tools, such as the US Stocks & ETFs Screener, Charts, Market Breadth, Group Relative Strength and more...
Join Today
Disclaimer: For educational purpose only. Not investment advice. Seek professional advice from a financial advisor before making any investing decisions.