
AMZN – Multiple Timeframe Analysis and the US Stocks Watchlist – 28 July 2022
The full post is available to view by members only. For immediate access:
Today was a big day for earnings results, with over 300+ stocks reporting including more mega caps that have a greater influence on the US stock market, with AAPL (Apple) and AMZN (Amazon) both reporting and moving higher in the after hours trade.
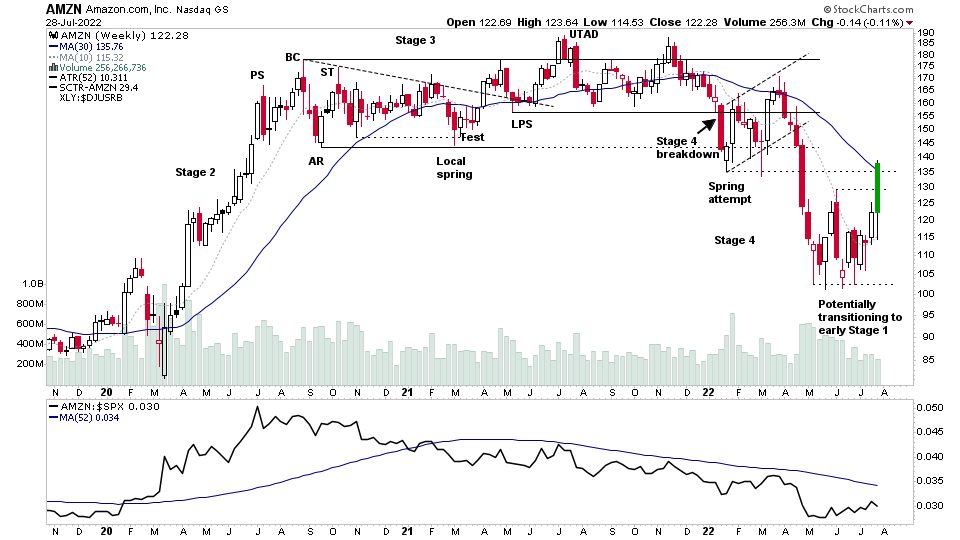
The AMZN charts have been marked up on multiple timeframes, starting with the weekly chart (shown above) that shows how it's gone through the complete four stages cycle over the last few years, with todays after-hours move (highlighted with the green candlestick) potentially signalling a move into early Stage 1 – which is the basing phase.
However, the weekly chart shows that it is now moving into a major congestion area of the previous lows from the huge Stage 3 range, and the initial base that formed as a bear flag after it broke down into Stage 4 in January, as well as the still declining 30 week MA. Hence, there is a lot of overhead resistance, which will likely hinder it from making too much progress in the near term, and so it could easily turn back lower to continue developing a higher Stage 1 base range. As it's only currently in Phase B of the weekly base structure, and so the heavy overhead resistance and declining 30 week MA increases the odds of it forming as an Upthrust in the near-term.
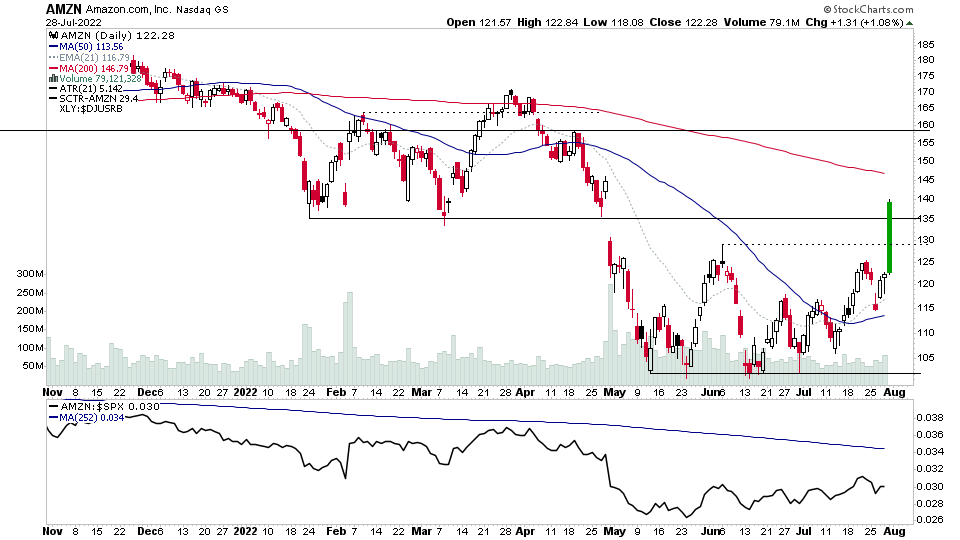
The daily chart gives some further context to the after-hours move in AMZN, with it clearing multiple near-term pivots, but it is still below the declining 200 day MA, and you can see that the shorter-term moving averages (21 day EMA and 50 day MA) are both still more than 25% below the 200 day MA, and hence that suggests that the Stage 1 basing process could need a much longer period to develop, to work off the resistance and give the moving averages time to recover.
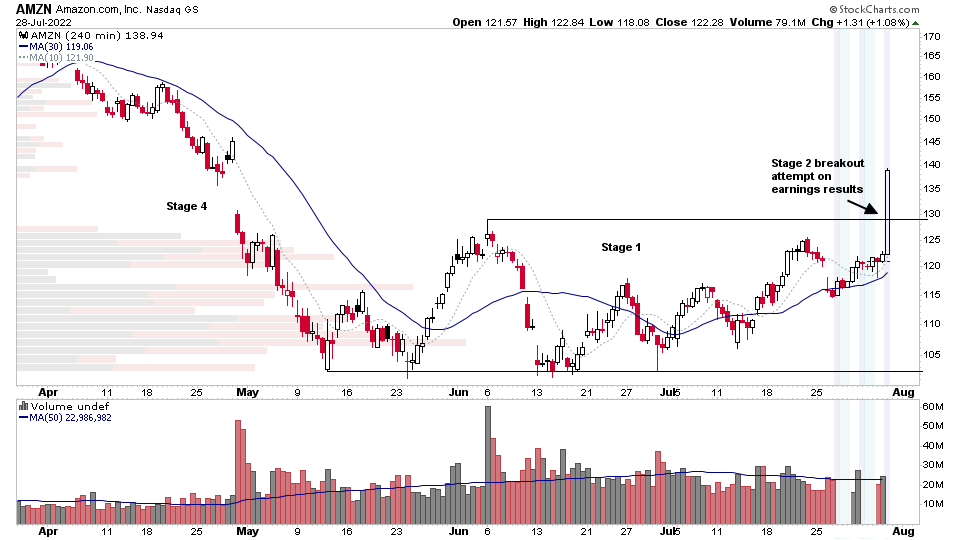
Finally, above is the 4-hour intraday chart with the after-hours data turned on, to show the price action since the close.
The chart zooms into the last 4 months and has the same relative settings as the weekly Stage Analysis chart, and so you can see that it has been forming a Stage 1 base on this lower timeframe since May, and the after-hours move is a strong Stage 2 breakout attempt on this chart. But as we know by looking at the higher timeframes of the weekly and daily charts. The breakout is moving into a potential resistance zone, and so there's potential for a backup / pullback towards the breakout level around 130 to develop, which if it fails it could form as an Upthrust.
Become a Stage Analysis Member:
To see more like this – US Stocks watchlist posts, detailed videos each weekend, use our unique Stage Analysis tools, such as the US Stocks & ETFs Screener, Charts, Market Breadth, Group Relative Strength and more...
Join Today
Disclaimer: For educational purpose only. Not investment advice. Seek professional advice from a financial advisor before making any investing decisions.