
US Stock Market Update Plus Stocks Watchlist of Stocks Basing in Stage 2 With Breakout Potential
Update of the major US stock market indexes and the key market breadth indicators. Plus a multi-time frame analysis of my current watchlist stocks near positions for potential trades, if they breakout on strong volume from their current bases: $PINS, $FSLY, $BYND, $BE, $WRTC, $ARLO
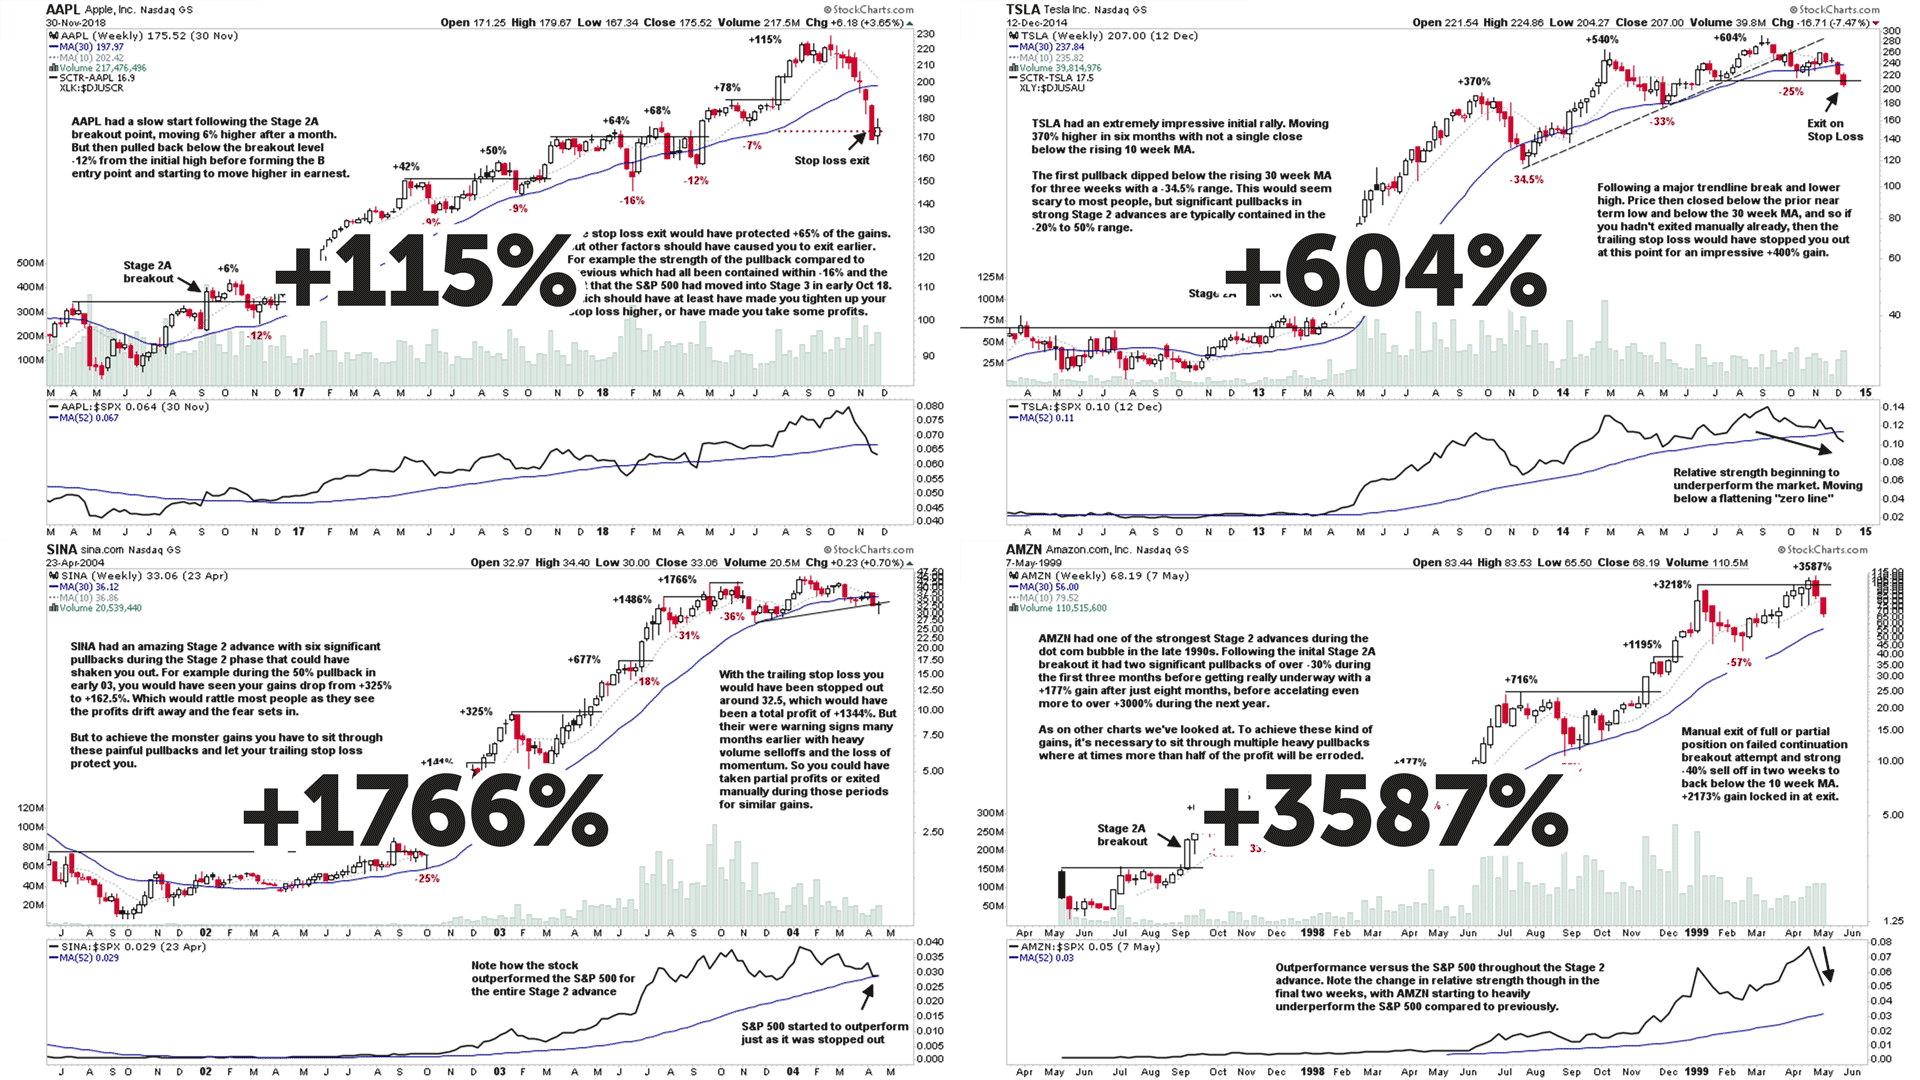
Learn Stage Analysis – Video Course
Learn the Four Stages of Stan Weinstein's Stage Analysis method and the Ideal Entry points for both the Investor and Trader methods in a 3.5 hour video course that runs through multiple real examples to help you learn what to look for.
Includes a 30 minute FREE preview. So start learning today via this link:
https://www.udemy.com/course/learn-stock-trading-investing-techniques-stage-analysis
Follow us on Social Media:
Twitter: https://twitter.com/stageanalysis
Stocktwits: https://stocktwits.com/StageAnalysis
Quick Links:
- Major Market Indexes – S&P 500, Nasdaq, NYSE & S&P 600 Small Caps (0:53)
- US Treasuries & Commodities – 7-10 Year US Treasuries, Gold, Crude Oil & Copper (3:37)
- Sector Breadth: Percentage of Stocks Above Their 150 Day Moving Average – Relative Strength Table (5:37)
- Sector Breadth: Percentage of Stocks Above Their 150 Day Moving Average – Visual Diagram (6:52)
- NYSE Bullish Percent Index & Percentage of Stocks Above Their 200, 150 & 50 Day Moving Averages Charts (7:46)
- US Combined Percentage of Stocks Above Their 200, 150 & 50 Day Moving Averages Charts (9:47)
- Percentage of Stocks Above Their 20 Day Moving Averages Charts (11:05)
- NYSE Advance Decline Line Charts (13:12)
- US New Highs - New Lows Charts & Momentum Index (15:22)
- Stocks In Focus
- $PINS - Pinterest (16:30)
- $FSLY - Fastly (18:52)
- $BYND - Beyond Meat (20:58)
- $BE - Bloom Energy (23:34)
- $WRTC - Wrap Technologies (27:15)
- $ARLO - Arlo Technologies (31:47)
- Learn Stage Analysis Video Course on Udemy (35:14)
A regular look beneath the surface of the US stock market, featuring the key market breadth charts for timing trading stocks and the stock market indexes, such as the NYSE Bullish Percent Index, the Advance Decline Line, the New Highs - New Lows etc and some custom breadth indicators of my own in order to determine what the "Weight of Evidence" is suggesting in terms of the US stock market direction and how to allocate your money.
Disclaimer: For educational purpose only. Not investment advice. Seek professional advice from a financial advisor before making any investing decisions.