
Stock Market Update and US Stocks Watchlist – 26 June 2022
The full post is available to view by members only. For immediate access:
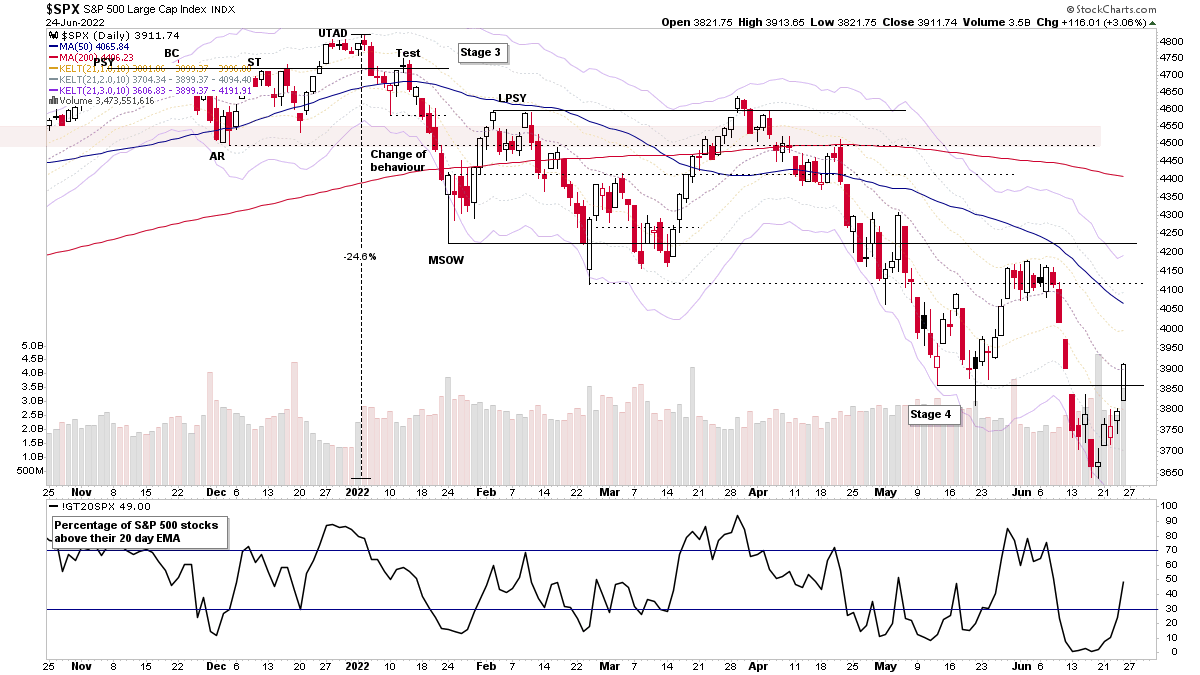
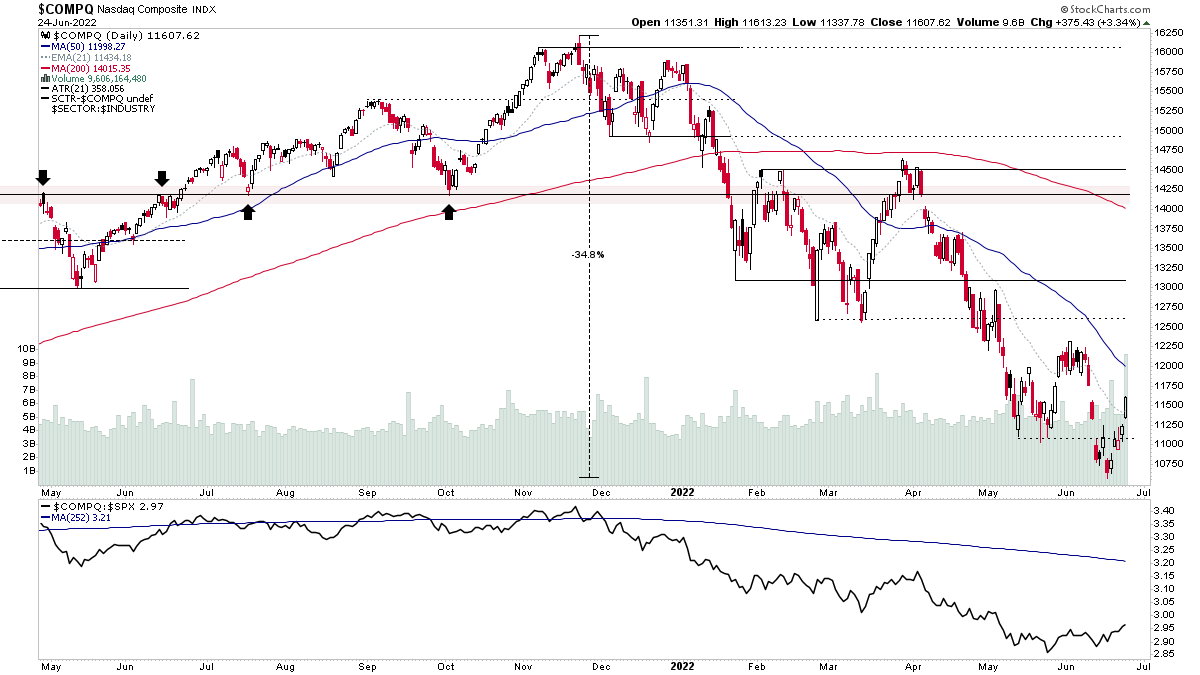
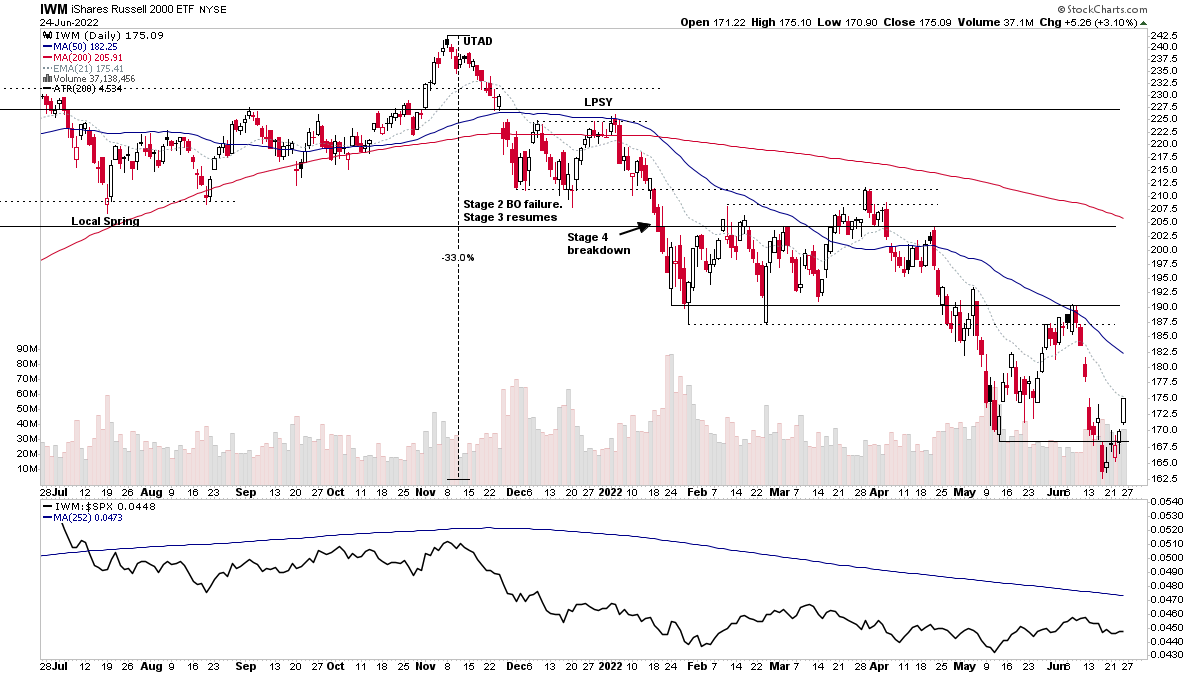
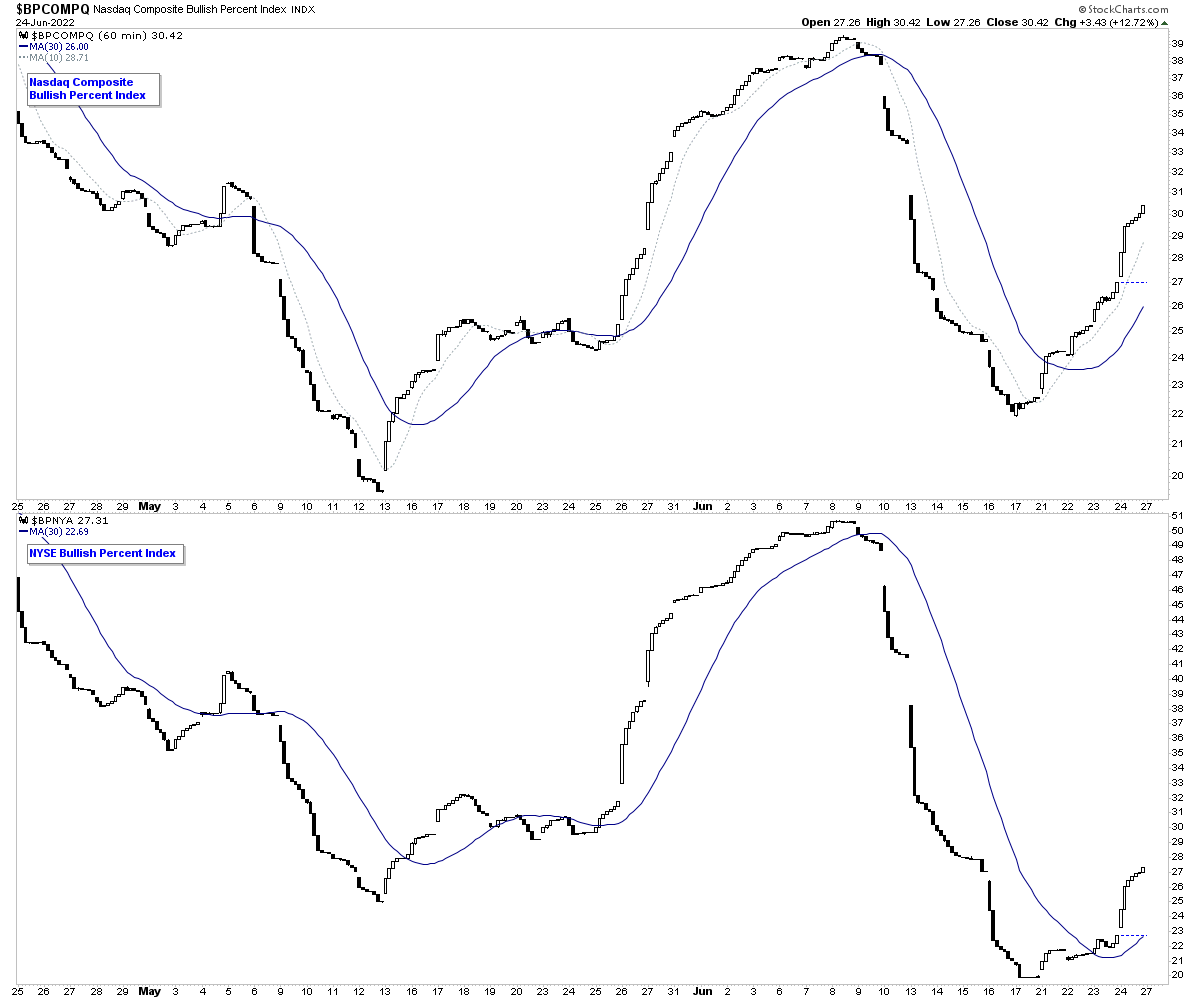
The stock market saw strong moves on Friday with the 5th attempt at a Follow Through Day (FTD) forming of this Stage 4 decline, which coincided with other short-term signals with the percentage of stocks above their 20 day EMAs moving strongly out of the lower zone in all the major markets, which changes those to positive status (see the indicator at the bottom of the S&P 500 chart attached). Also, the short-term Bullish Percent Index 1hr chart in the Nasdaq Composite (see lower in the article) moved back to positive status on Wednesday and followed through into the end of the week with the NYSE also joining it.
So although the FTD volume is suspect due to the Russell rebalancing, and is making many question it. There are other market breadth measures showing the short-term status changes at the same time. Hence, as with previous FTDs, it's a time to test the market on the long side using progressive exposure in areas showing strength.
It may not work once more, as the market remains in Stage 4 currently, and hence it's a short-term counter-trend rally attempt. But, at some point, a counter-trend rally will develop into Stage 1, and we'll start to see more setups develop and breakouts beginning to work again. So we just have to take it a step at a time and manage risk accordingly.
US Stocks Watchlist – 26 June 2022
There were 30 stocks for the US stocks watchlist today.
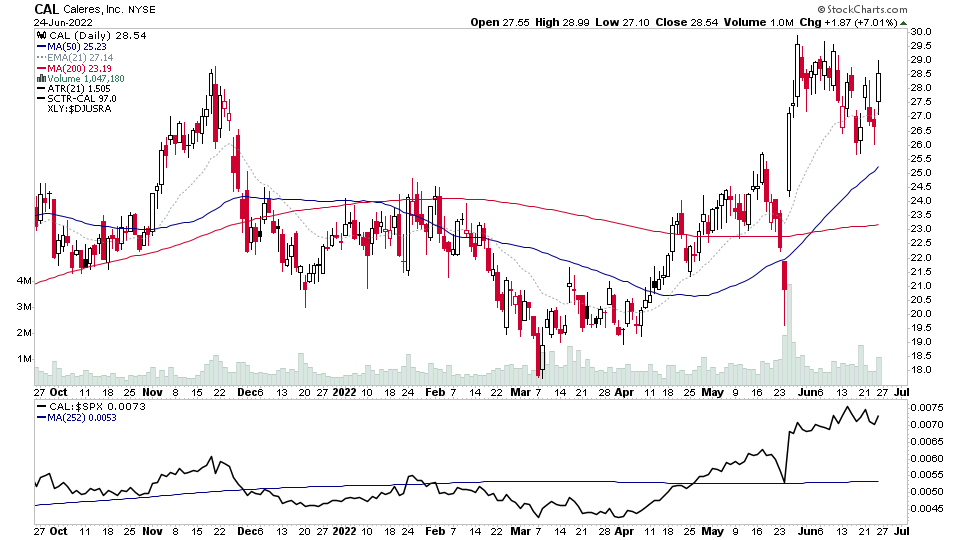
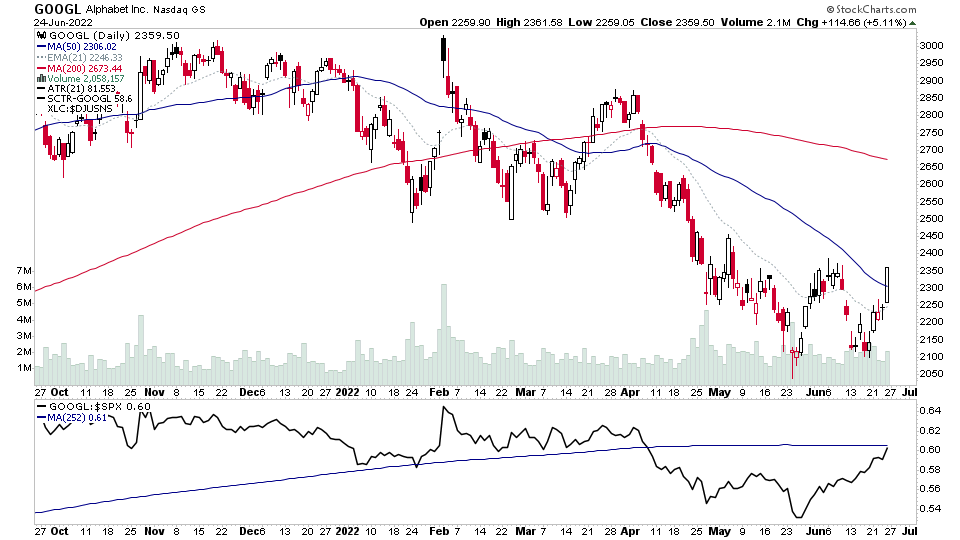
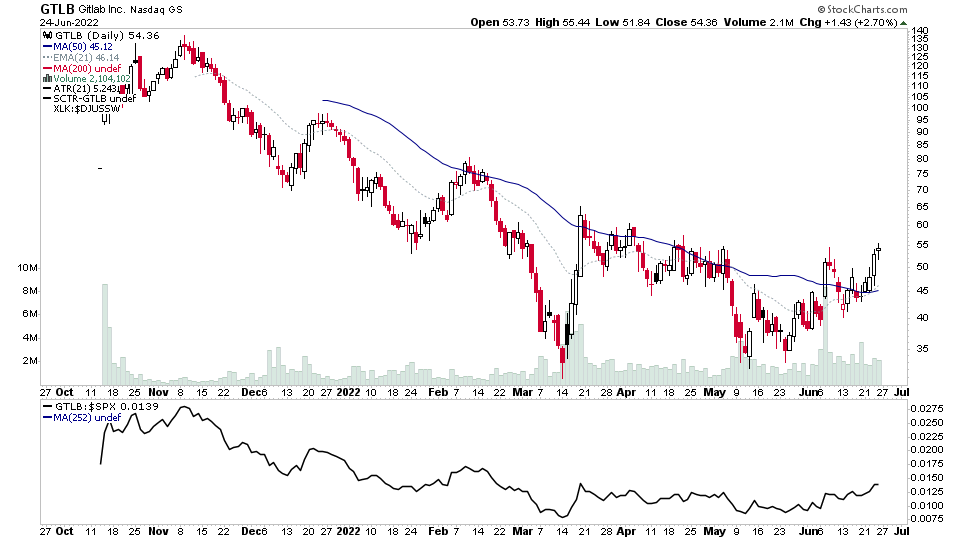
AAPL, CAL, GOOGL, GTLB + 26 more...

Market Breadth: NYSE & Nasdaq Bullish Percent Index
Short Term – Follow Through
In Wednesday's post, I talked about a potential status change to a tentative positive status for the Nasdaq Composite Bullish Percent Index (BPI) short-term chart, which saw follow-through on Thursday and Friday and was also joined by the NYSE BPI as it moved through its 30 bar MA which then turned up. So, both the Nasdaq and NYSE are now on short-term positive environment status for this indicator.
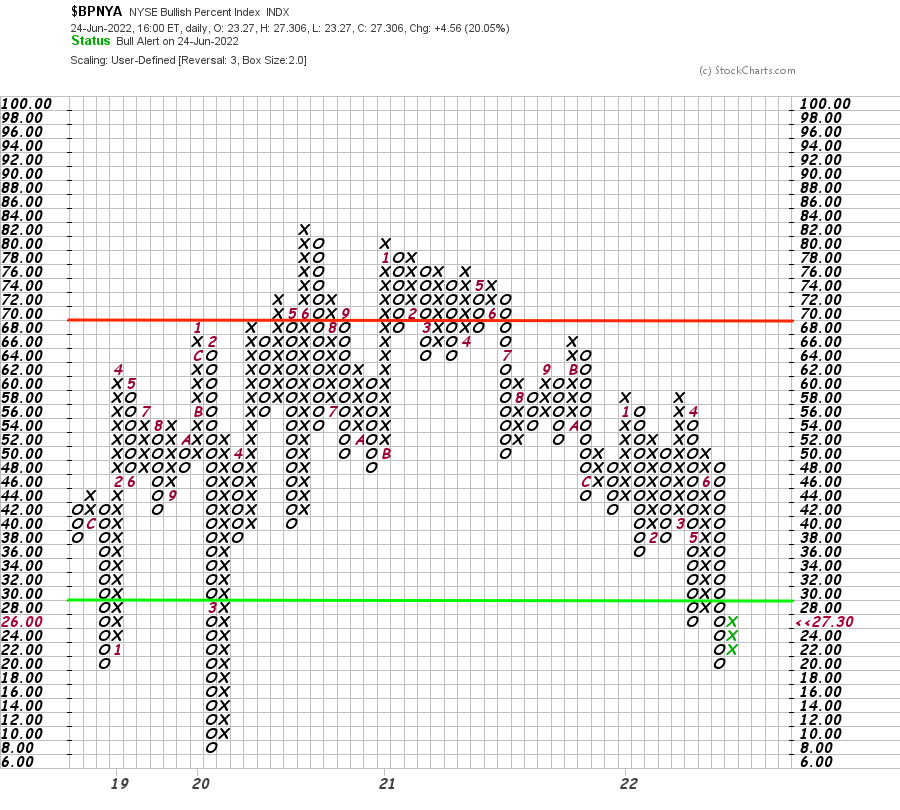
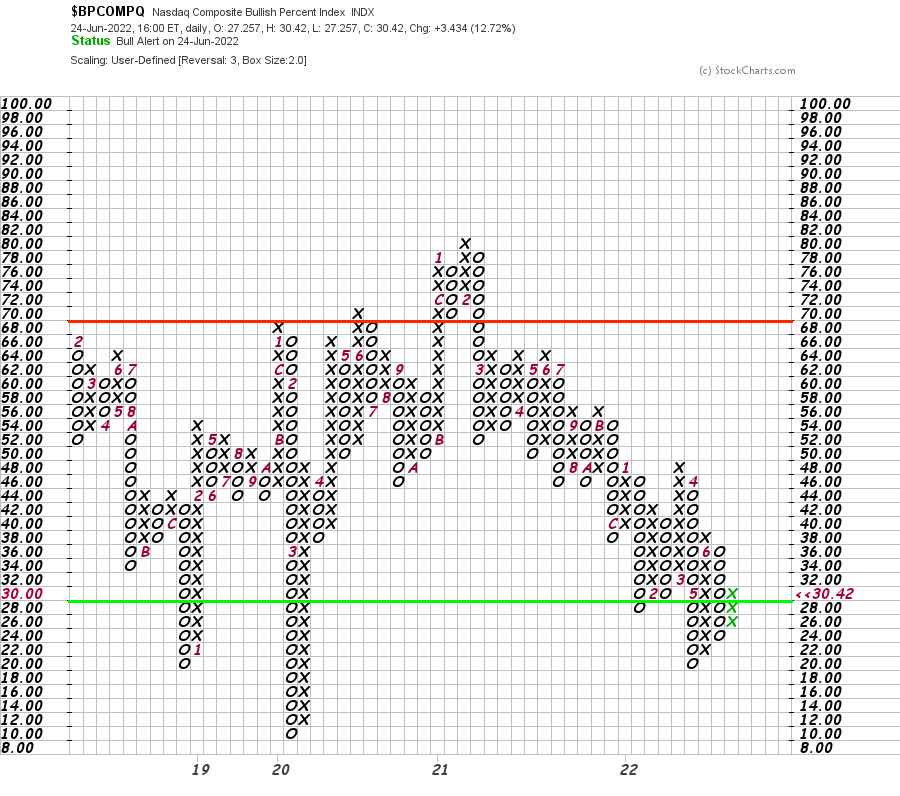
Long Term – status change to Bull Alert
The Bullish Percent Index Point & Figure charts are used for the long-term statuses, and both the NYSE and Nasdaq Composite charts saw a reversal on Friday to a column of X's in the lower zone, which changes the P&F status of both to Bull Alert status.
Become a Stage Analysis Member:
To see more like this – US Stocks watchlist posts, detailed videos each weekend, use our unique Stage Analysis tools, such as the US Stocks & ETFs Screener, Charts, Market Breadth, Group Relative Strength and more...
Join Today
Disclaimer: For educational purpose only. Not investment advice. Seek professional advice from a financial advisor before making any investing decisions.