
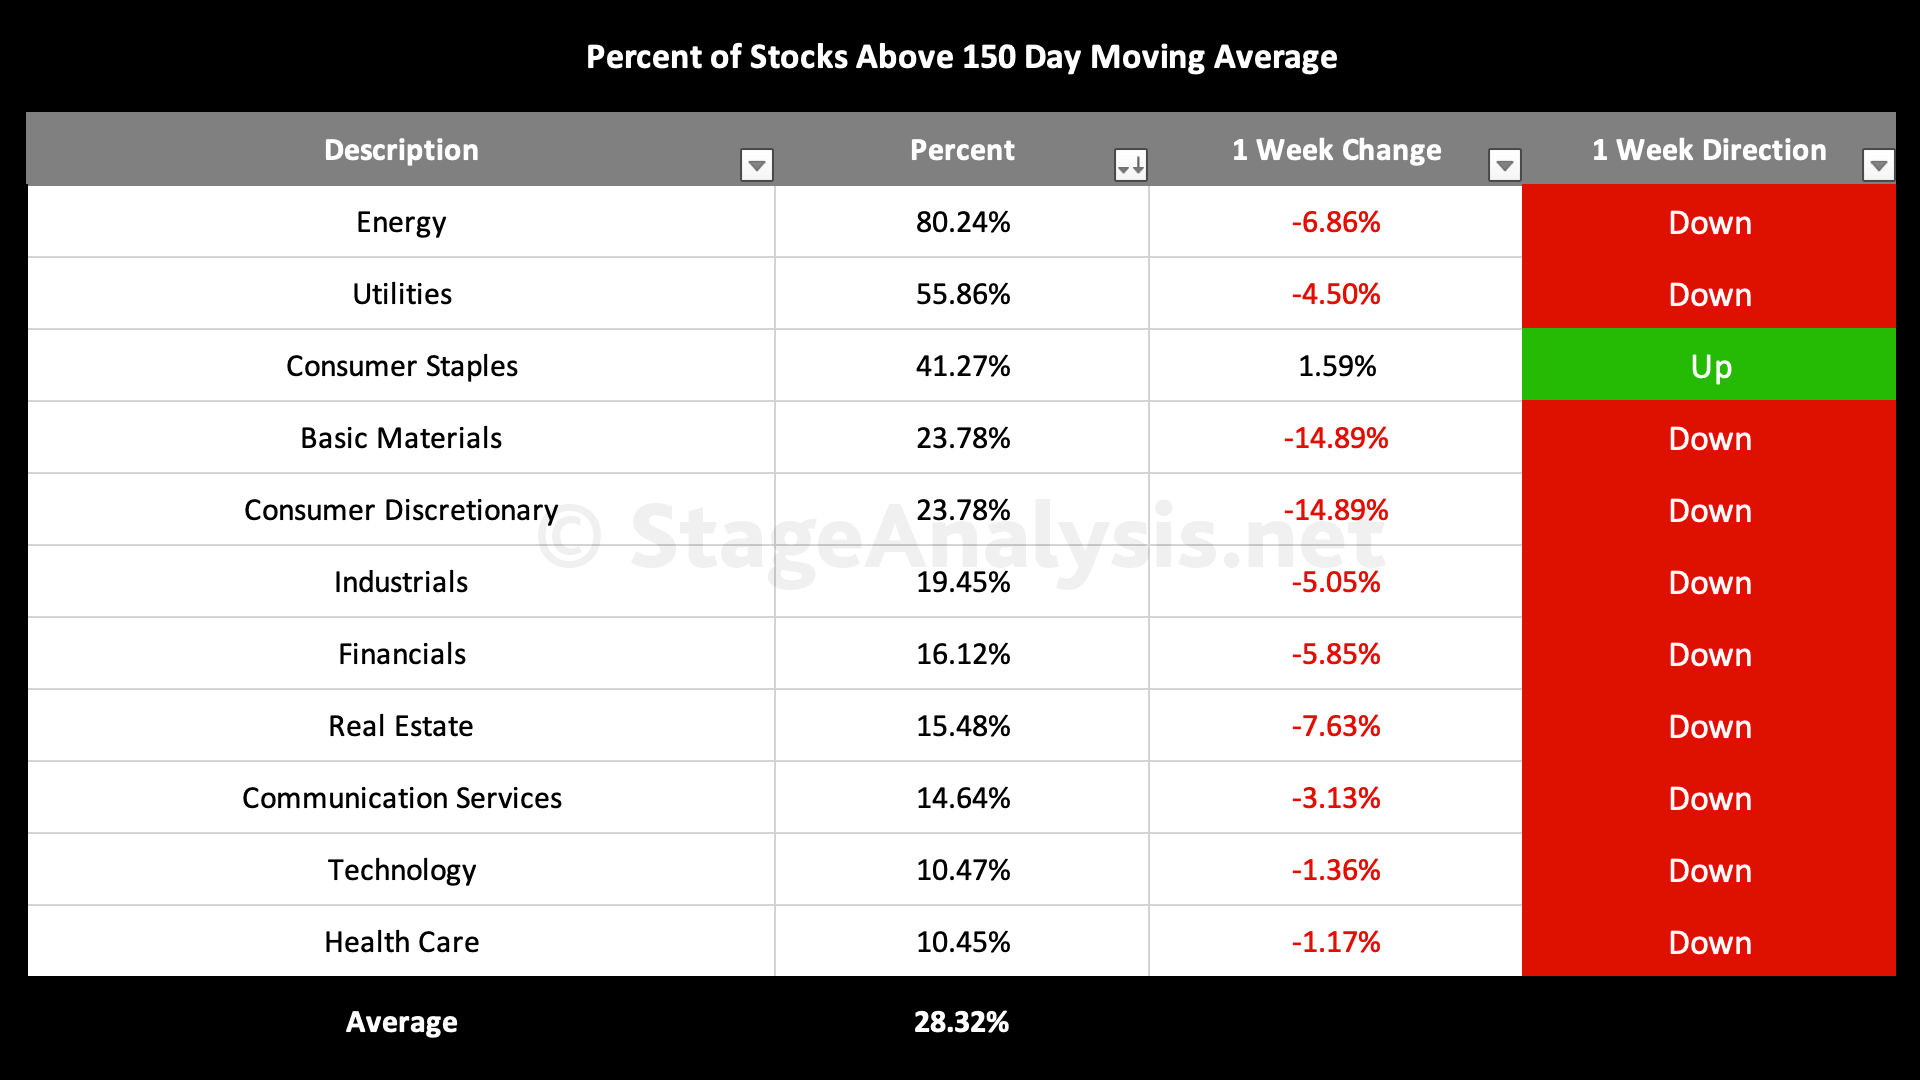
Sector Breadth: Percentage of US Stocks Above Their 150 day (30 Week) Moving Averages
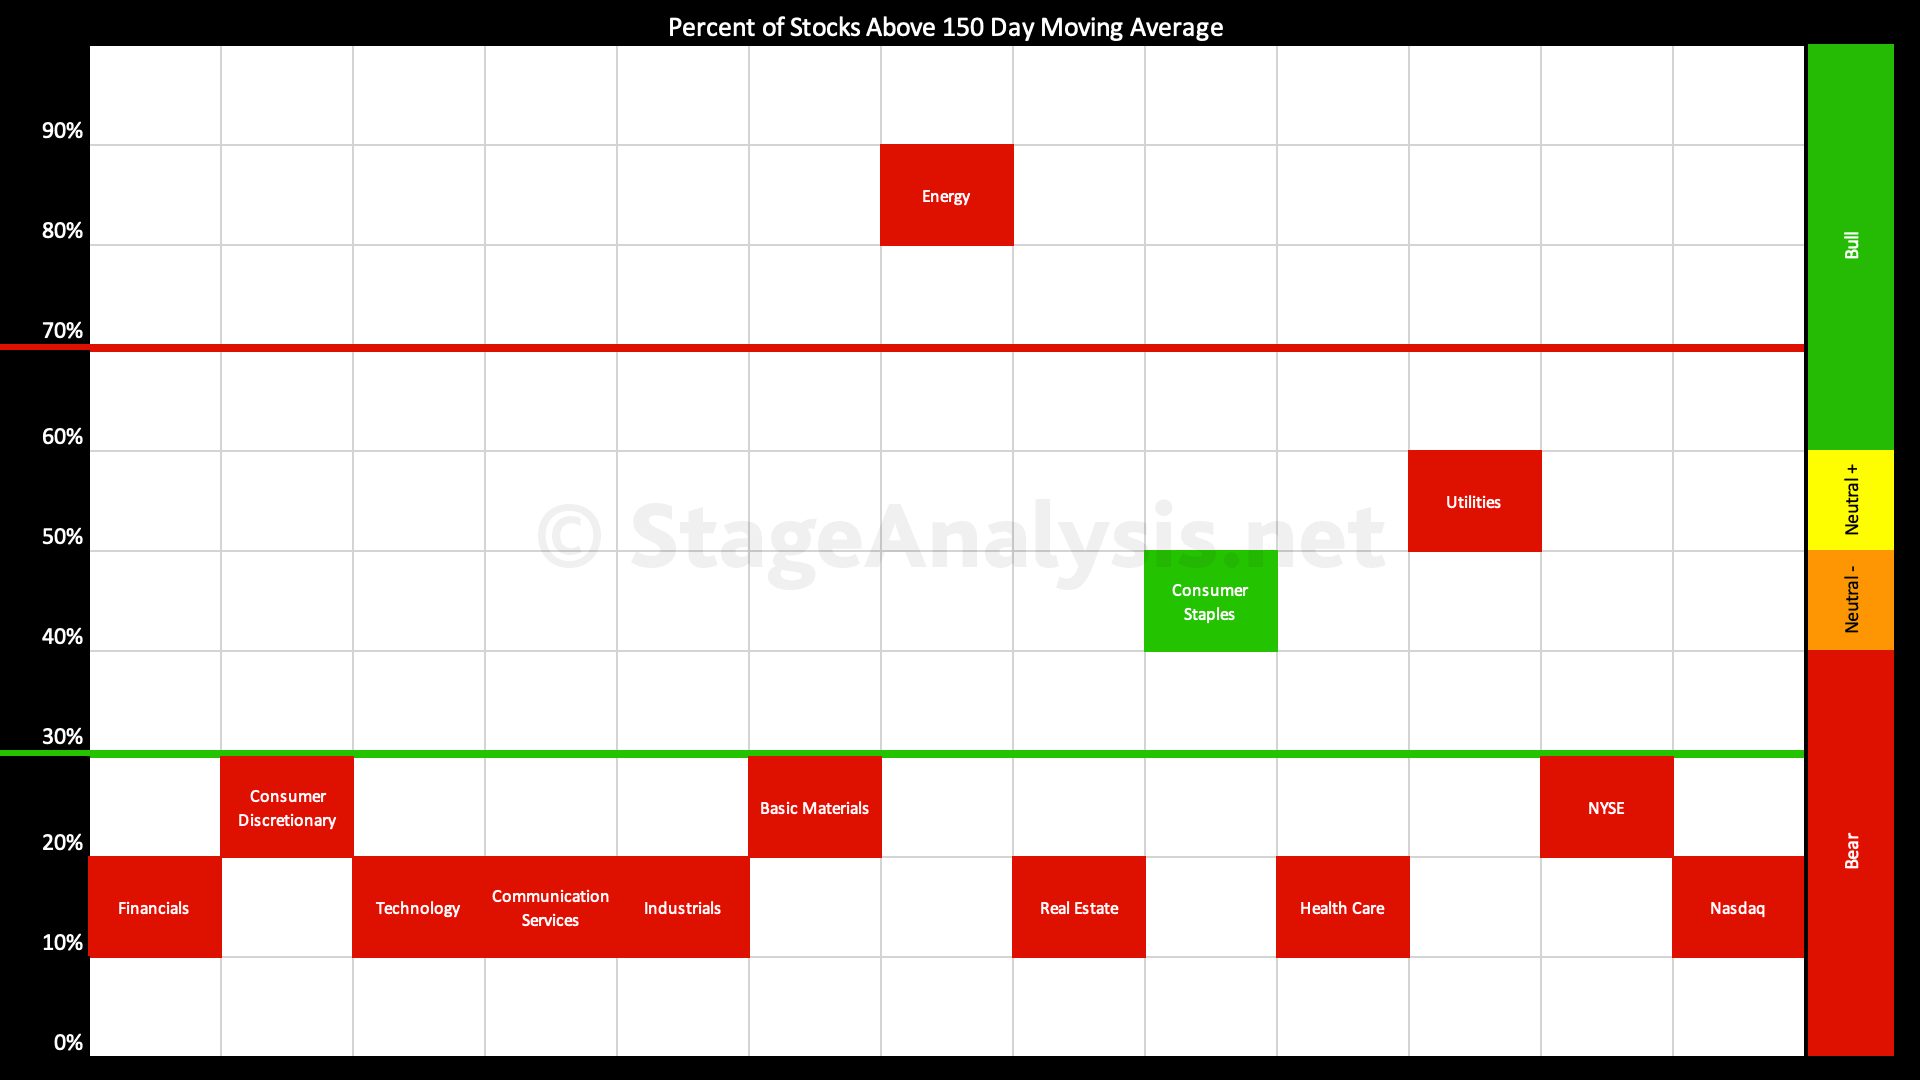
Average: 28.32% (-5.79% 1wk)*
- 1 sector is in the Stage 2 zone (Energy)
- 2 sectors are in Stage 1 / 3 zone (Utilities, Consumer Staples)
- 8 sectors are in Stage 4 zone (Basic Materials, Consumer Discretionary, Industrials, Financials, Real Estate, Communication Services, Technology, Health Care)
It's been three weeks since I last updated the Sector breadth table. See the previous post from the 23rd April: Sector Breadth: Percentage of US Stocks Above Their 150 day (30 Week) Moving Averages for comparison of what's changed. As you will see the majority of sectors have now fallen into the lower zone – which we haven't seen on the sector breadth visual since March 2020.
So it's reached an extreme. But unlike the March 2020 visual, the current market still has a few sectors in the mid and upper zones, as Energy remains at very high level of 80.24%. However the Energy sector has dropped from over 90%, and so on the point and figure chart it's reversed to a column of Os, and hence the P&F status would now be on Bull Top status for energy.
With the sectors weighted at the lower extreme in the Stage 4 zone. The key to now watch for is which sectors start reversing back up again and through the key 30% level, as they will be places to look for potential leading stocks in the coming months. However, when that happens is a complete unknown, as the sectors can remain in the lower zone for a long time in some cases, with Energy for example – which was a laggard in 2020 – not moving back above it until mid August, while Technology moved above it in April 2020. And we know where the bulk of the leading stocks were in the 2020 Stage 2 advance. So sectors with strong reversals out of the lower zone will be key areas to focus on for new leadership in the next bull. Whenever that be.
For now we remain in the Stage 4 zone, but alert for reversals from this extreme level, as they can be sudden the market elastic band is this far stretched.
*Data from the whole US market
Become a Stage Analysis Member:
To see more like this – US Stocks watchlist posts, detailed videos each weekend, use our unique Stage Analysis tools, such as the US Stocks & ETFs Screener, Charts, Market Breadth, Group Relative Strength and more...
Join Today
Disclaimer: For educational purpose only. Not investment advice. Seek professional advice from a financial advisor before making any investing decisions.