
Sector Breadth: Percentage of US Stocks Above Their 150 day (30 Week) Moving Averages
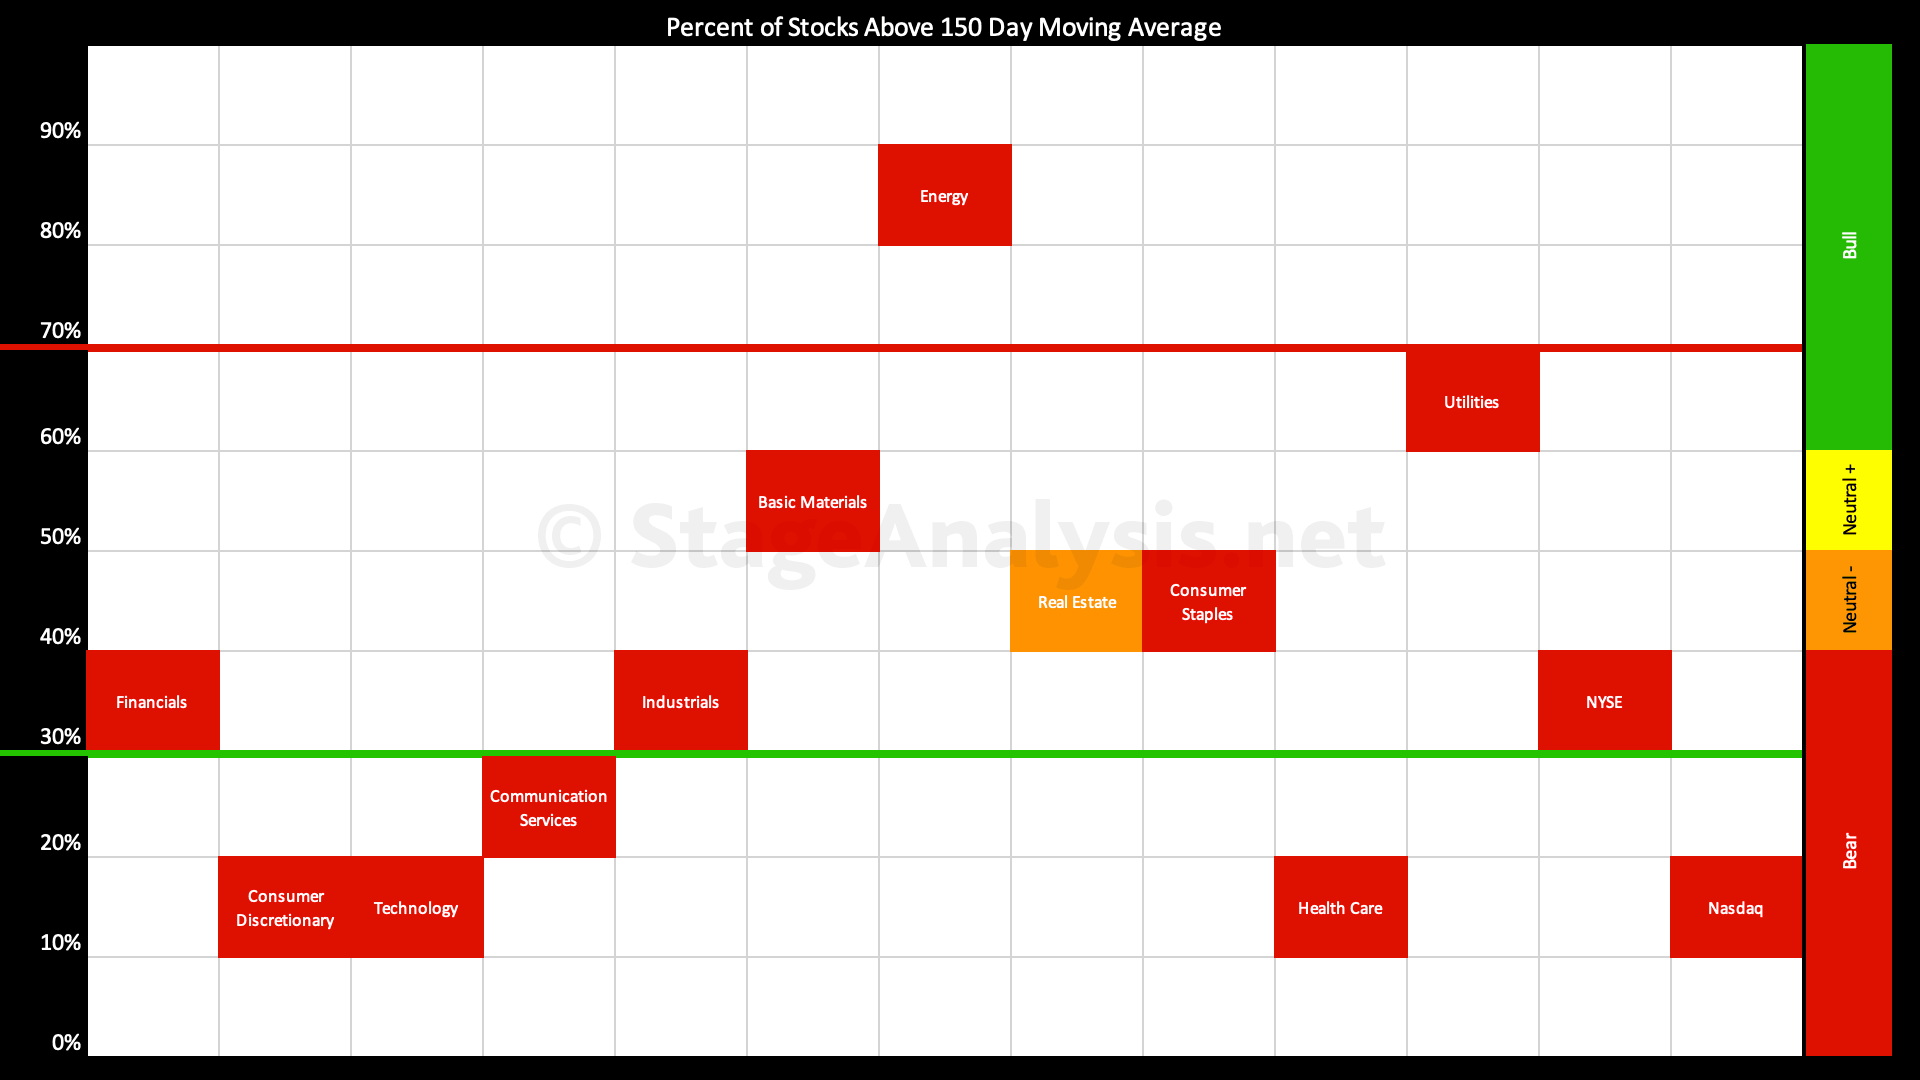
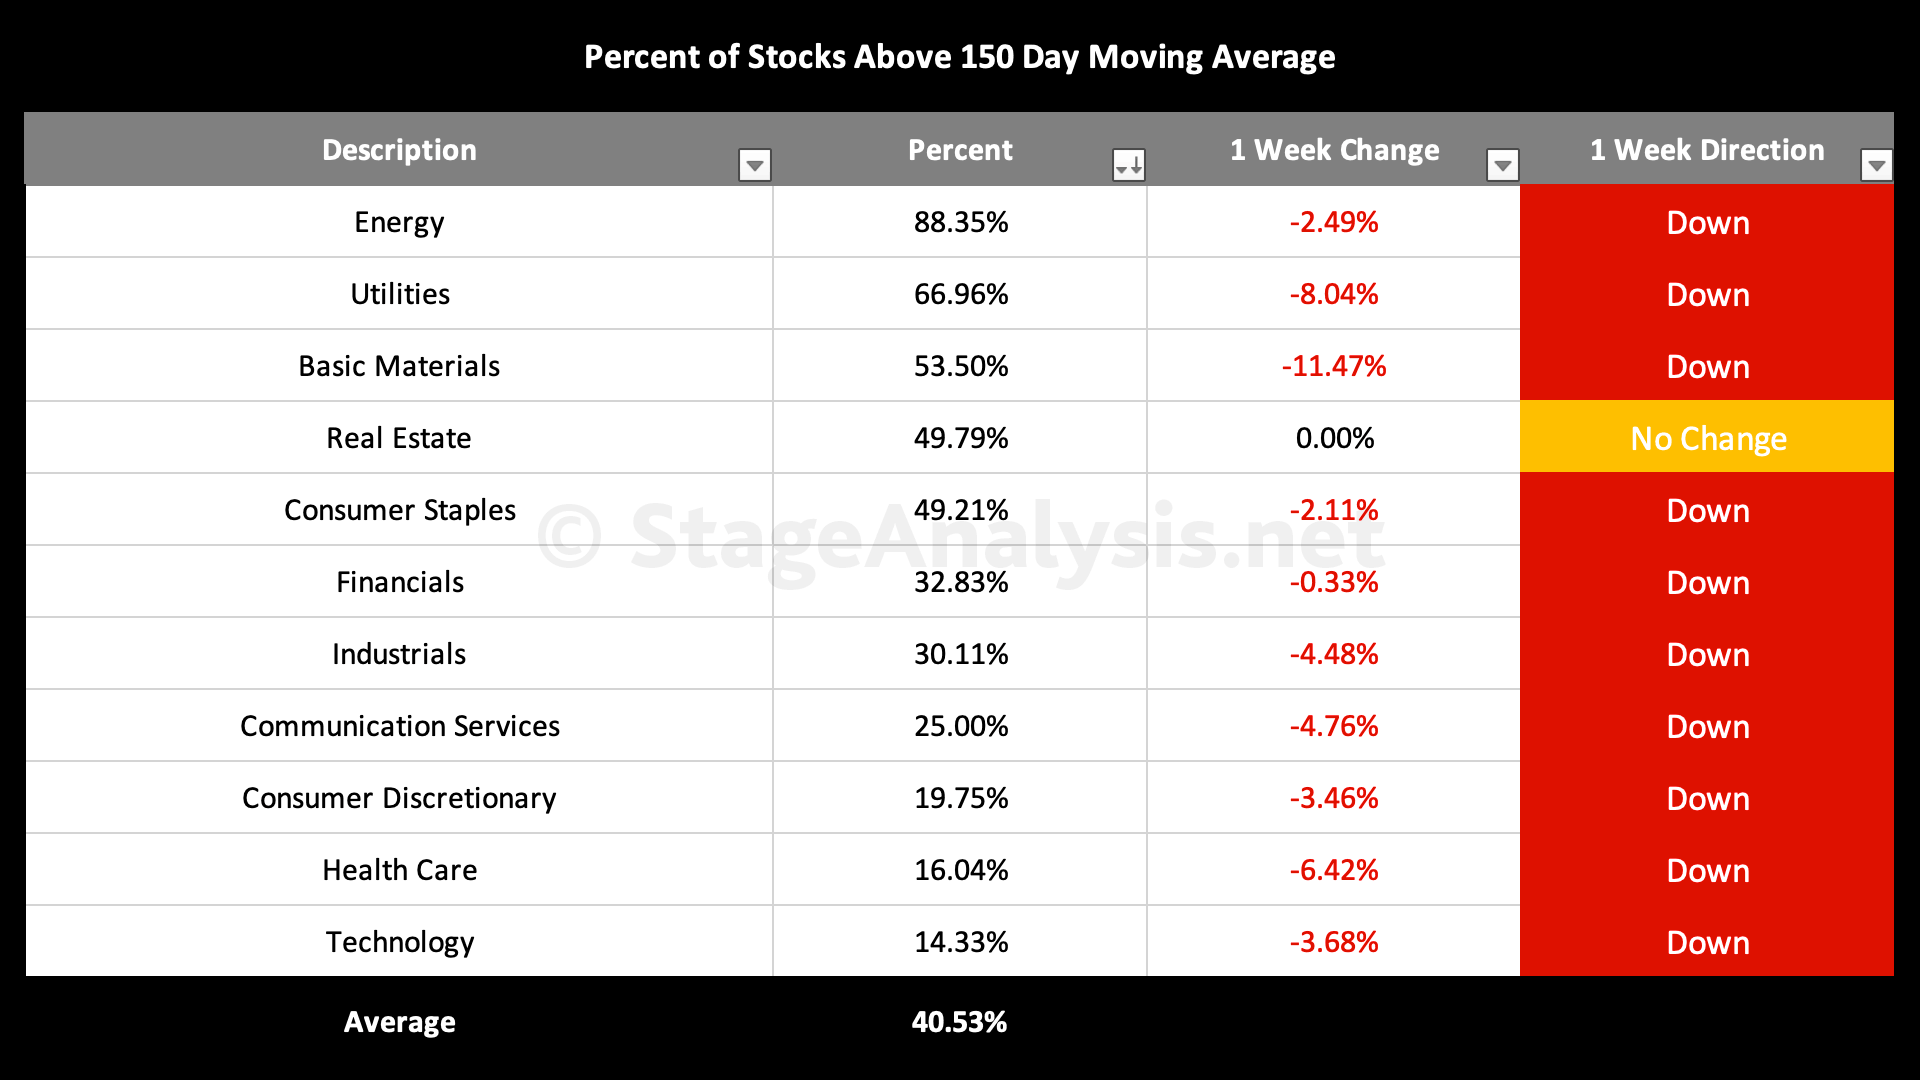
Average: 40.53 (-4.29% 1wk)*
- 2 sectors are in the Stage 2 zone (Energy, Utilities)
- 3 sectors are in Stage 1 / 3 zone (Basic Materials, Real Estate, Consumer Staples)
- 6 sectors are in Stage 4 zone (Financials, Industrials, Communication Services, Consumer Discretionary, Health Care, Technology)
There were negative grid changes in 5 of the 11 sectors since the last update two weeks ago, with the overall average down to 40.53%.
The biggest declines this week were in the Basic Materials and Utilities sectors – dropping the Basic Materials below the 60% level out of the Stage 2 zone and into the more neutral Stage 3 / Stage 1 zone.
I posted an updated US Industry Groups Bell Curve – Exclusive to Stage Analysis chart and data for Stage Analysis Members on Thursday, which had a similar median distribution at 40.20%. However, Fridays strong negative move in the moving average breadth charts will have likely lowered that, as numerous stronger RS groups took the largest hits on Thursday and Friday with all the top 10 RS groups showing a Change of Behaviour over their recent short term uptrends. So I'd expect that to be down in mid 30s now at least, and might update it during next week (time permitting).
*Data from the whole US market
Become a Stage Analysis Member:
To see more like this – US Stocks watchlist posts, detailed videos each weekend, use our unique Stage Analysis tools, such as the US Stocks & ETFs Screener, Charts, Market Breadth, Group Relative Strength and more...
Join Today
Disclaimer: For educational purpose only. Not investment advice. Seek professional advice from a financial advisor before making any investing decisions.