
Stage 4 Decline Accelerates in the US Stock Market
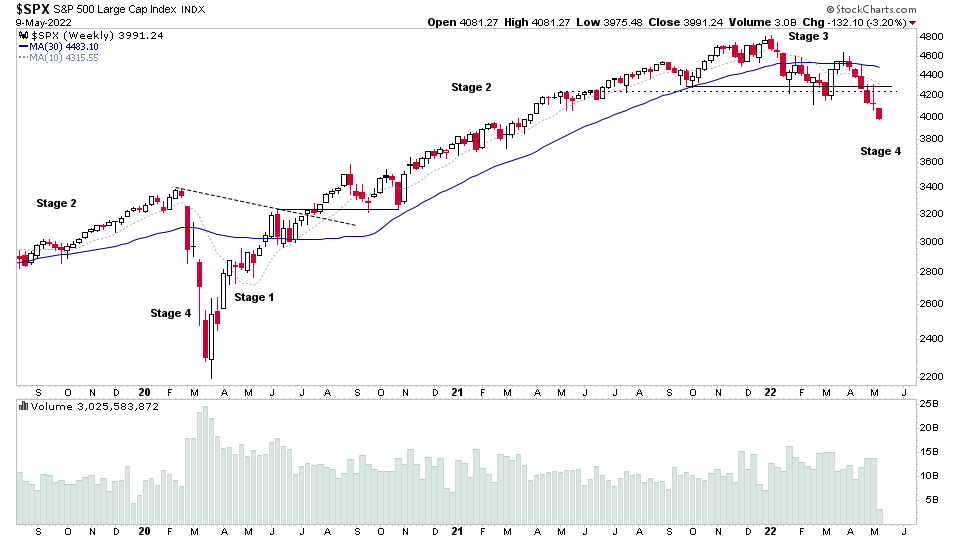
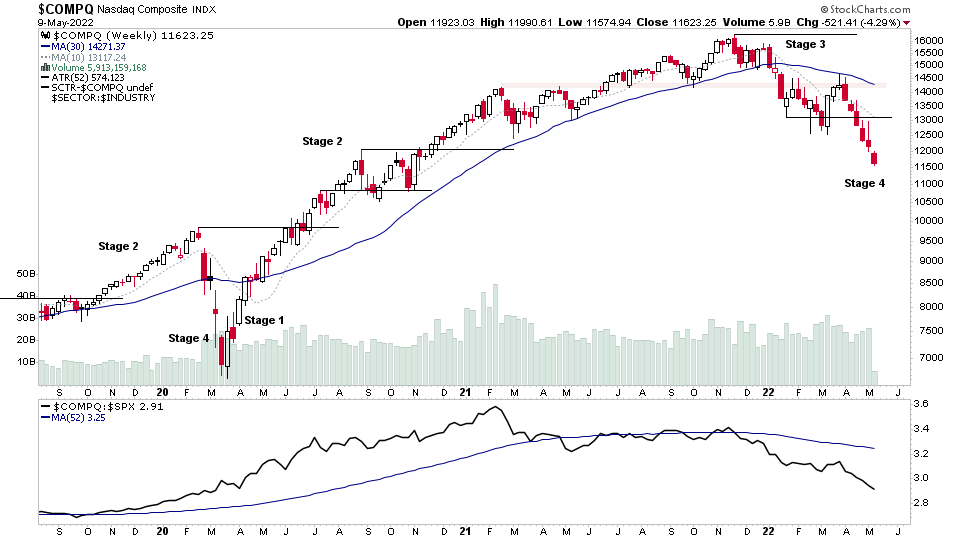
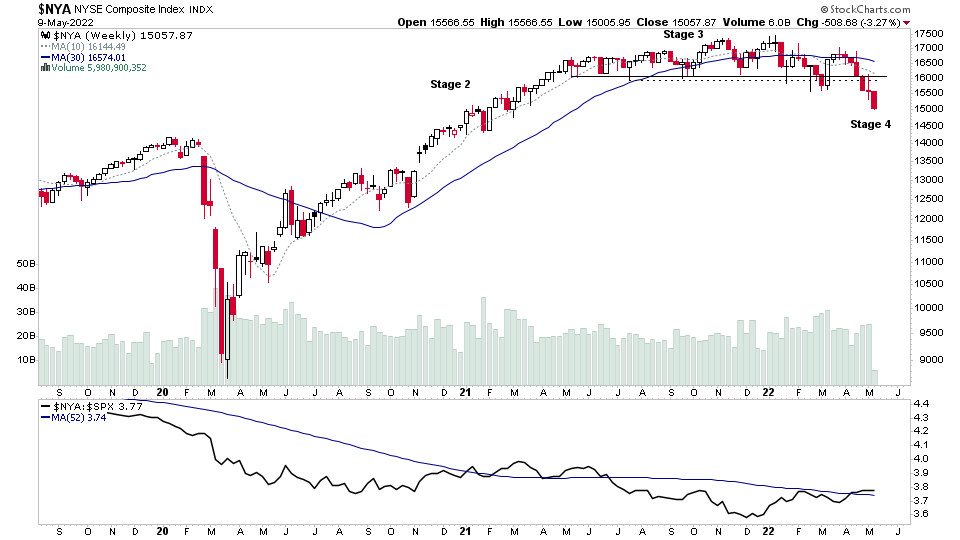
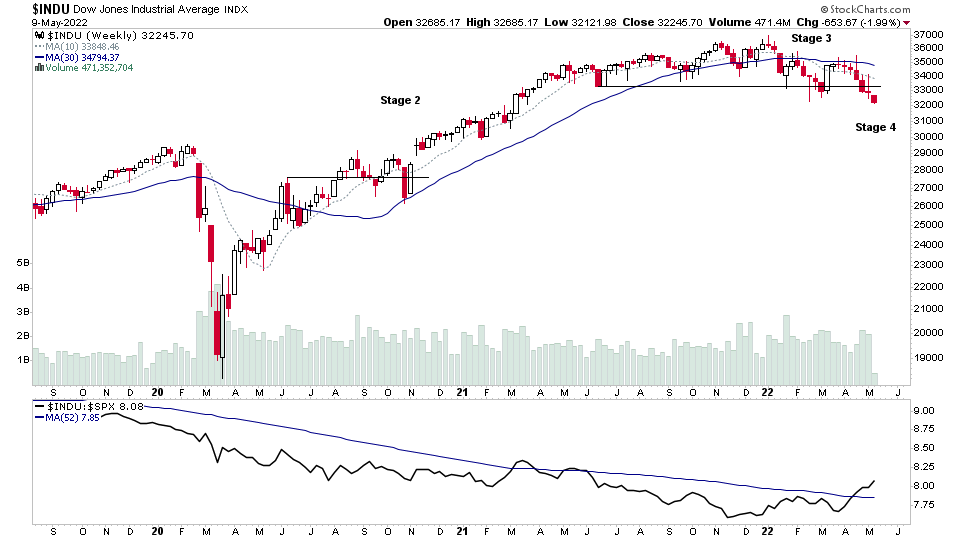
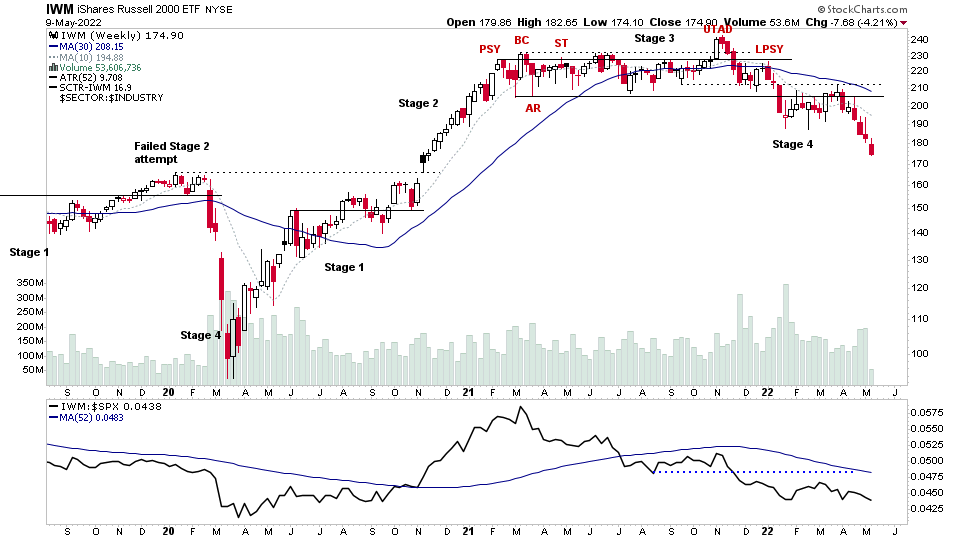
It was another day of heavy declines in the US stock market from the open, which further deteriorated into the later part of the trading day, as the major large indexes, such as the S&P 500 finally broke down more convincingly below the lows that it had been clinging onto, and hence now is more clearly in Stage 4 on the chart.
Although, as we know from the market breadth data that I post each week and talk about ad nauseam in the weekend members videos. The US market has been in Stage 4 since late November / early December via the internals and it's only been the strength in the Commodities stocks since the start of the year that have kept the indexes afloat. But could that now be changing? With multiple leading groups starting to falter with significant reversal bars and liquidation near their highs in many over the last month.
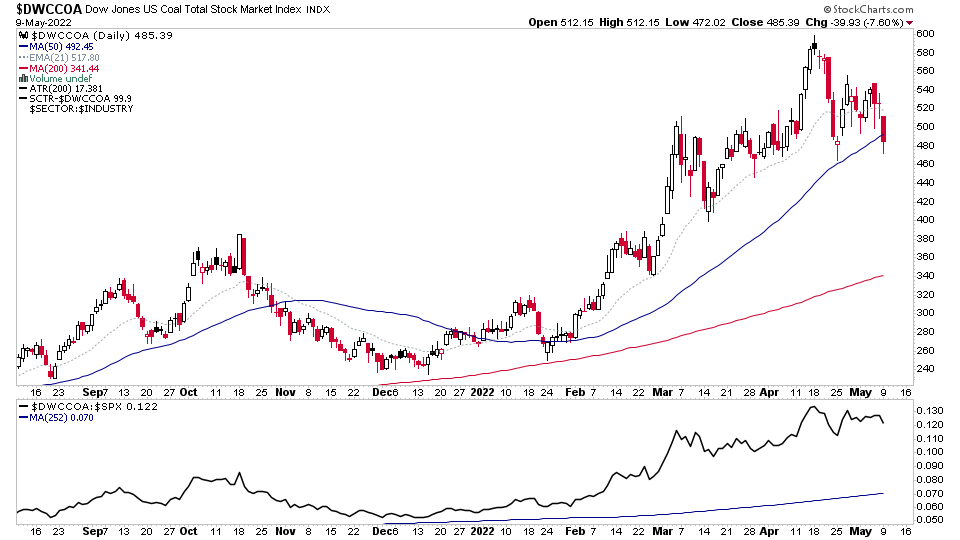
Have the Leading Oil Groups Topped?
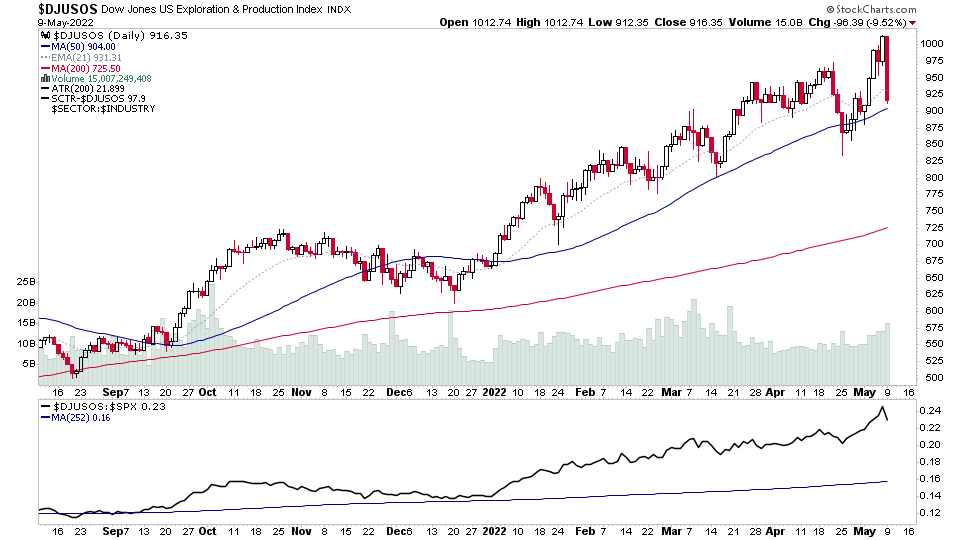
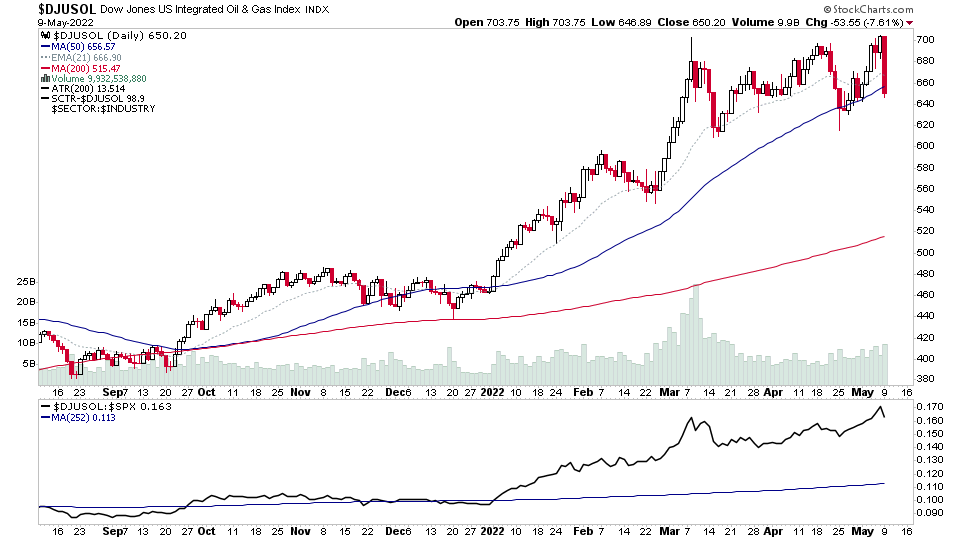
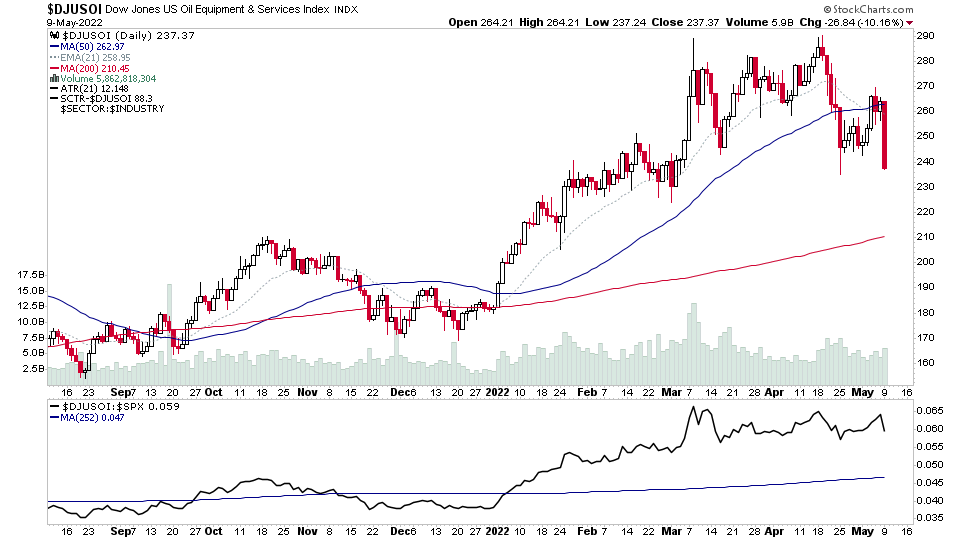
Last week the four leading groups in the RS table were, Coal, Exploration & Production, Integrated Oil & Gas, and Oil Equipment and Services. But today saw heavy selling in the three leading oil groups with Reversal Significant Bars in each that not only reversed from last weeks new highs, but engulfed 4 or 5 days of previous price action on heavy relative volume. Which caused the Oil Equipment and Services group to drop 9 places in the RS table.
So they've potentially put in a short term swing high, and if the leading groups such as these continue to struggle, then risk of a Stage 4 capitulation move increases dramatically. Hence extreme caution until we start to see new short term positive signs in the breadth and charts.
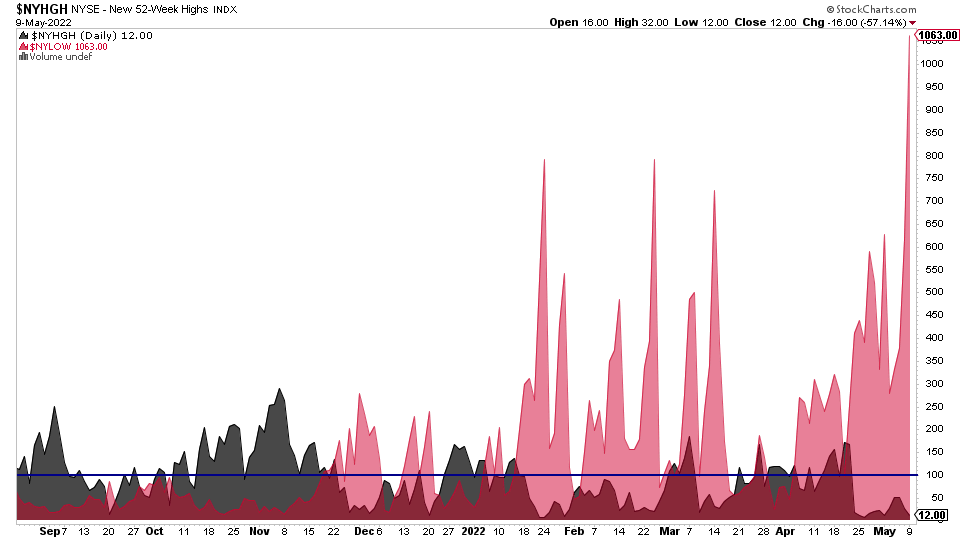
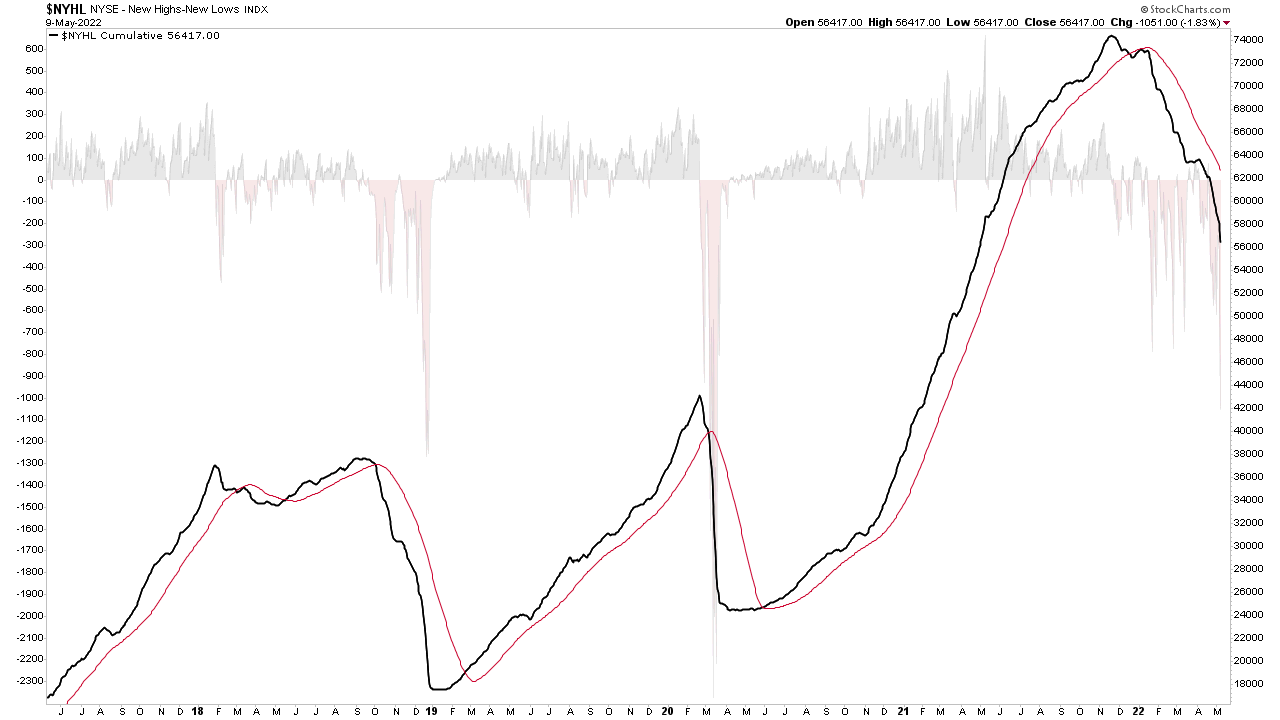
Market Breadth: NYSE New Highs - News Lows
The cumulative chart getting vertical here with its largest daily decline since March 2020 at -1063 new lows today in the NYSE
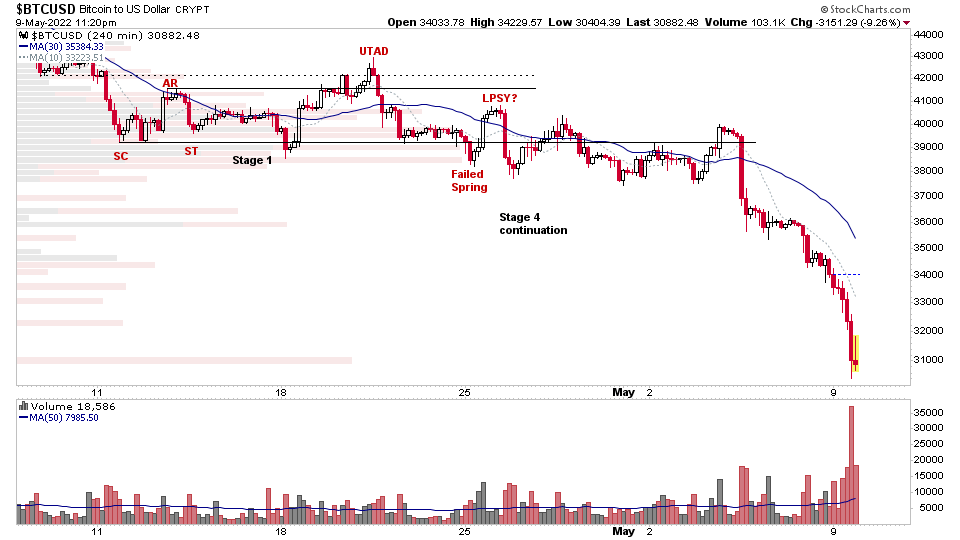
Bitcoin Stage 4 Breakdown Attempt
Bitcoin made a Stage 4 breakdown attempt, but it is still not clear of prior support range from earlier in 2021 around the 30k level that it tested numerous times, and so could provide support once more, even though it's older support, as cryptos tend to trade very technically.
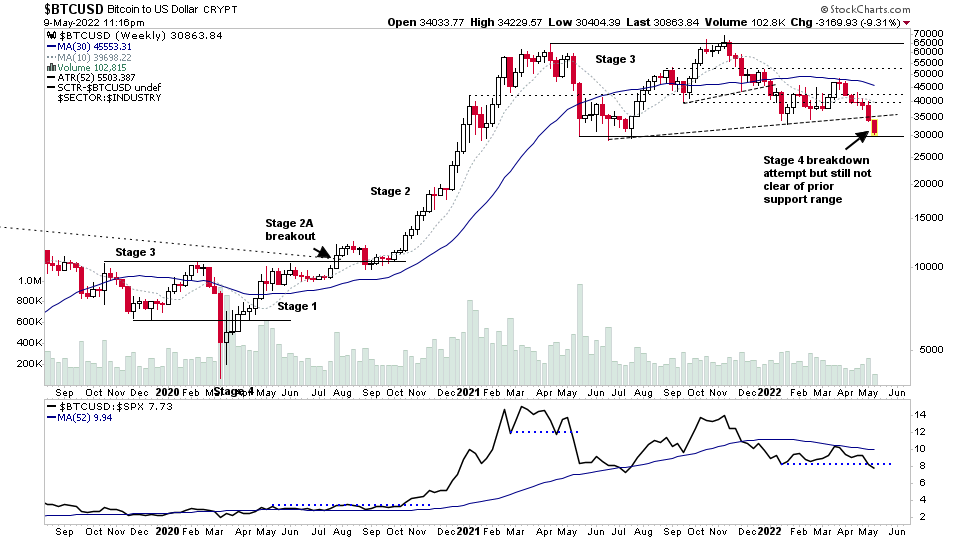
I highlighted on the 27th April on the twitter feed that the intraday Spring attempt failed on heavy volume, and then made a lower low. So it had made a potential Stage 4 continuation breakdown on the 4 hour timeframe, with the weekly chart still in late Stage 3.
So as you can see below. This has now completed cracked apart and is making a major Stage 4 decline on the intraday chart with the first signs of climatic behaviour in the volume appearing today.
Earnings Results
Finally today I just wanted to highlight one of tonight's earnings results that I was watching, as it had potential for a big move either way based on its position – which was UPST.
Earnings were poorly received once more, and fell apart in the after hours trade, and now down over -40% since Fridays close and has given back the vast majority of its initial Stage 2 advance from when it IPO'd, and was one of last years leading stocks.
So another good example of why you should exit leading stocks once you start to see the reversal significant bars in Stage 3 on heavy volume. Or at the very least if you are long term investor when it breaks down into Stage 4. Although, by that point you could have given back a lot of your previous gains, especially in the leading stocks that have had massive Stage 2 advances. So I recommend learning the Wyckoff method so that you can spot the Events and Phases within the developing Stage 3 range, and exit with confidence at better positions.

Become a Stage Analysis Member:
To see more like this – US Stocks watchlist posts, detailed videos each weekend, use our unique Stage Analysis tools, such as the US Stocks & ETFs Screener, Charts, Market Breadth, Group Relative Strength and more...
Join Today
Disclaimer: For educational purpose only. Not investment advice. Seek professional advice from a financial advisor before making any investing decisions.