
US Major Indexes and Market Breadth Update - 10th May 2020
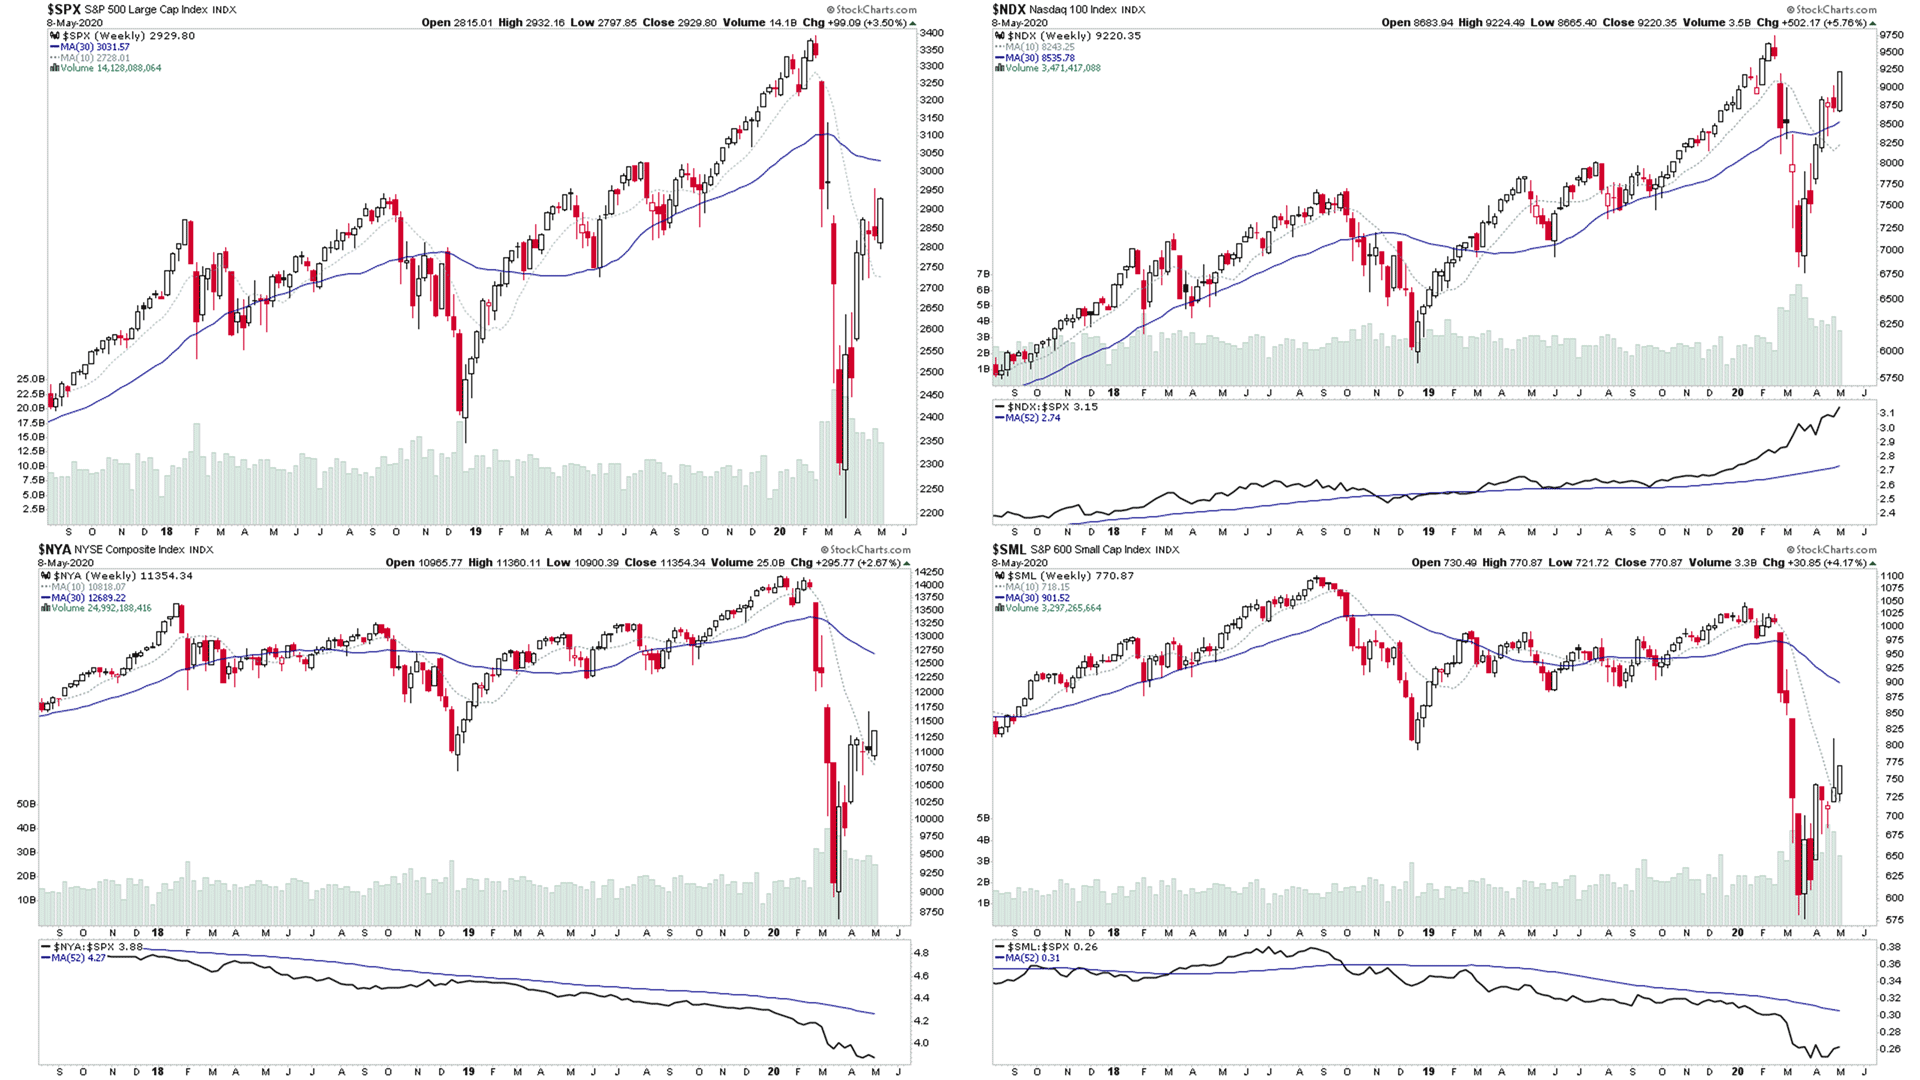
The indexes had a strong week, after a few weeks of indecision, with the Nasdaq indexes making new weekly highs, but the majority of other indexes didn't manage to clear the previous weeks highs although they did close strongly on Friday.
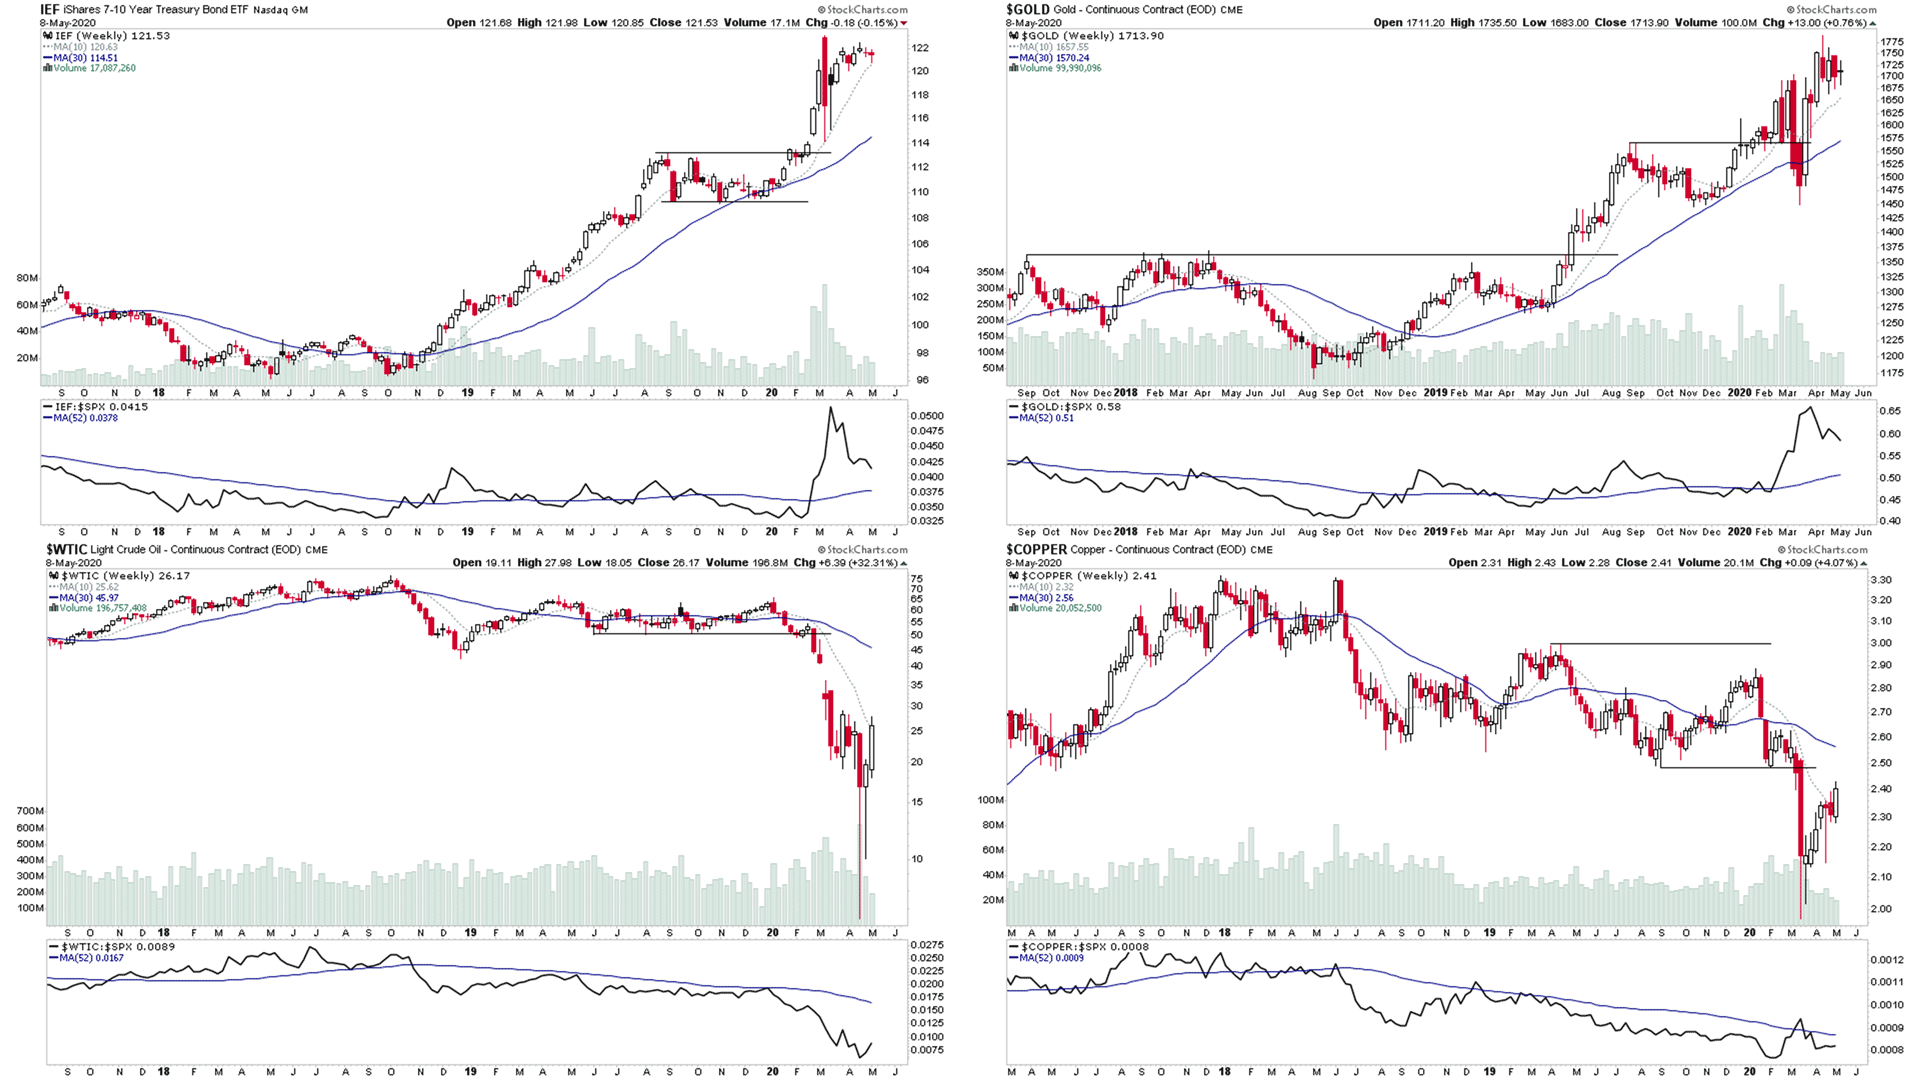
Gold and US Treasuries continue to consolidate near the highs, and could make a continuation breakout attempt soon.
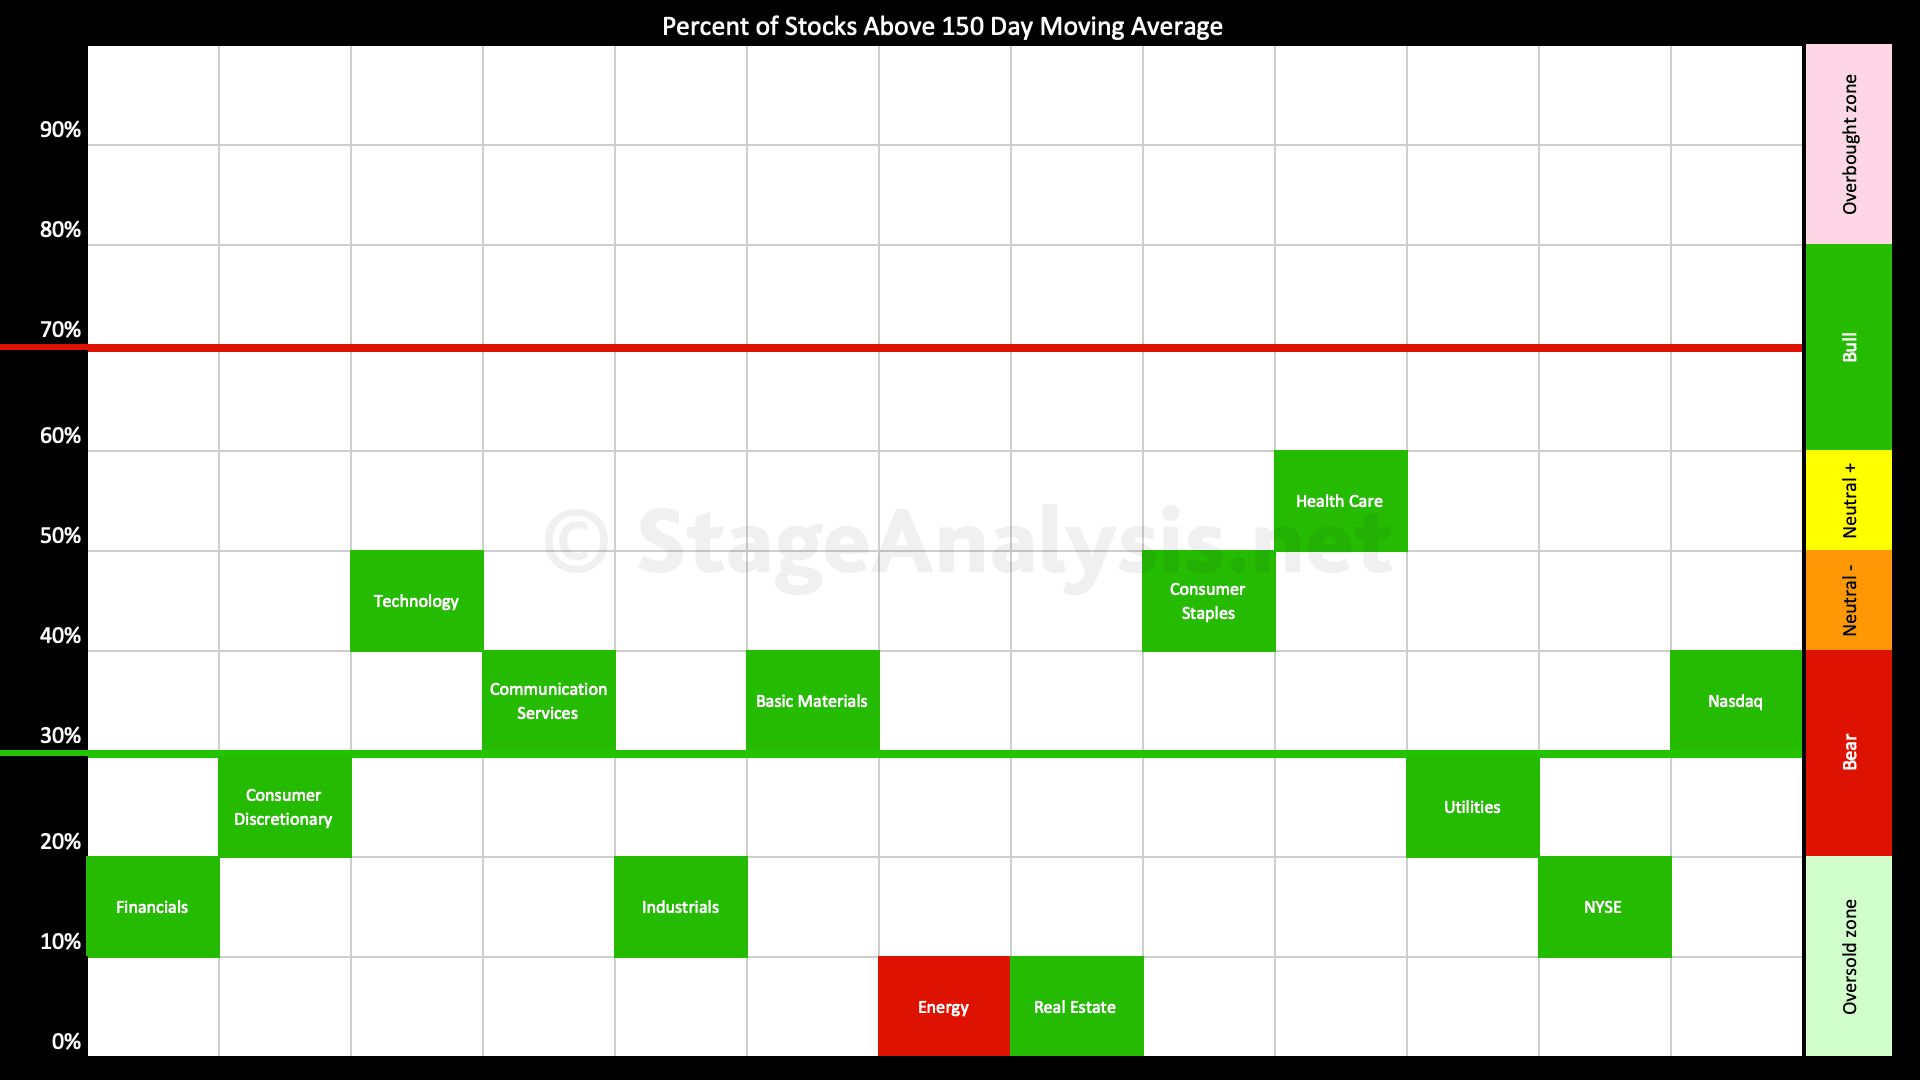
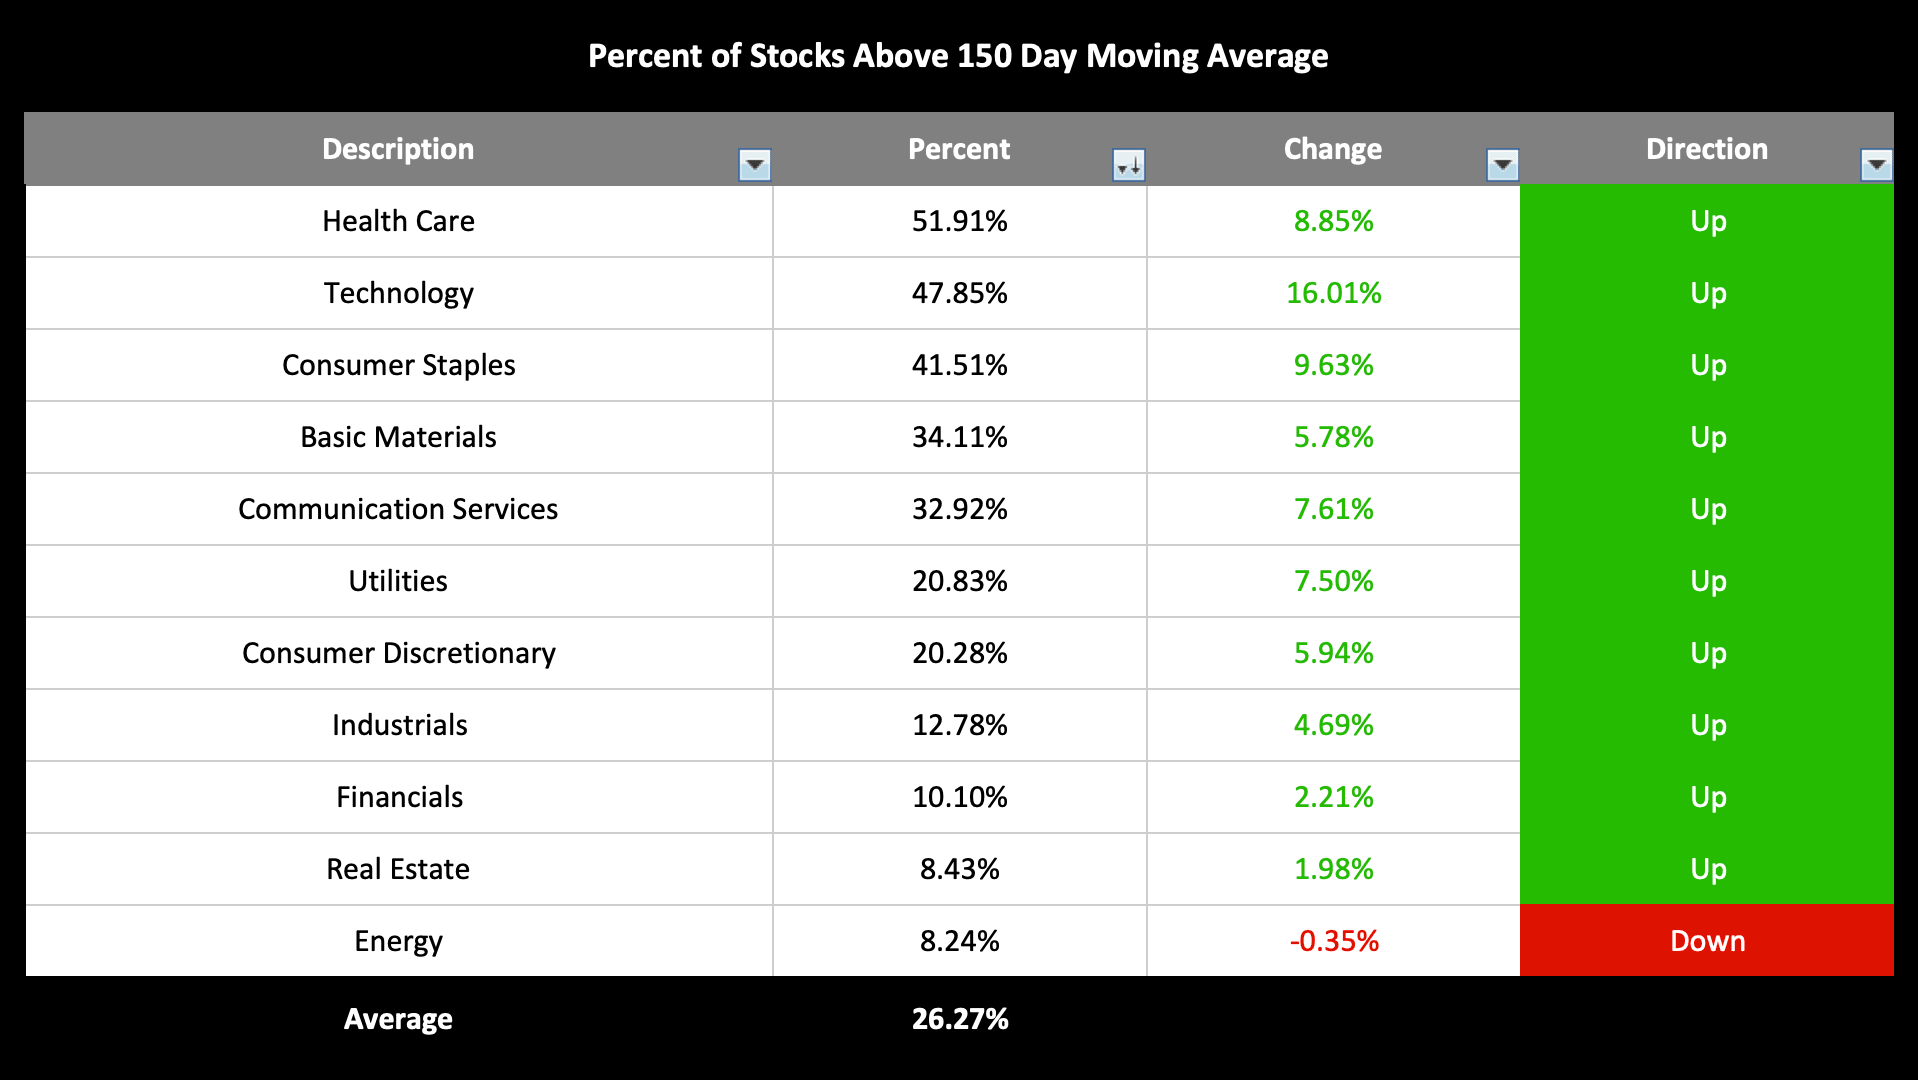
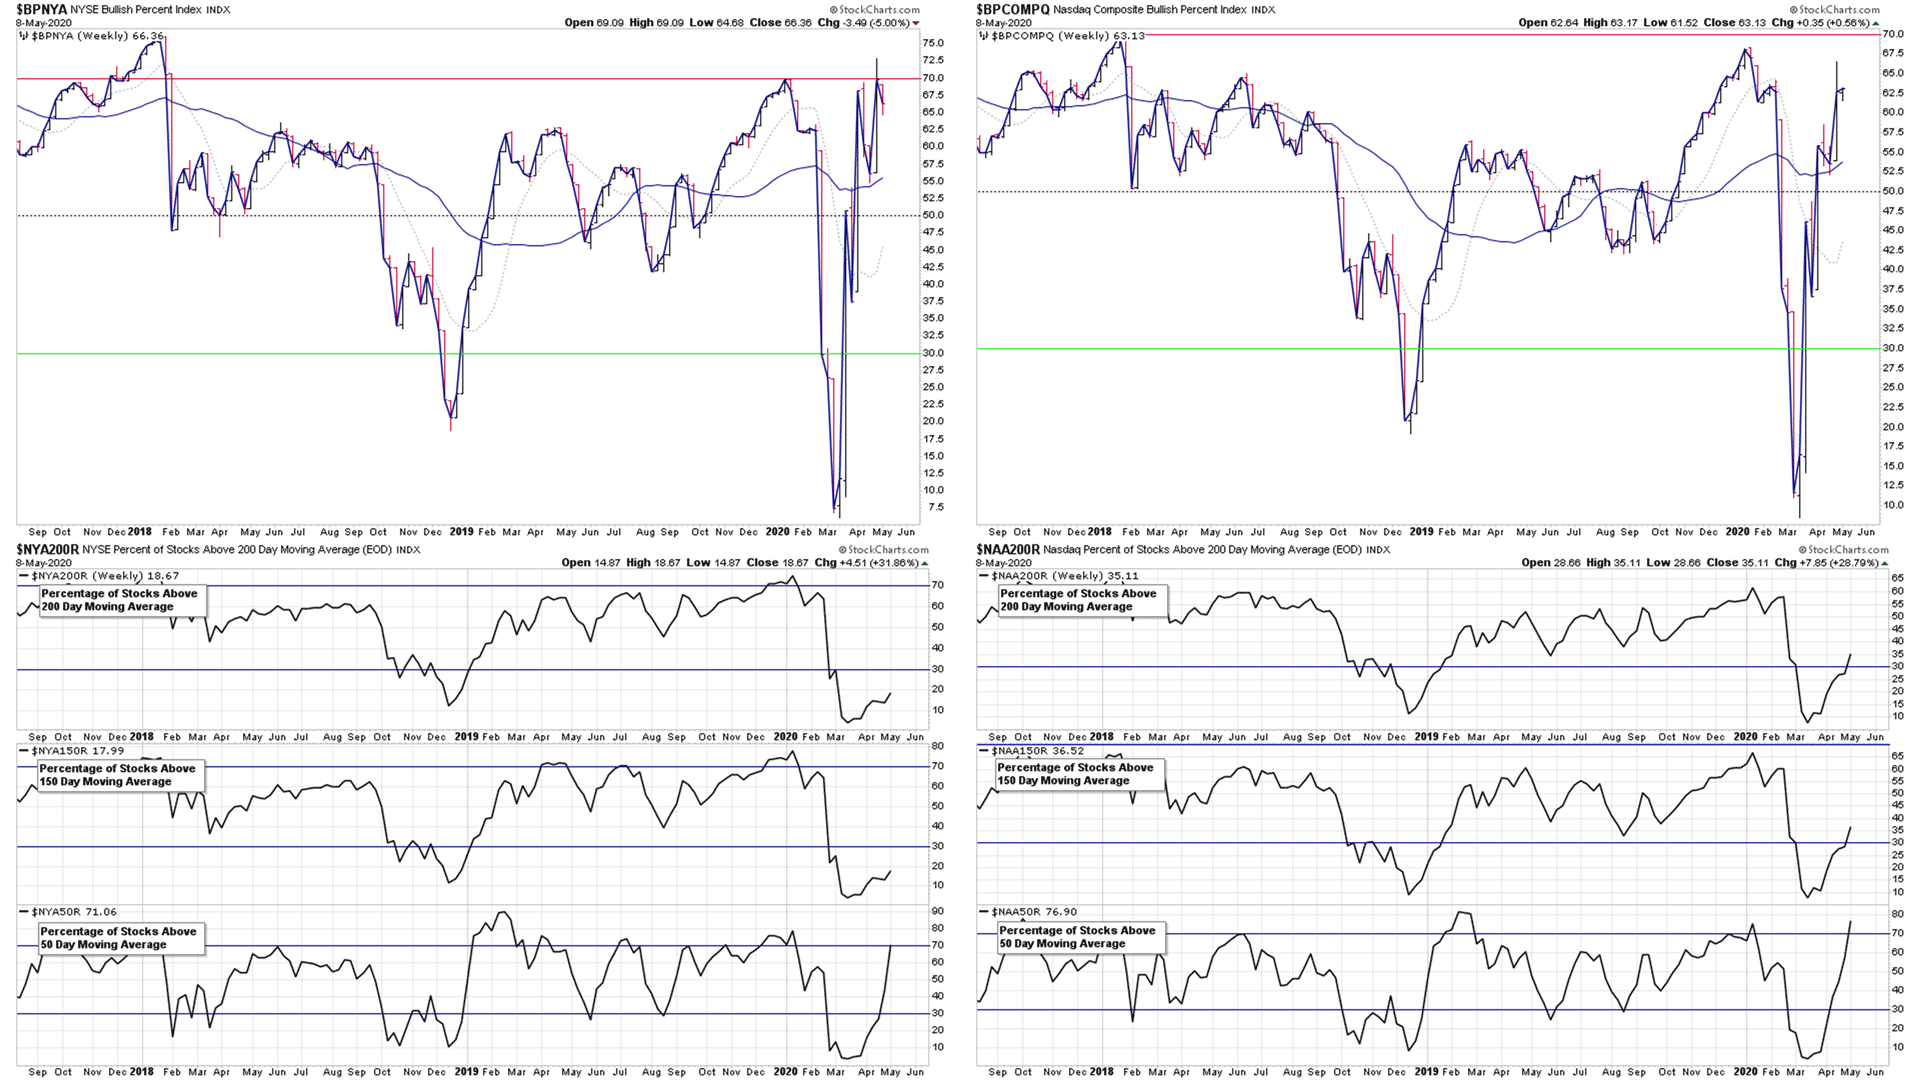
The short term NYSE and Nasdaq Percentage of Stocks above their 50 day Moving Averages P&F charts made continuation breakouts above their recent highs, and moved into the upper zone above the key 70% level, and the Nasdaq Percentage of Stocks above their 150 day and 200 day MA both moved above the lower zone 30% level, but have not yet given buy signals on the P&F chart, and so move to Bull Alert status. While the NYSE Percentage of Stocks above their 150 day and 200 day MA charts both remain on Bear Correction status.
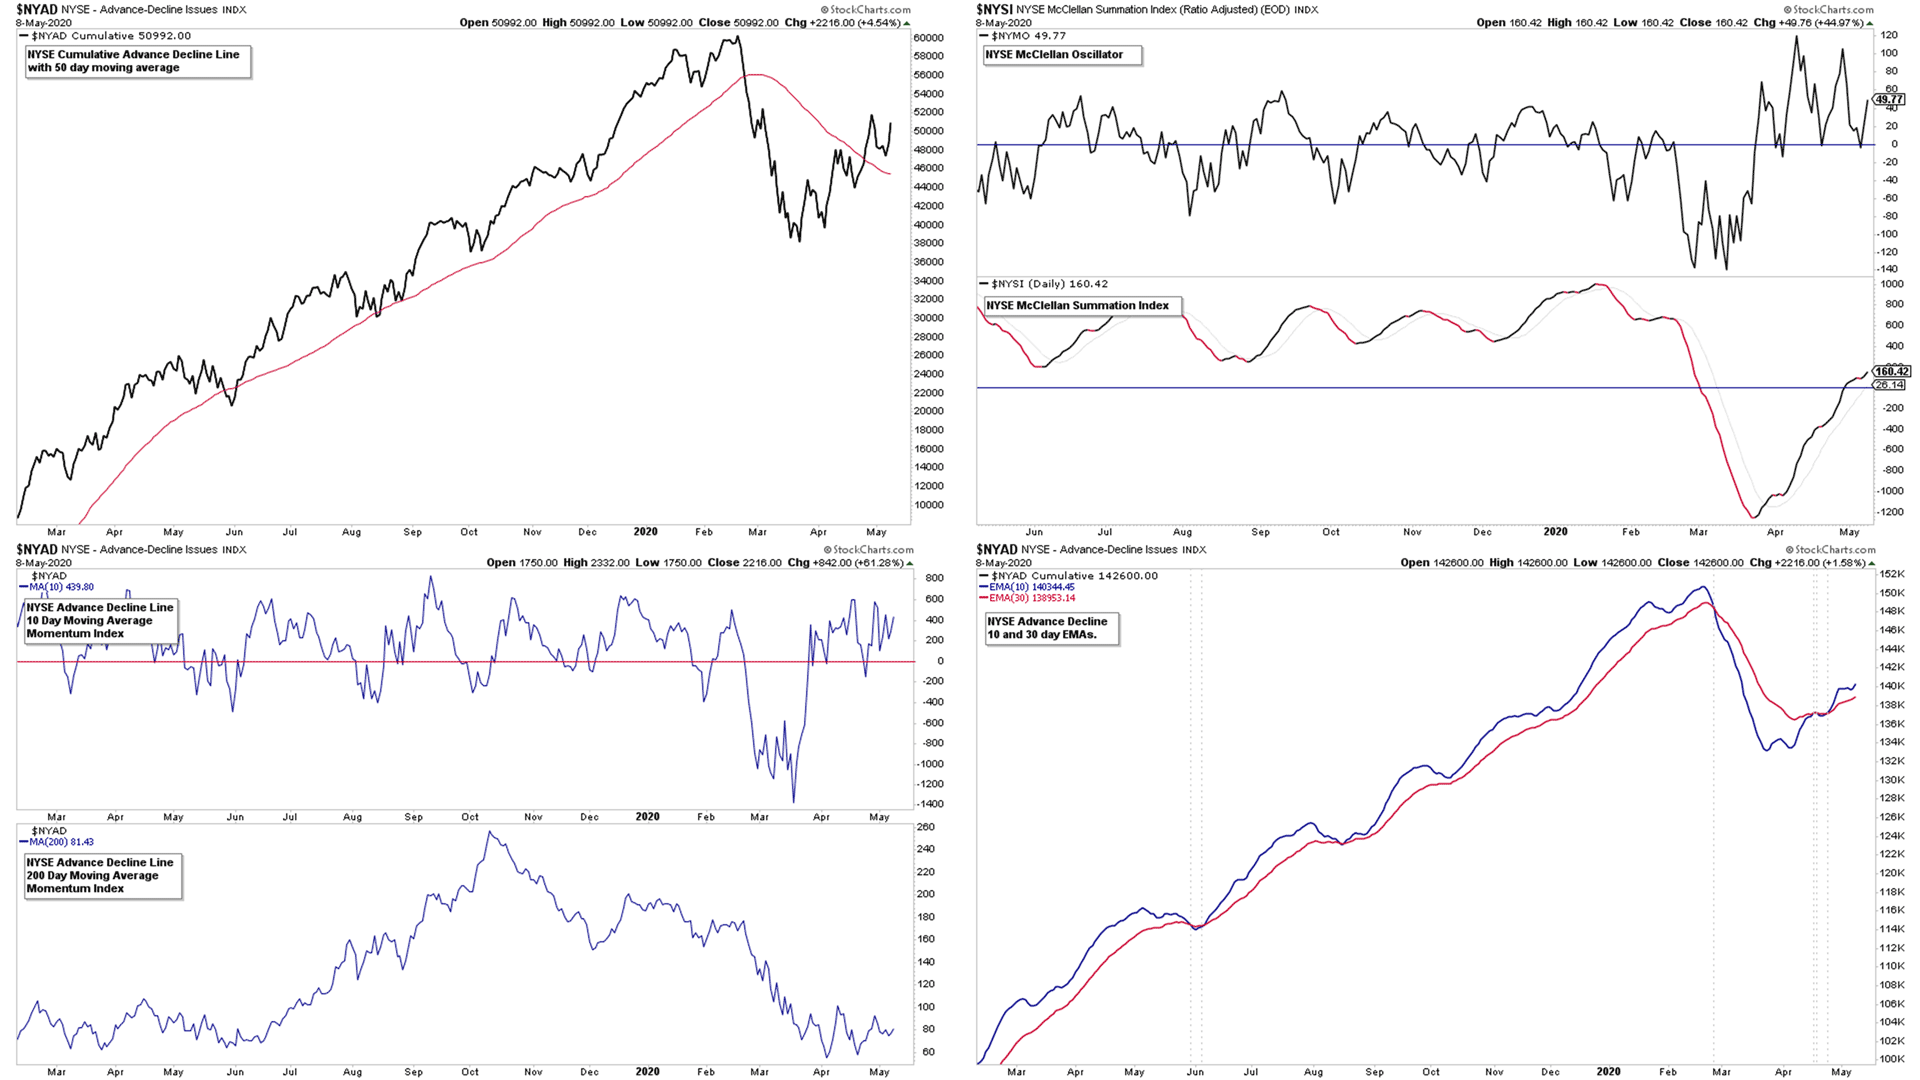
The advance decline line charts remain on short term bullish signals, but longer term bearish status currently
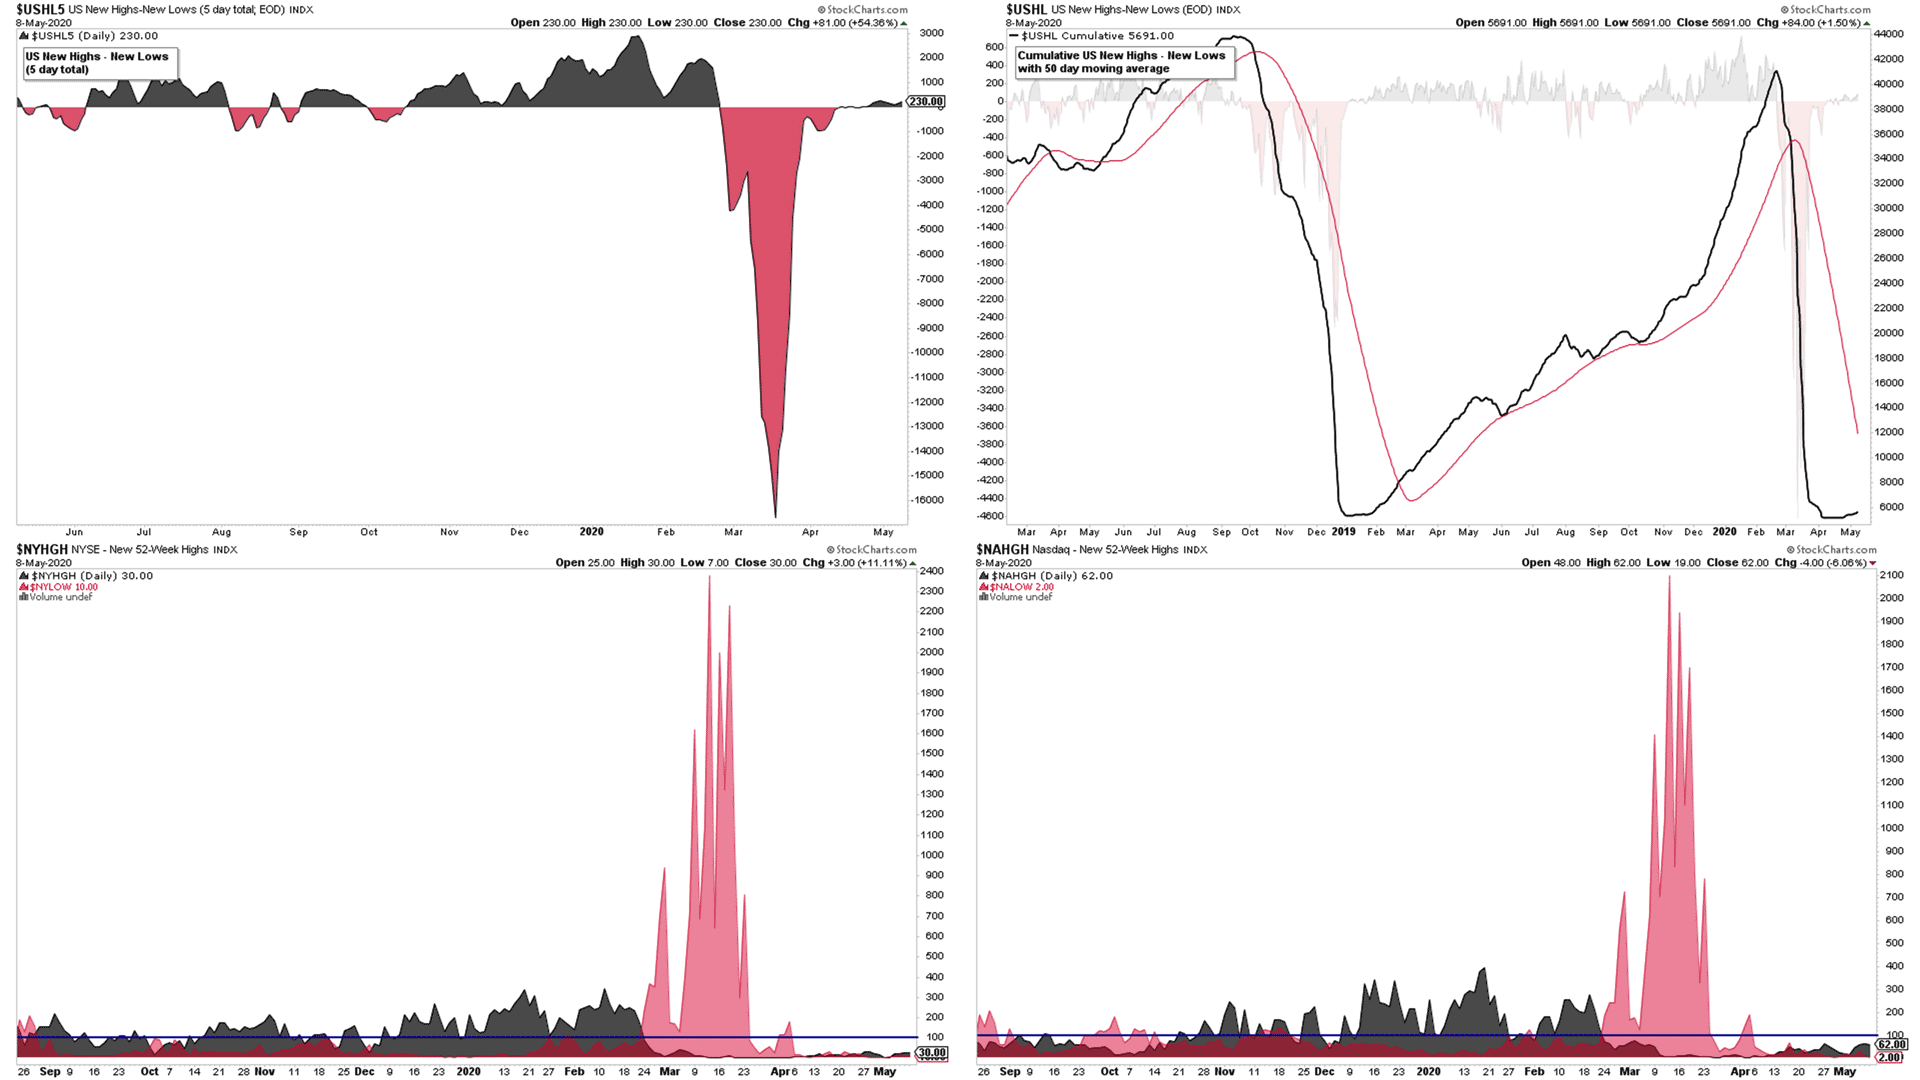
And the number of new highs continues to be muted, with neither index managing to break the signal line of 100 new highs a day.
So we remain in a short term bullish phase, within the Stage 4 currently. But medium and longer term signals still remain on bearish for now.
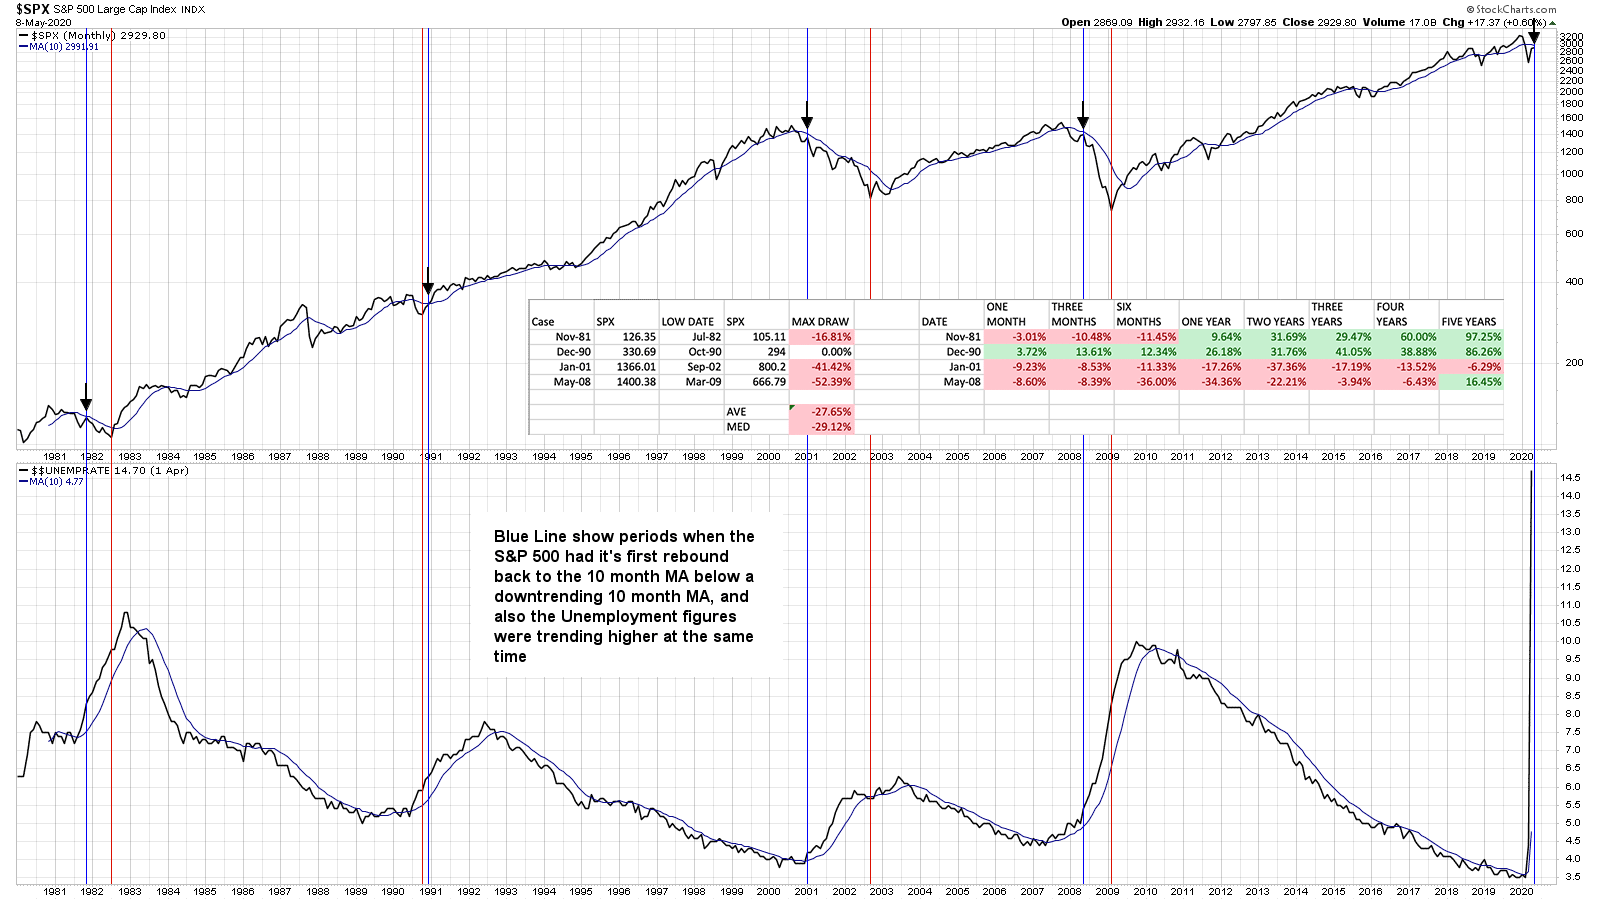
One other chart I wanted to show this weekend was the 40 year chart of the S&P 500 compared to the unemployment rates now that we have last months data. I've overlaid the percentages walking forward from the prior points when the S&P 500 was both rebounding back to a declining 10 month MA after the first significant decline below it, and crucially the unemployment rate was trending higher at the same time.
The results are mixed, but it does show that if the recent low wasn't the final low, then on average the additional max drawdown from this point in the historical examples until the low was an additional -27.65%, which from todays price of 2929.80, would take us down to around 2119.71 - which is -3.3% below the March low.
But this example would be invalidated imo if we got a monthly close above the 10 month MA, which this month is at 2991.91.
Disclaimer: For educational purpose only. Not investment advice. Seek professional advice from a financial advisor before making any investing decisions.