
The Stock Market Has Put in a Bottom. What Do the Market Breadth Charts Suggest Next for Stocks?
Quick Links:
- Timing the US Stock Market Using the Market Breadth Indicators – Introduction (0:00)
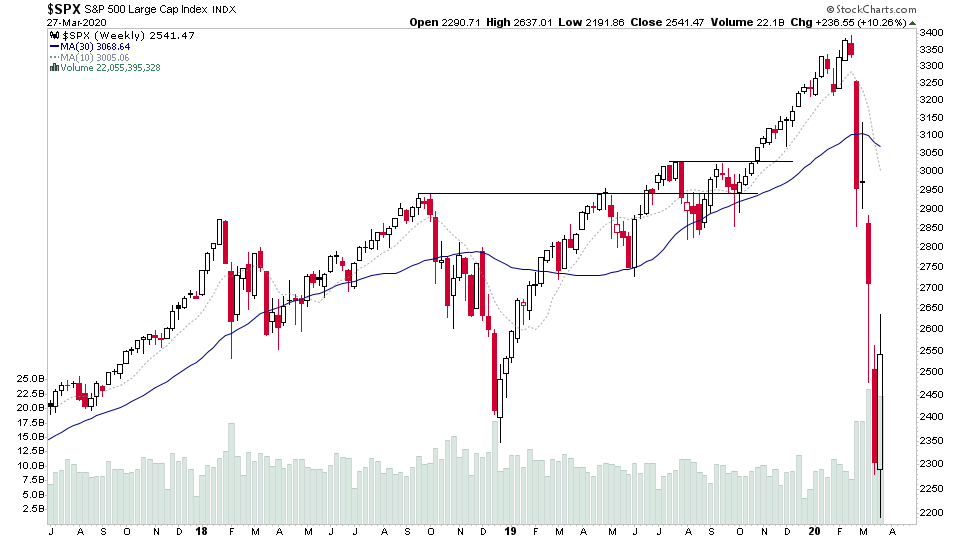
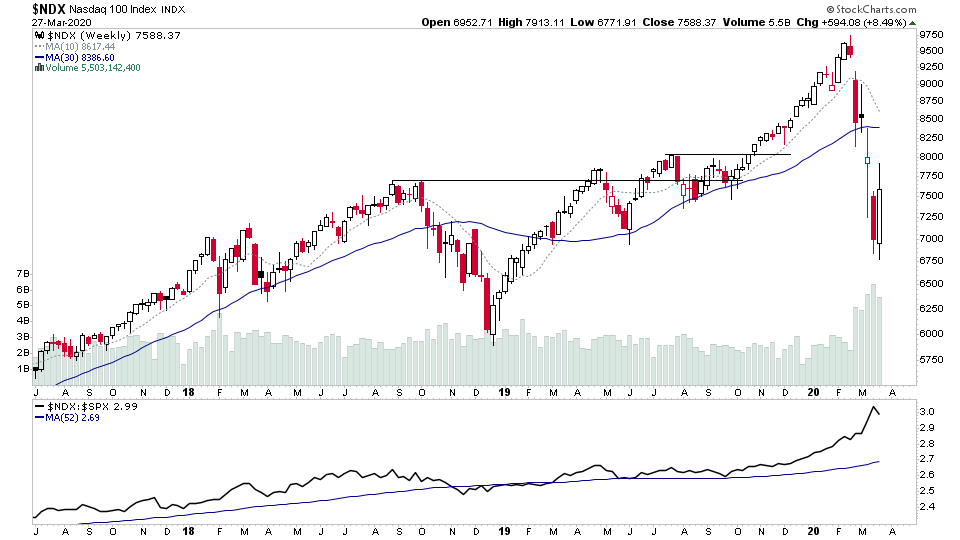
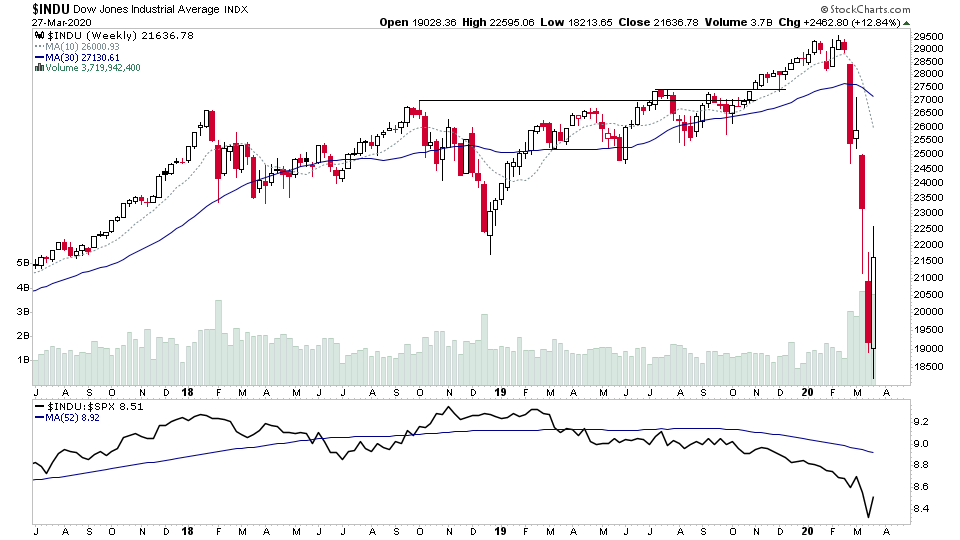
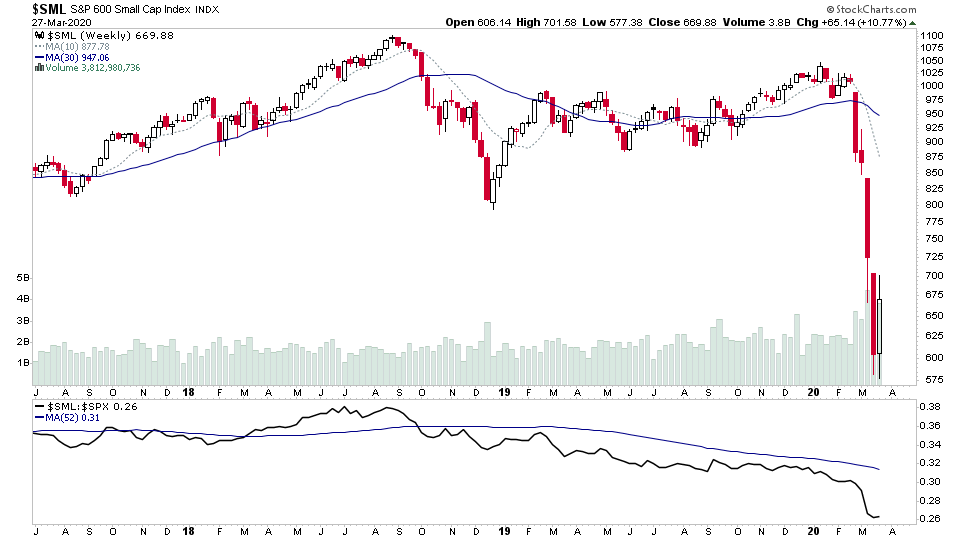
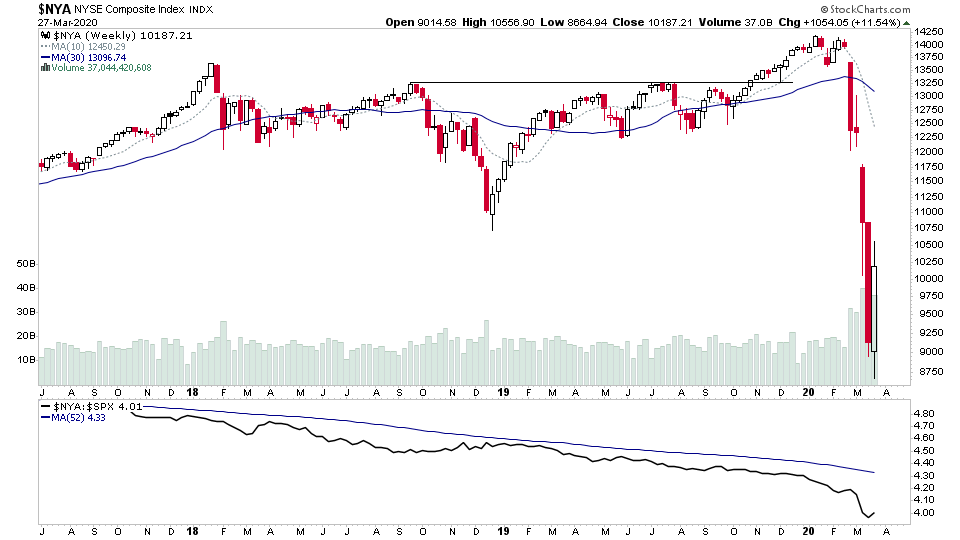
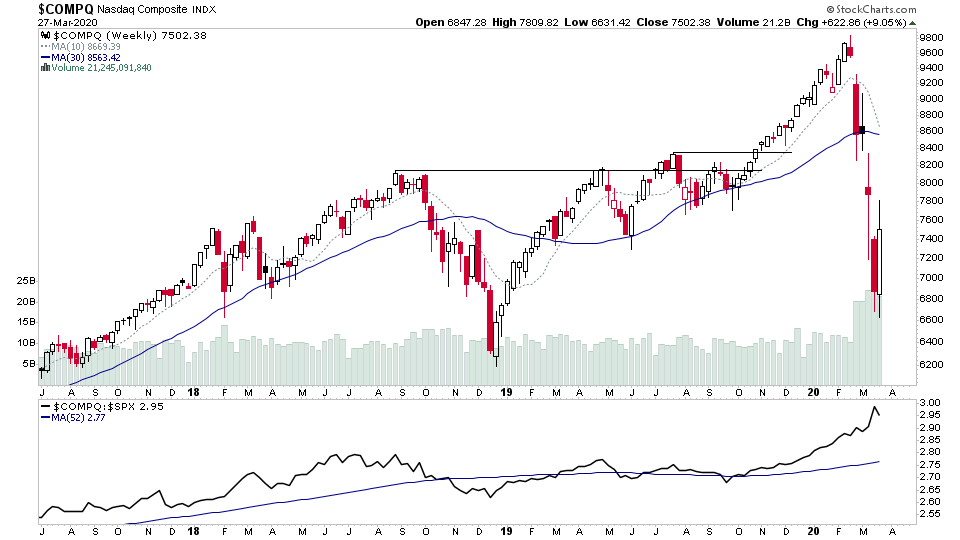
- Major Market Indexes – S&P 500, Dow Jones Industrial Average, Nasdaq 100 & S&P 600 Small Caps (0:21)
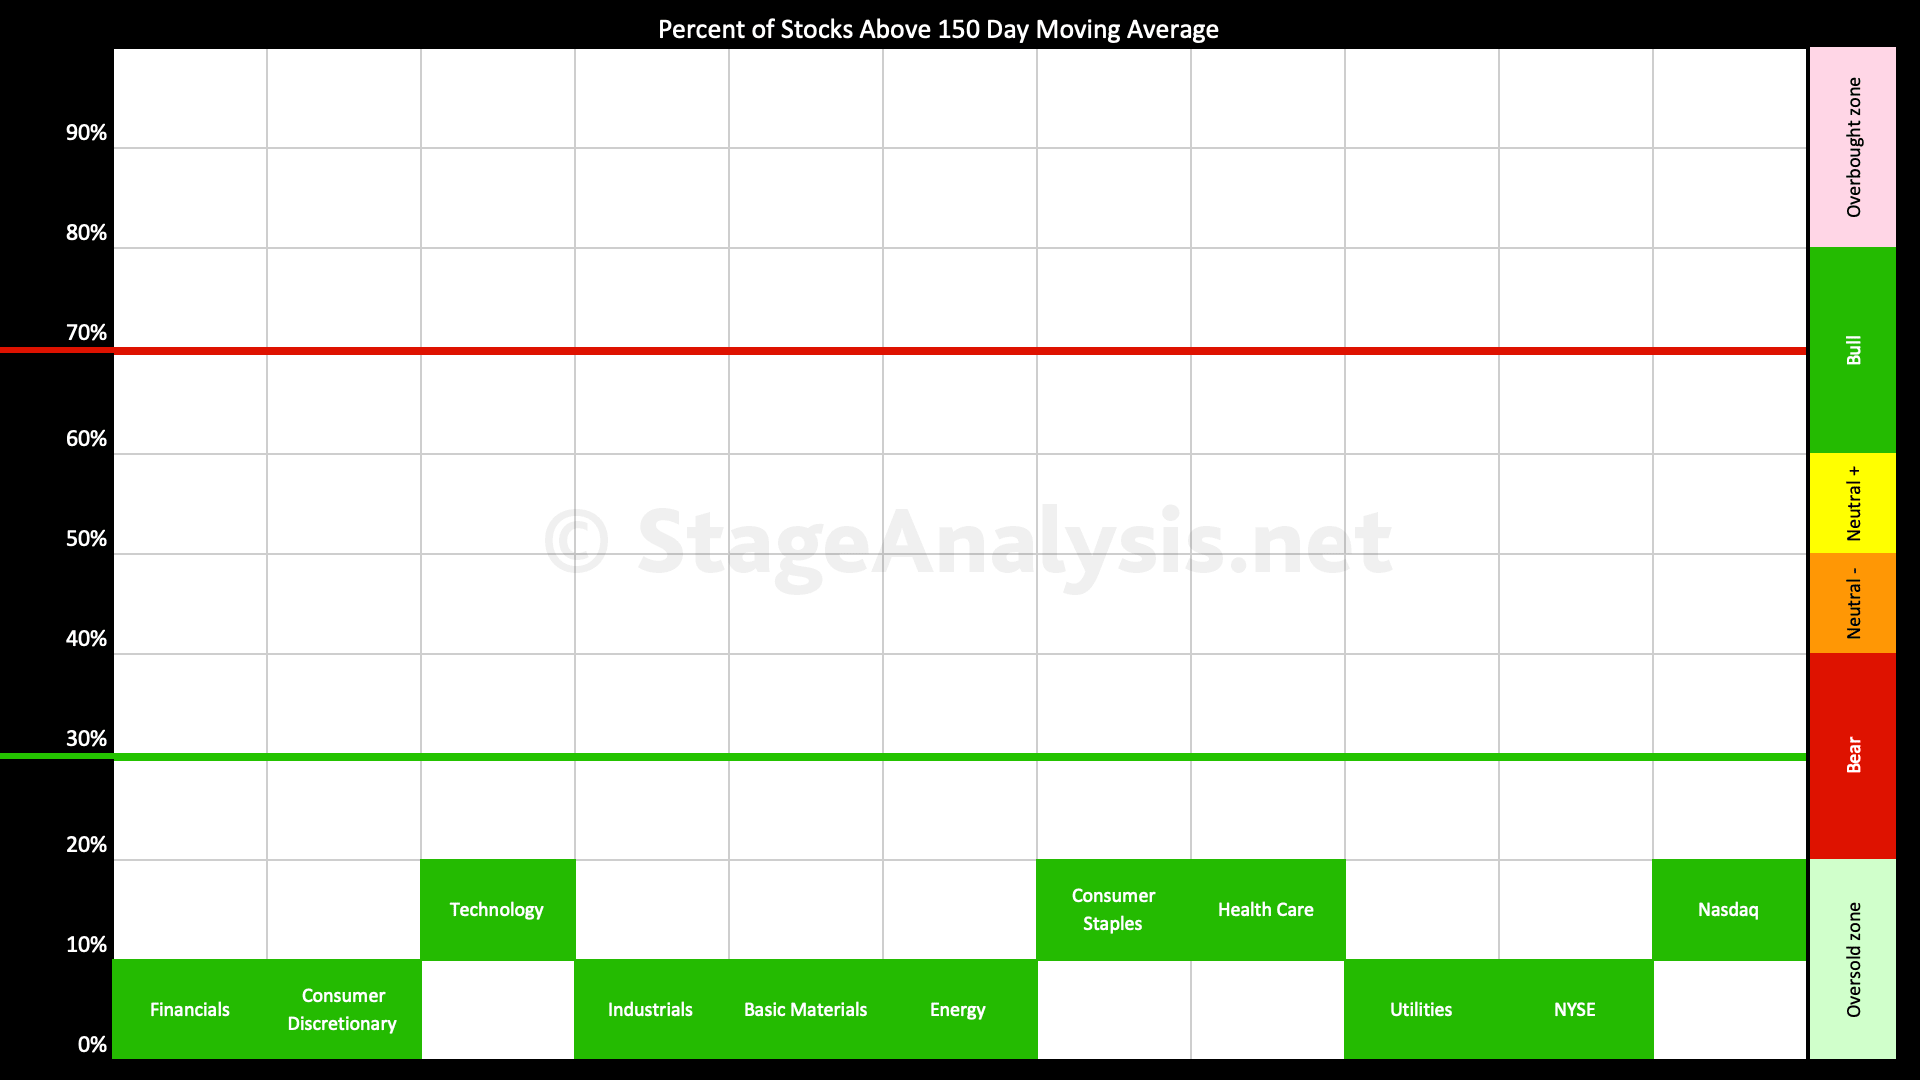
- Sector Breadth: Percentage of Stocks Above Their 150 Day Moving Average – Overview Diagram (3:52)
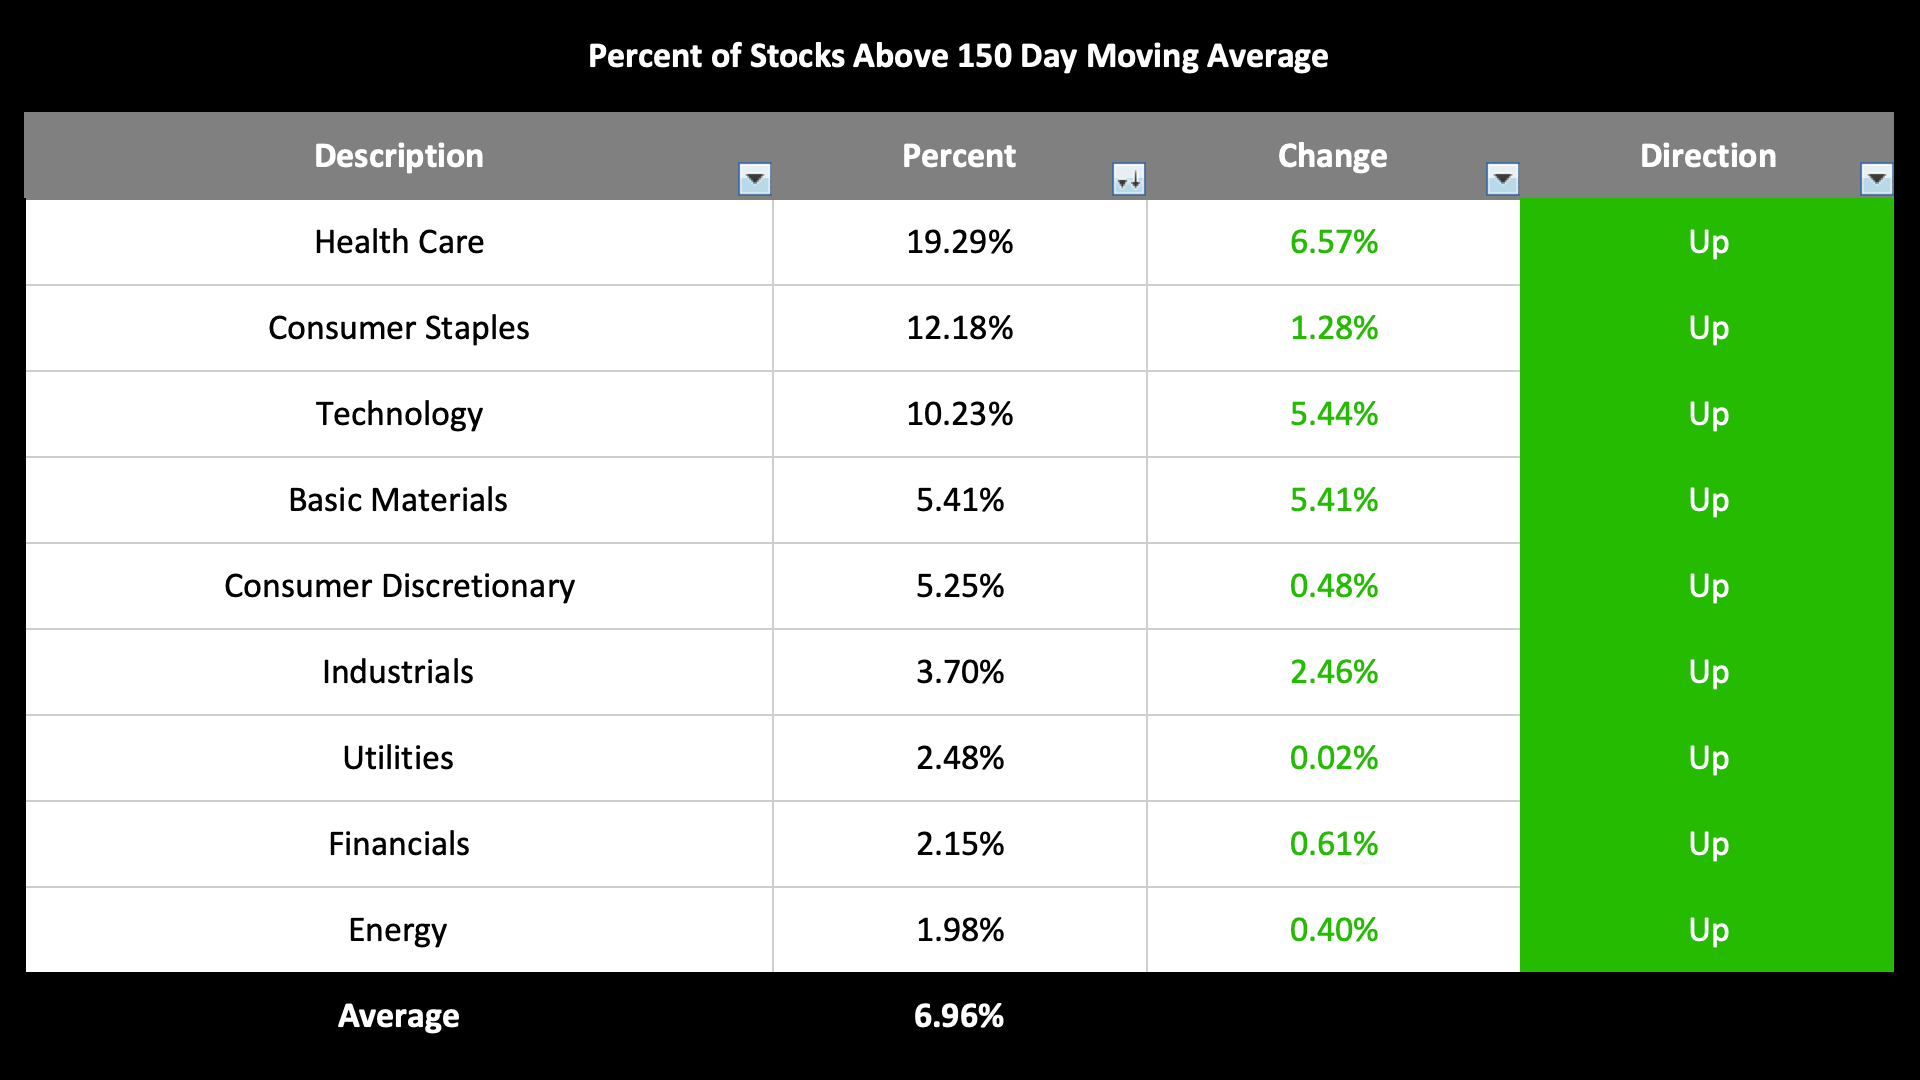
- Sector Breadth: Percentage of Stocks Above Their 150 Day Moving Average – Relative Strength Table (5:10)
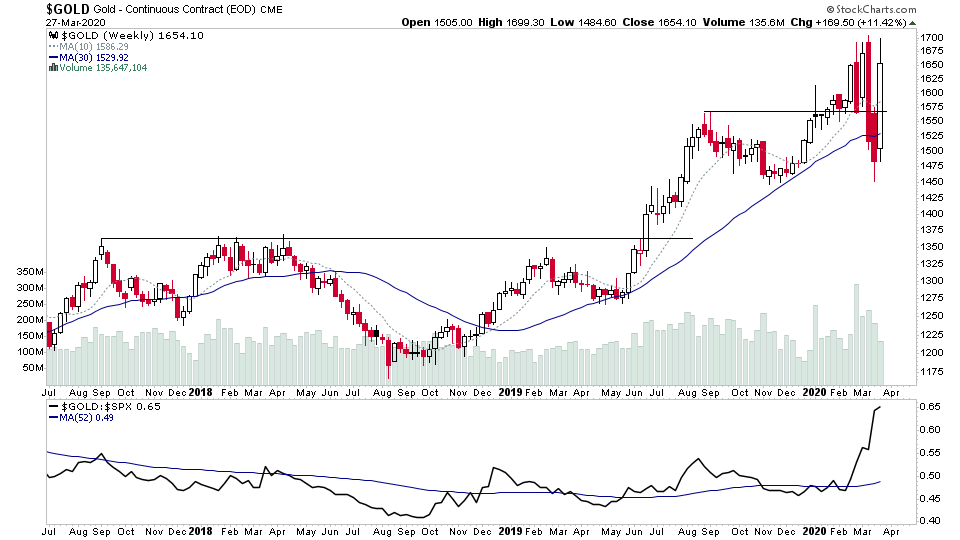
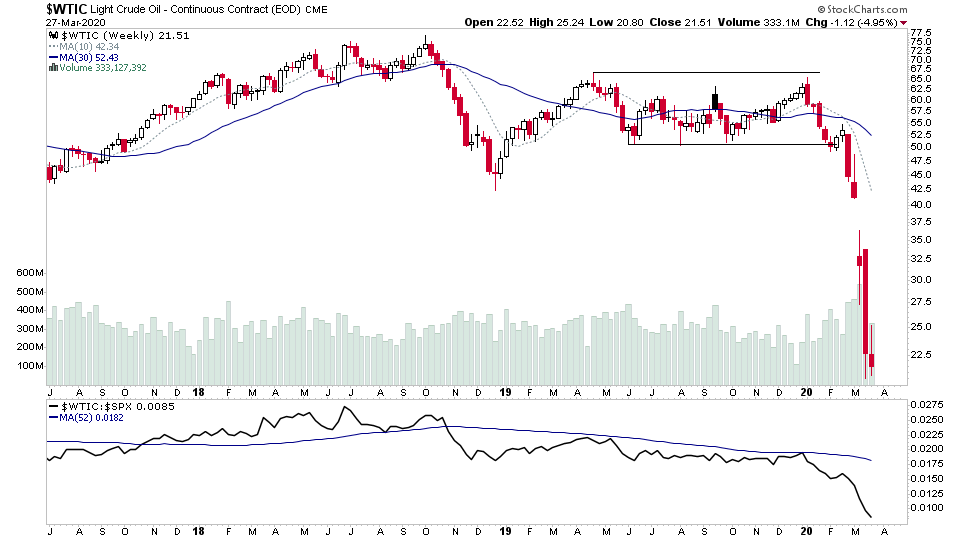
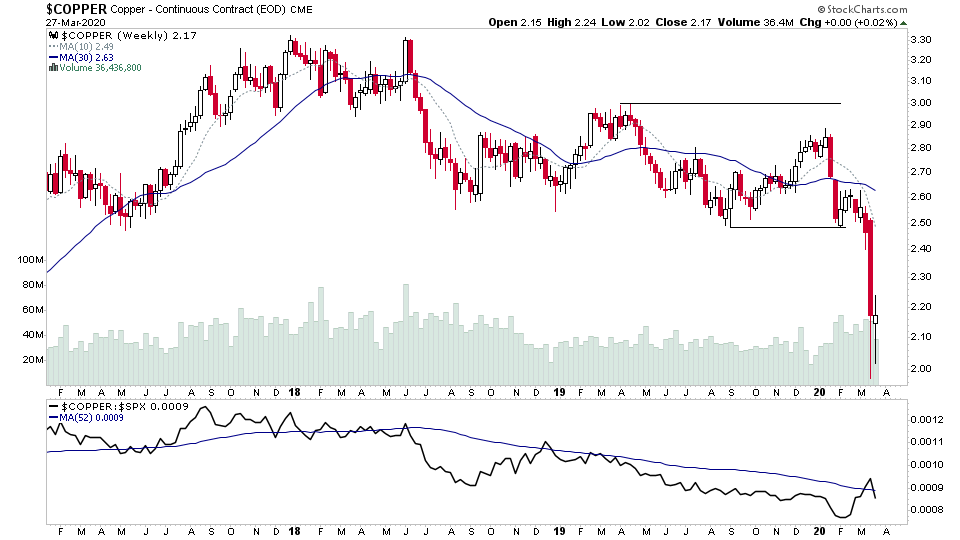
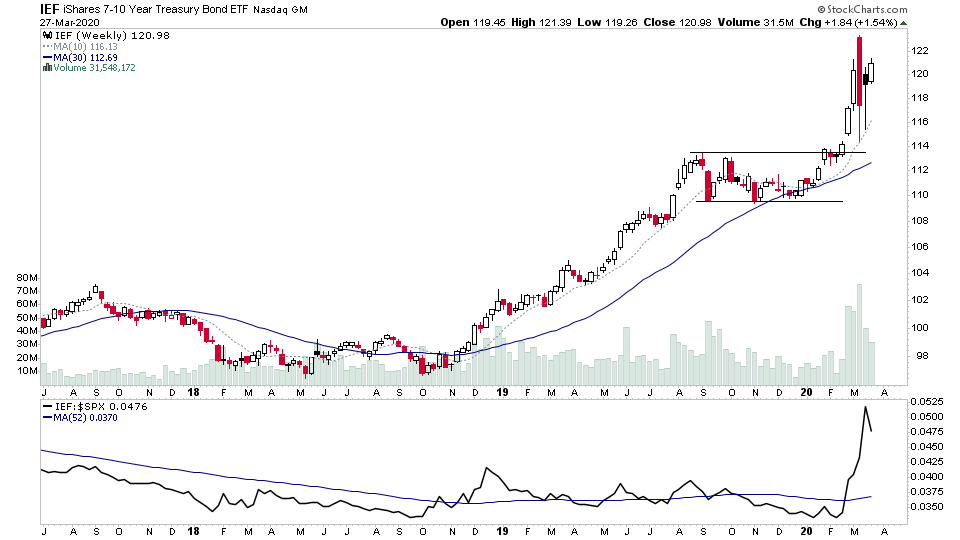
- US Treasuries & Commodities – 7-10 Year US Treasuries, Gold, Crude Oil & Copper (5:51)
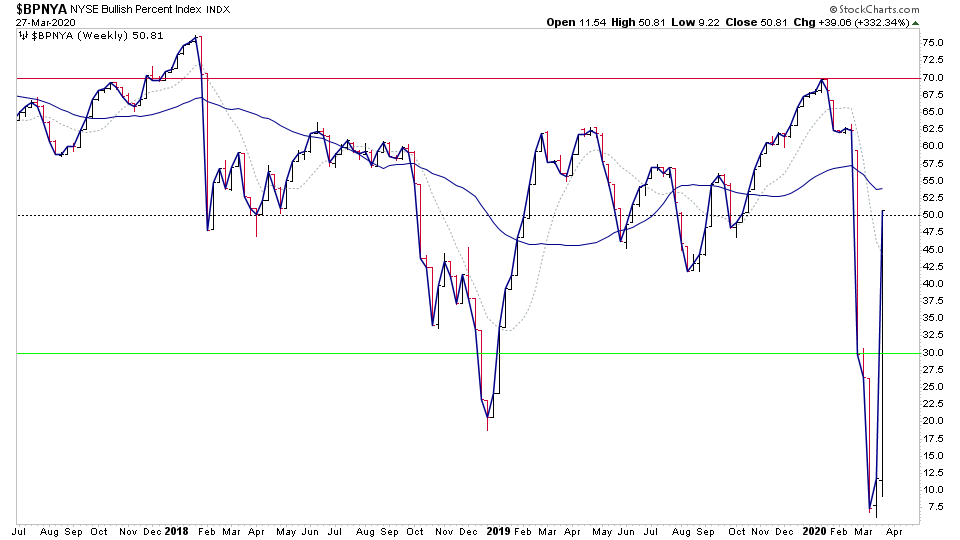
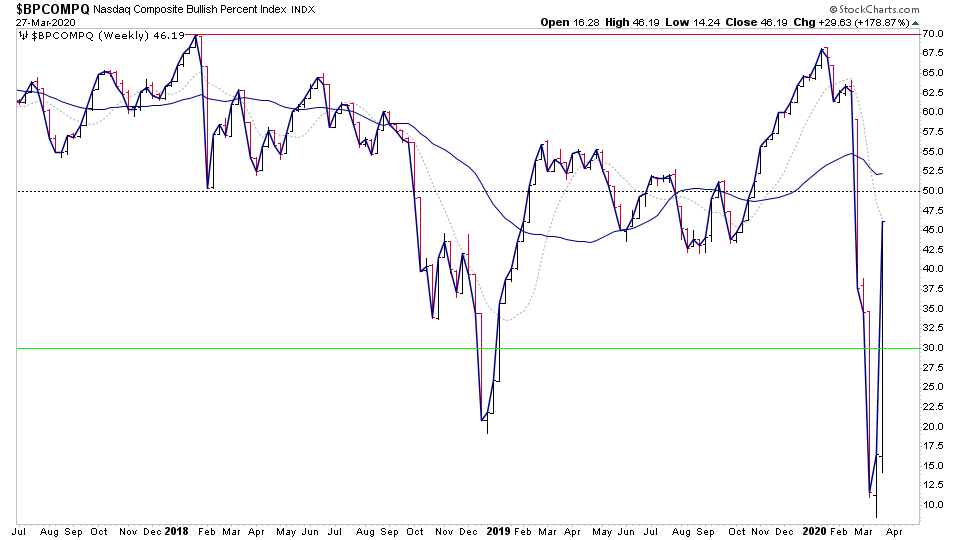
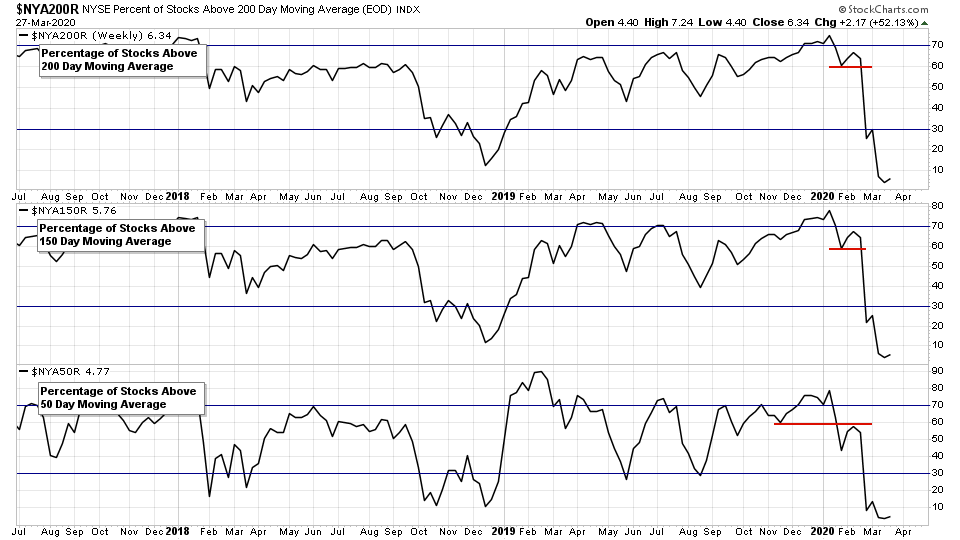
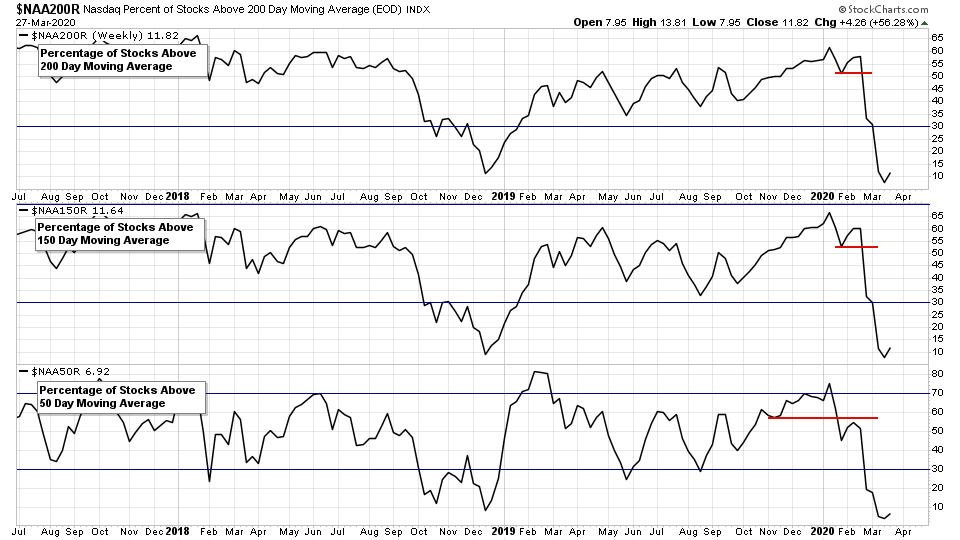
- NYSE Bullish Percent Index & Percentage of Stocks Above Their 200, 150 & 50 Day Moving Averages Charts (7:45)
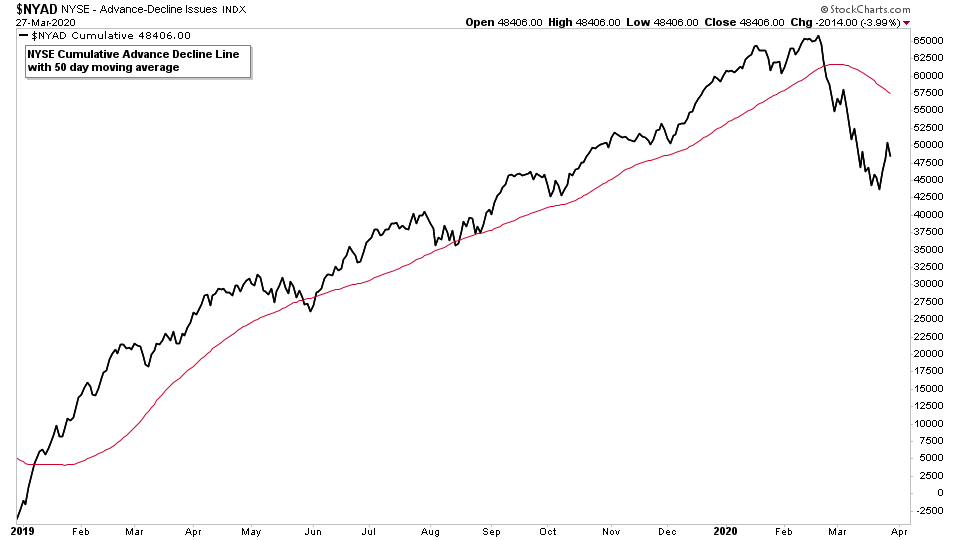
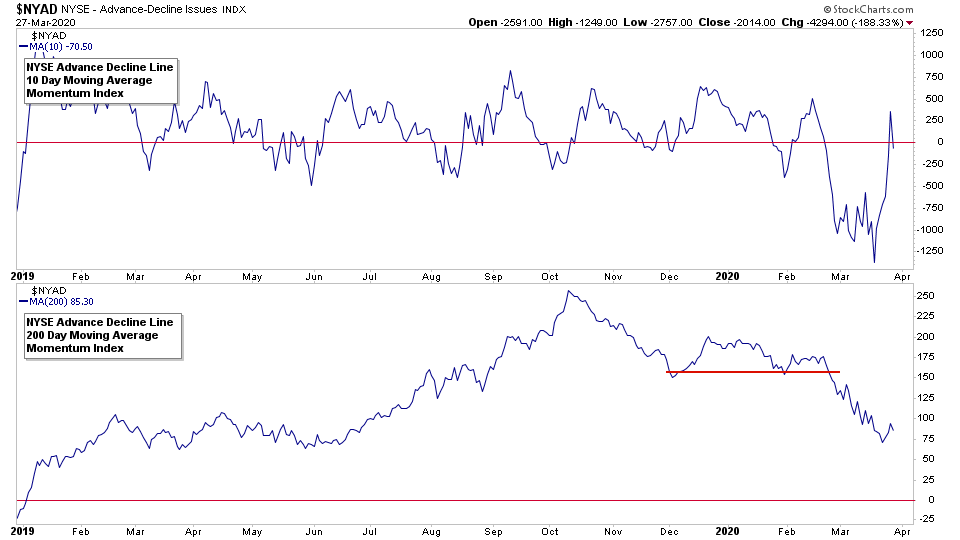
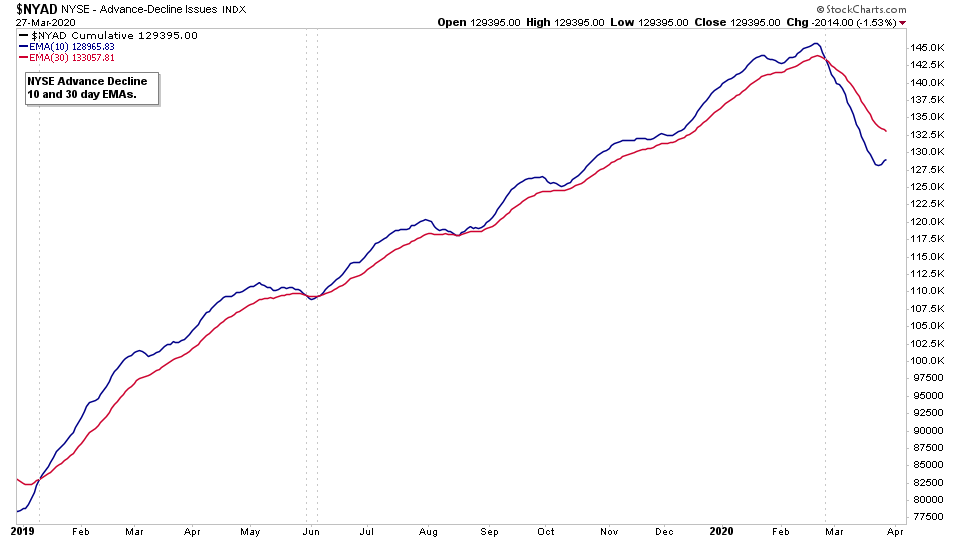
- NYSE Advance Decline Line Charts (11:17)
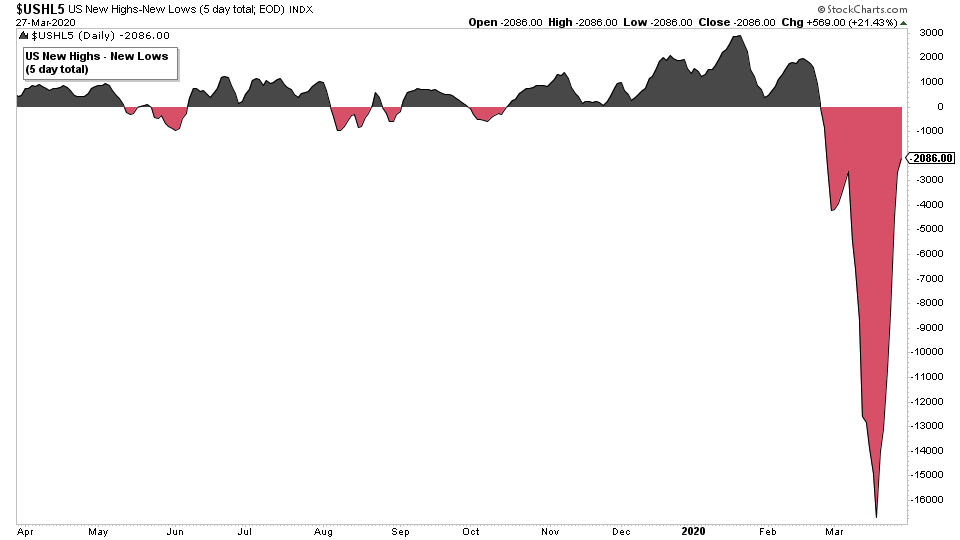
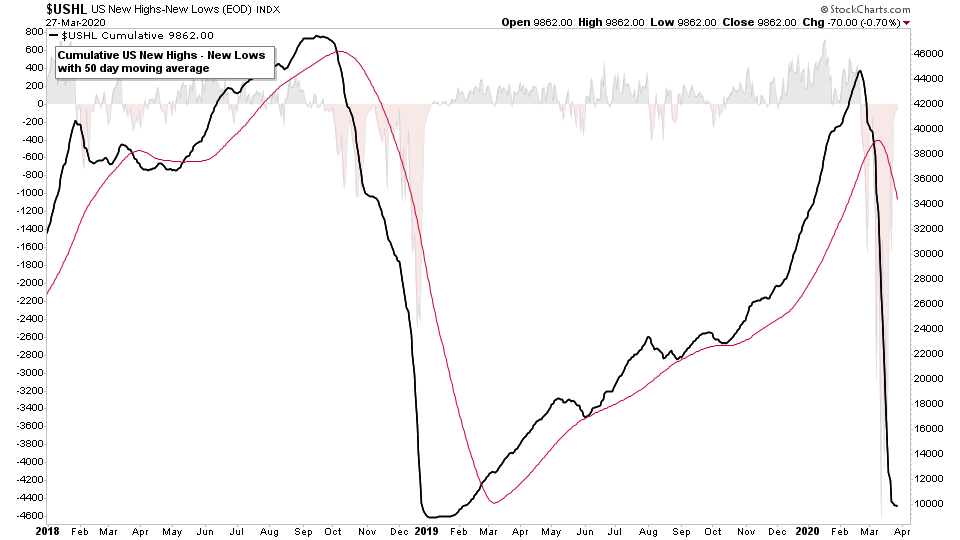
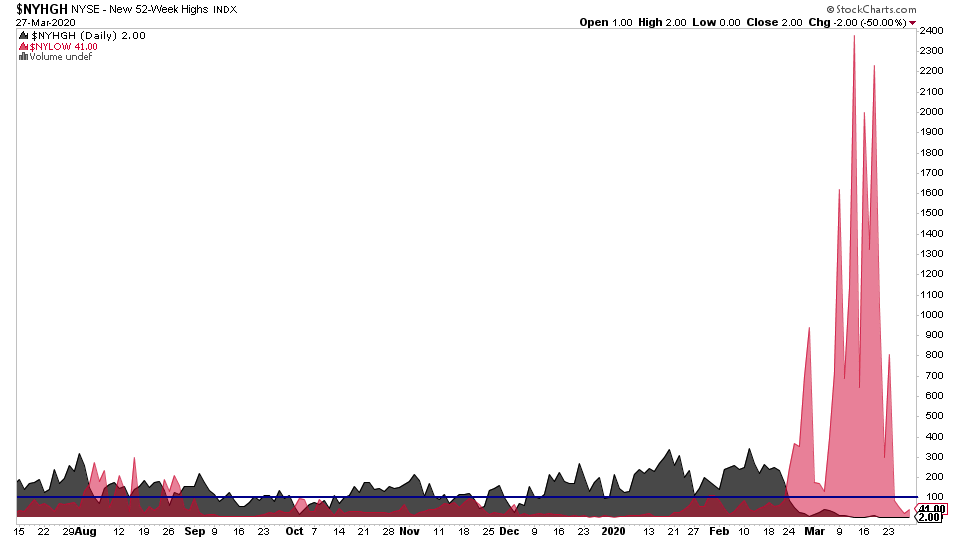
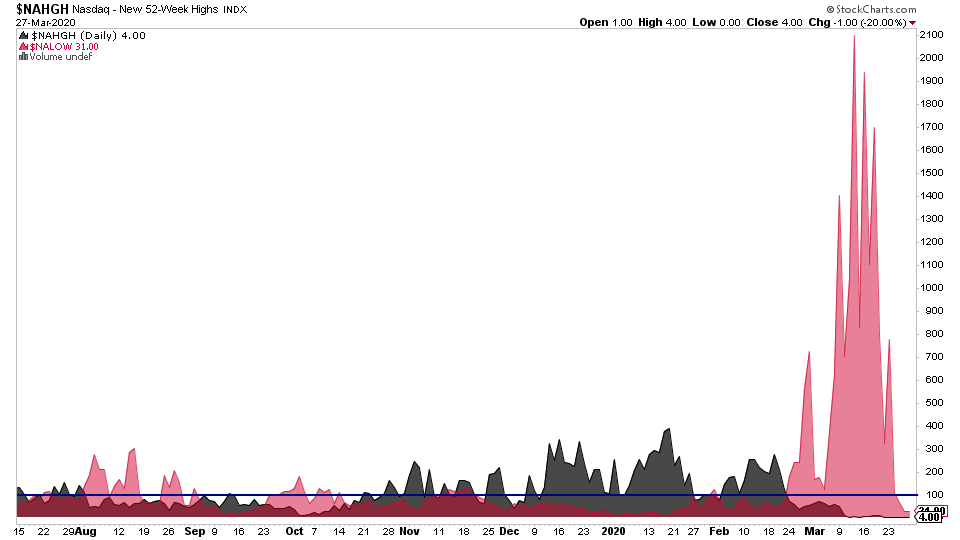
- US New Highs - New Lows Charts & Momentum Index (12:57)
- Cumulative Point & Figure Breakouts - Breakdowns Chart (14:14)
- Overview of the Weight of Evidence (15:45)
It was a strong week for the major stock market indexes with multiple stock index charts (including the S&P 500, DOW Industrials and the Nasdaq 100) all closing the week with a bullish engulfing candle pattern on the weekly charts.
S&P 500, Nasdaq 100, Dow Jones Industrial Average, S&P 600 Small Caps, NYSE, Nasdaq Composite
US Treasuries, Gold, Crude Oil and Copper
NYSE & Nasdaq Bullish Percent Index and Moving Average Breadth Charts
Sector Breadth – Percentage of Stocks Above Their 150 Day Moving Average
NYSE Advance Decline Line Indicators
US New Highs New Lows
Cumulative Point and Figure Double Top Breakouts and Double Bottom Breakdowns
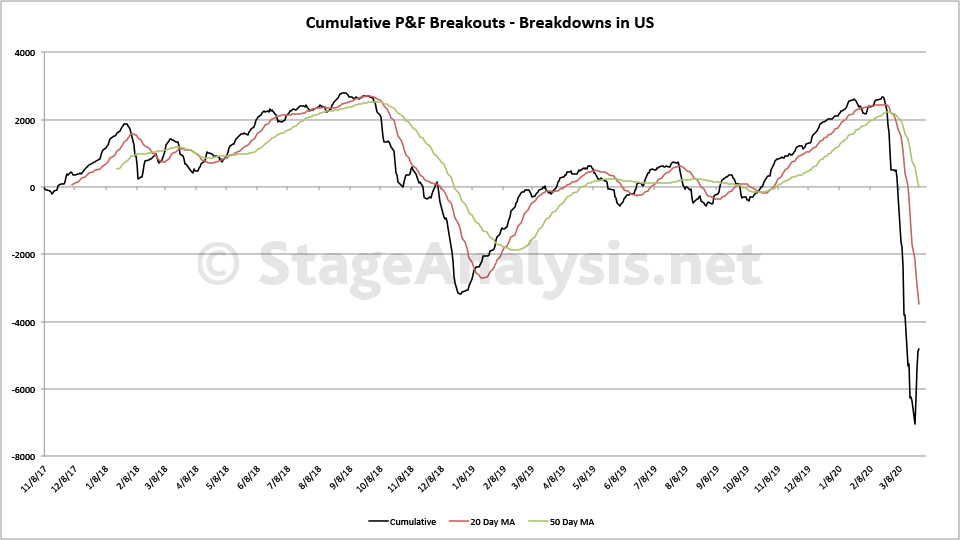
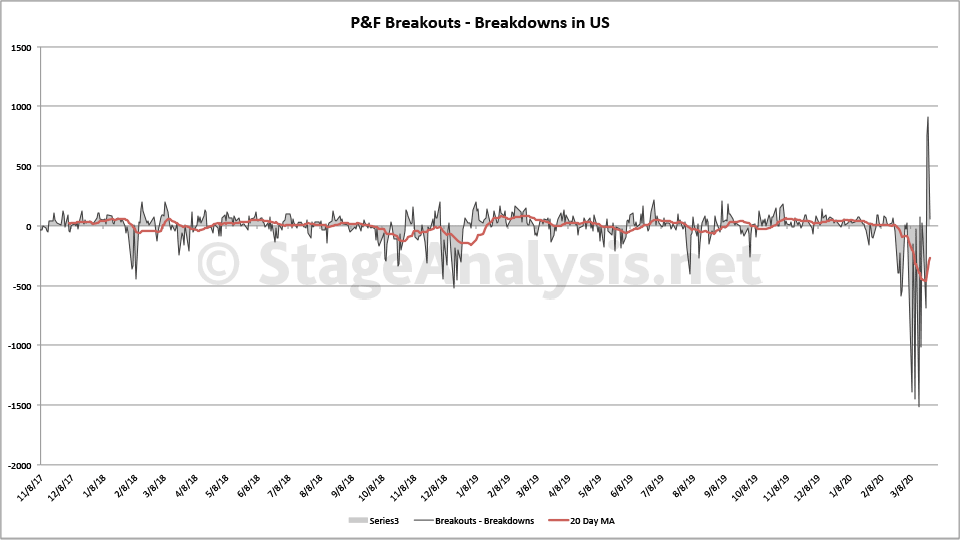
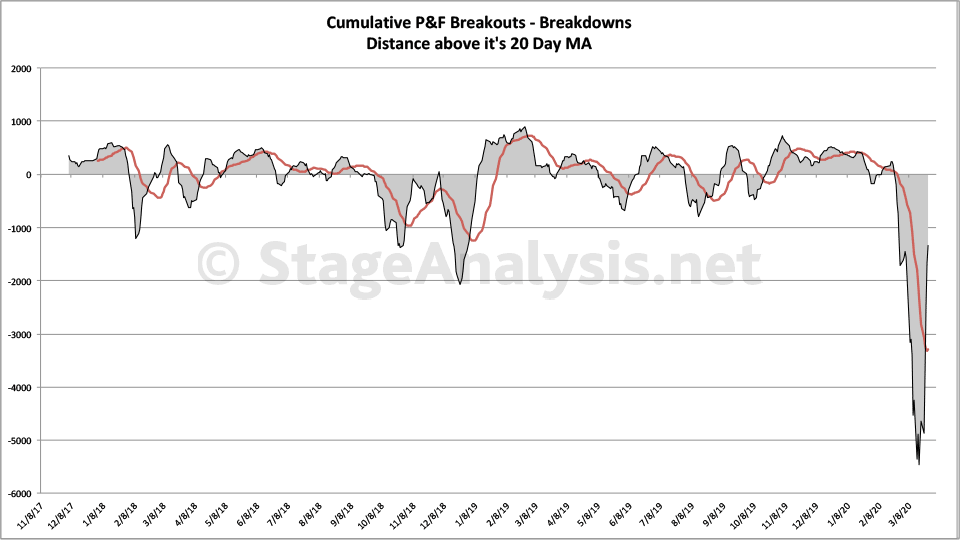
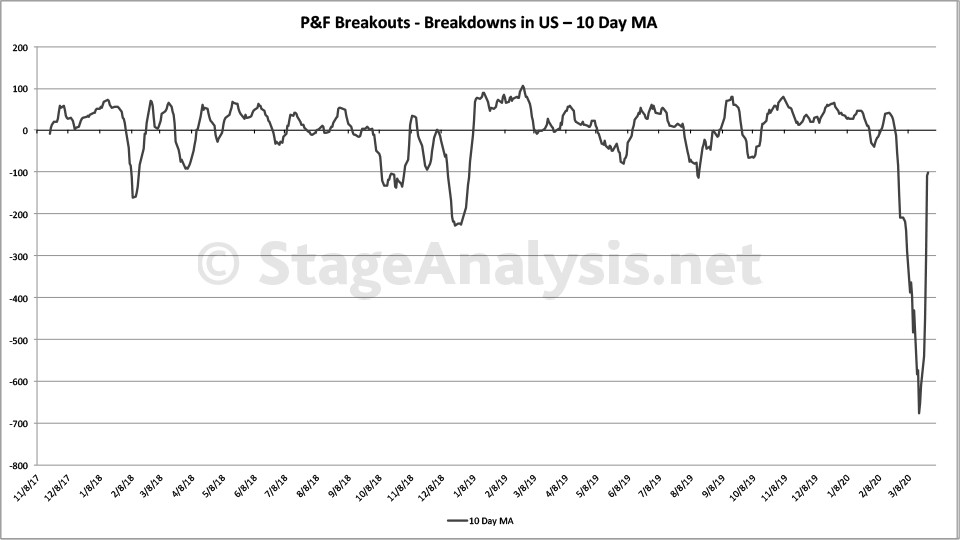
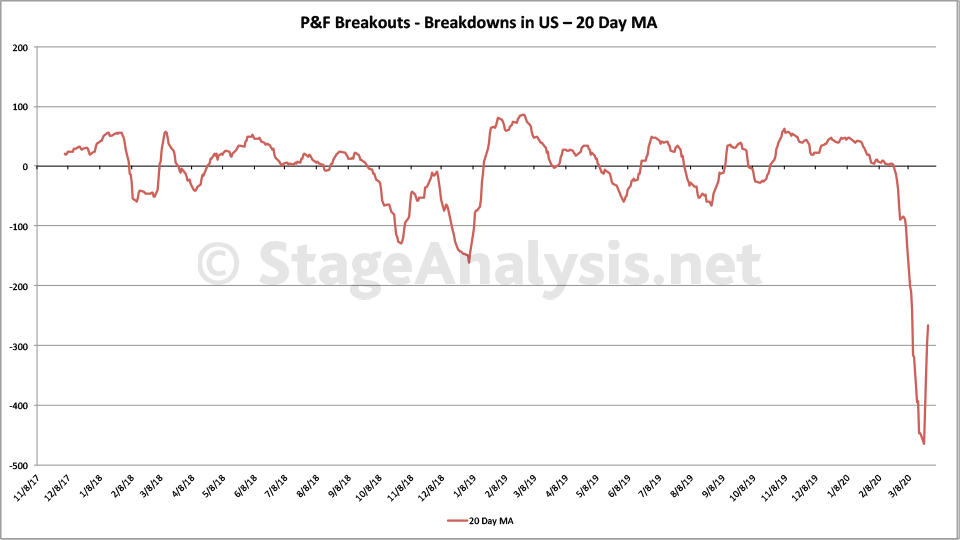
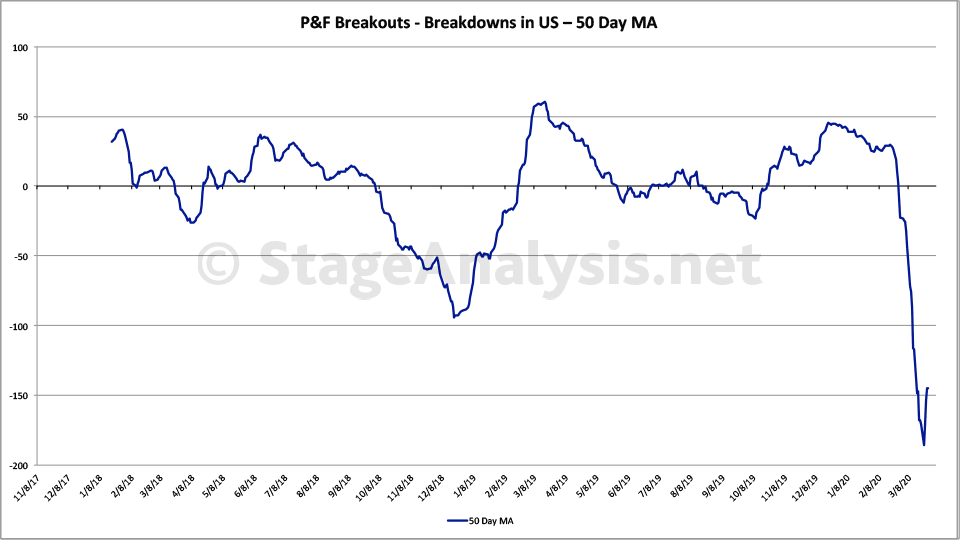
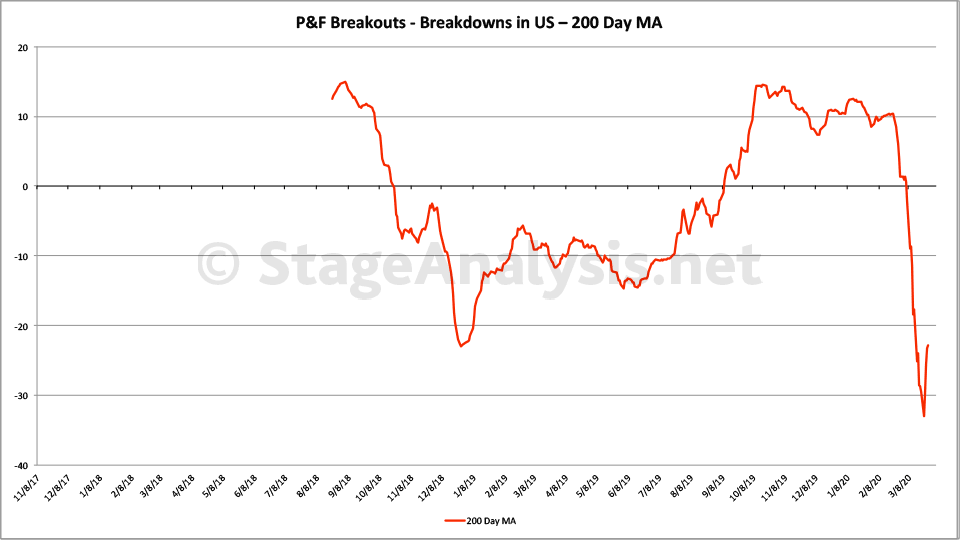
Above is the updated custom breadth charts that I do based on the daily point and figure double top breakouts and double bottom breakdowns.
Totals for the week:
+2460 double top stock breakouts
-931 double bottom stock breakdowns
+1529 net stock breakouts - stock breakdowns
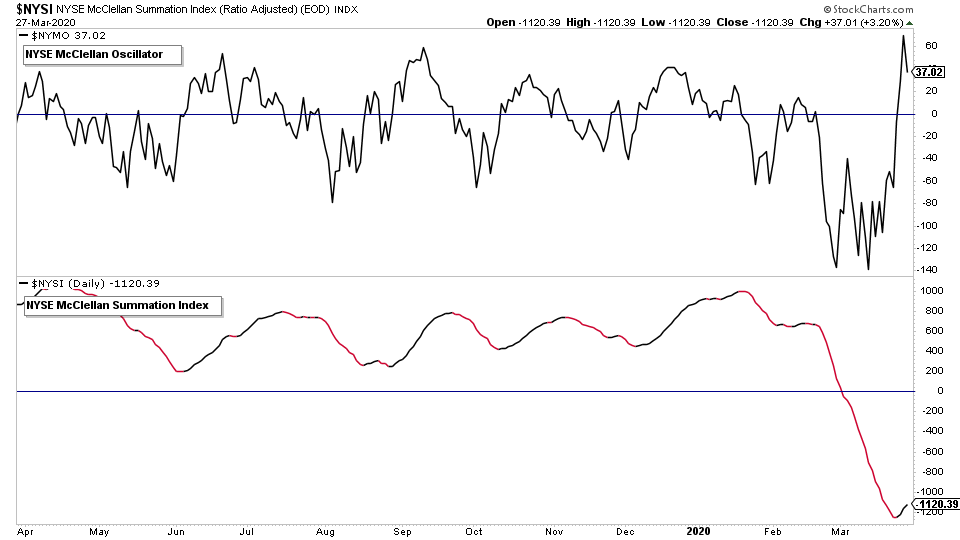
There were also positive moves in some of the short term Market Breadth charts, with NYSE Bullish Percent Index giving a Bull Alert Signal after its largest positive weekly move that I can remember. And some positives in the short term Advance Decline Momentum Index and McClellan Oscillator which both had breakouts from the their recent ranges back above their zero lines.
However, although there are some short term positives. The majority of medium and longer term market breadth indicators remain on bearish signals, with some like the percentage of stocks above their 150 day moving average at deeply oversold levels still. Which could take a while to resolve, as many stocks have fallen a long way below their moving averages in the past few weeks, and so there is a chance that the oversold state could remain in place for months before their is a medium to long term bullish signal – especially if stocks go into a choppy sideways phase from here.
Disclaimer: For educational purpose only. Not investment advice. Seek professional advice from a financial advisor before making any investing decisions.