
Stock Market Indexes Update & Market Breadth Charts. Nearing Capitulation?
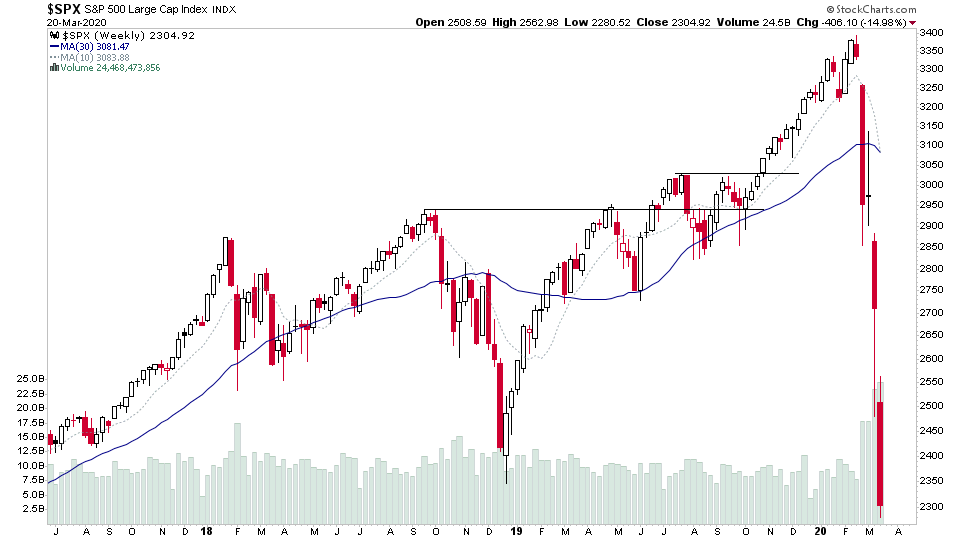
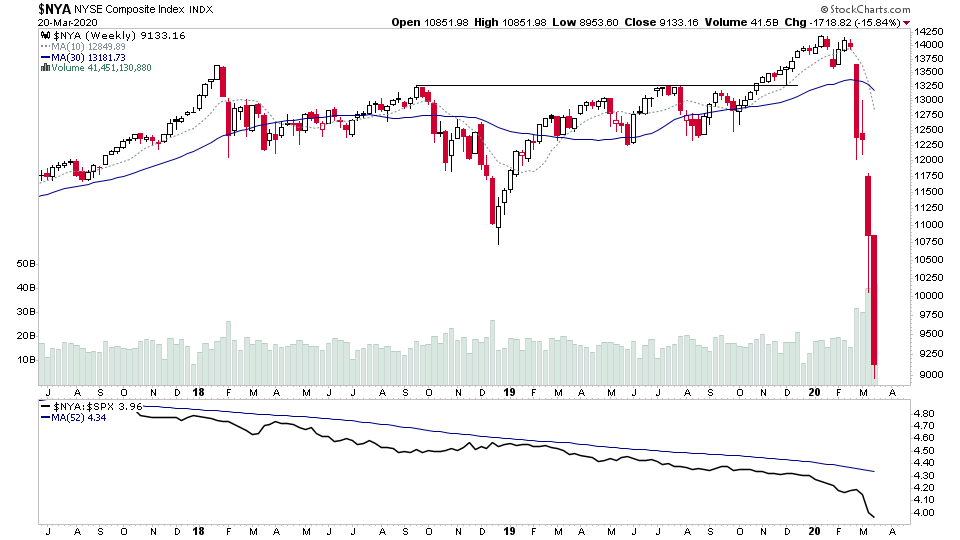
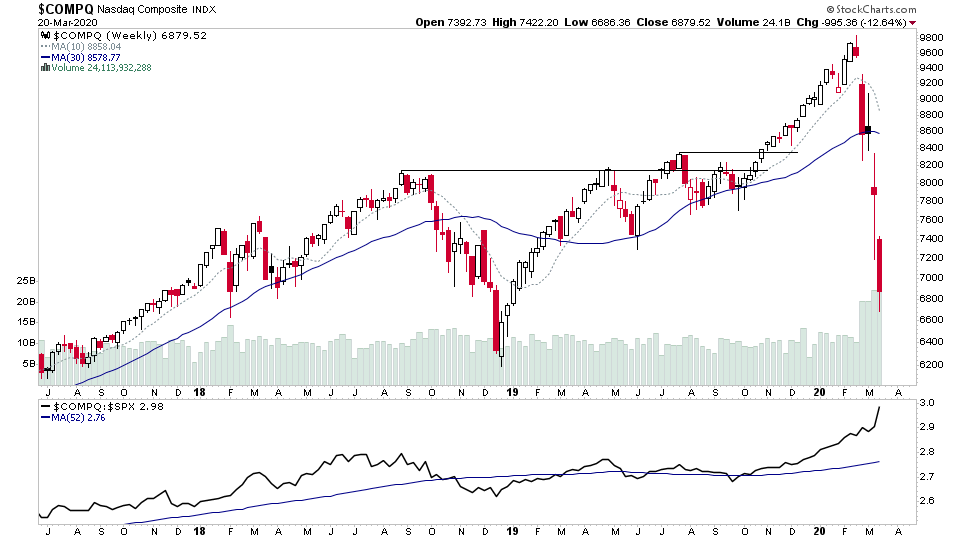
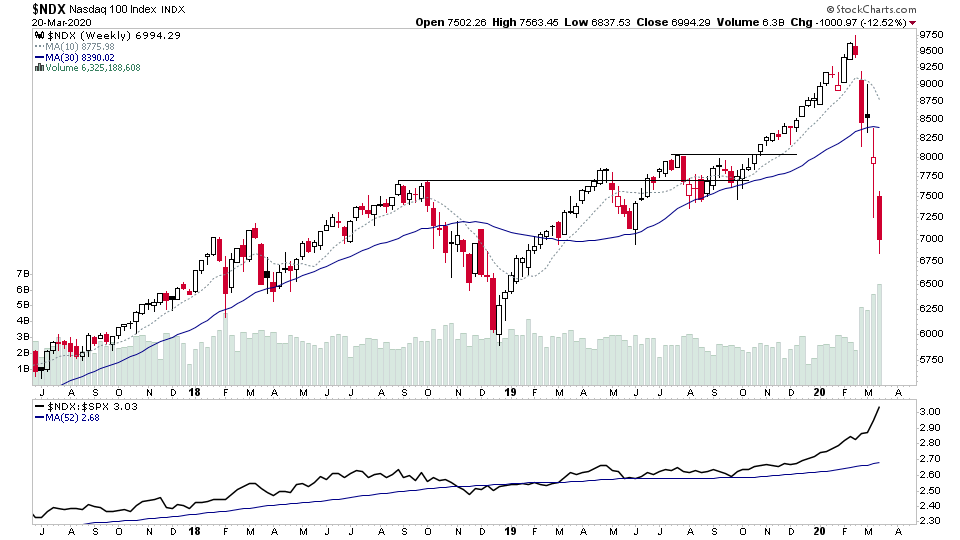
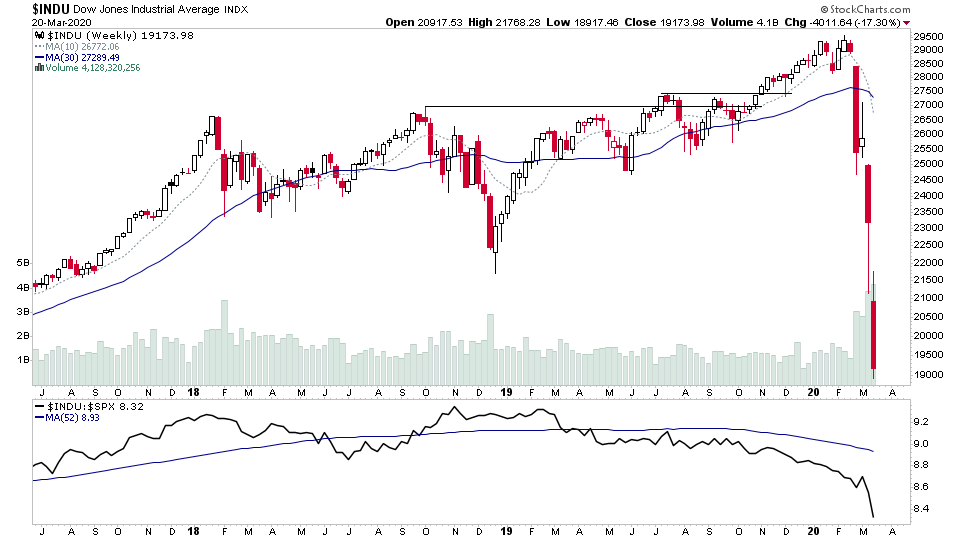
The stocks markets indexes and individual stock charts continued on tear lower this week, in deep Stage 4 territory for most. The bounce at the end of last week suckered in more people, only for the markets to rip lower again this week. Closing this time near the lows of the week.
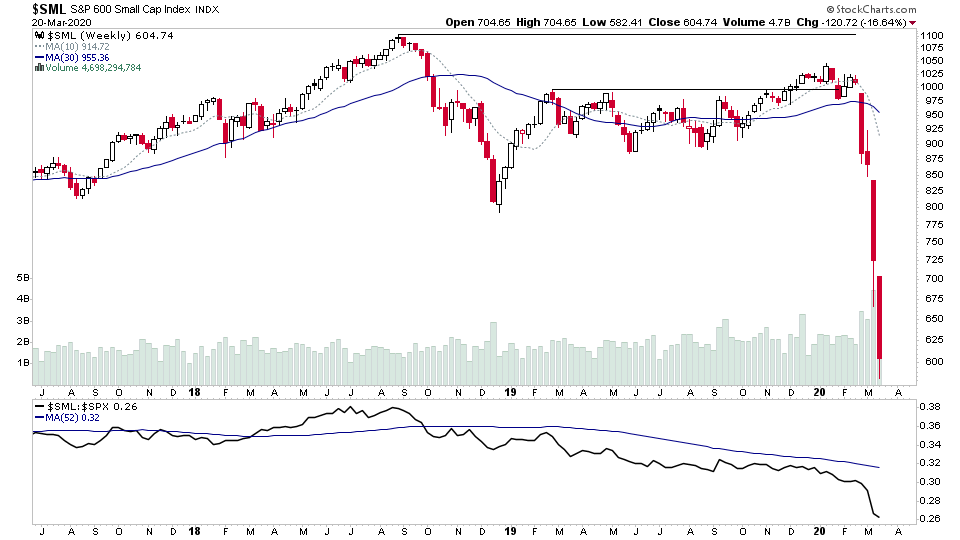
Most markets are now down over -30% since their highs only a few months ago. With the small caps fairing the worst down over -40%. So where are now. Let's take a look through the current charts and market breadth indicators to get an idea of the weight of evidence and if there's any small signs of hope anywhere.
S&P 500, Nasdaq 100, Dow Jones Industrial Average, S&P 600 Small Caps, NYSE, Nasdaq Composite
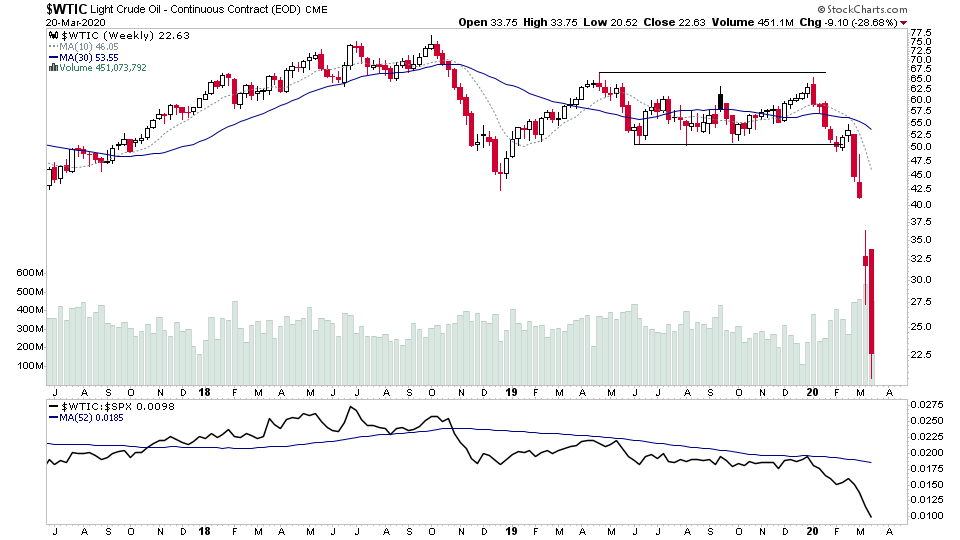
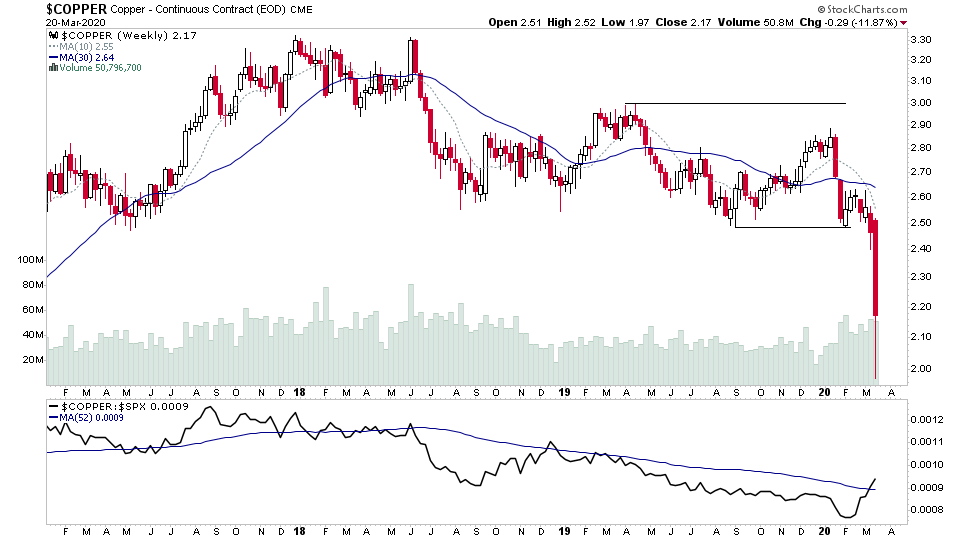
US Treasuries, Gold, Crude Oil and Copper
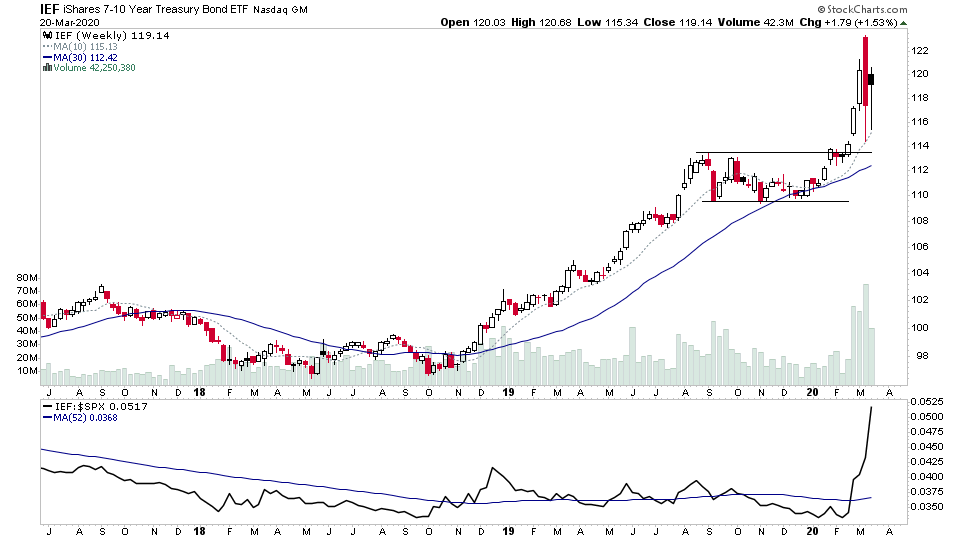
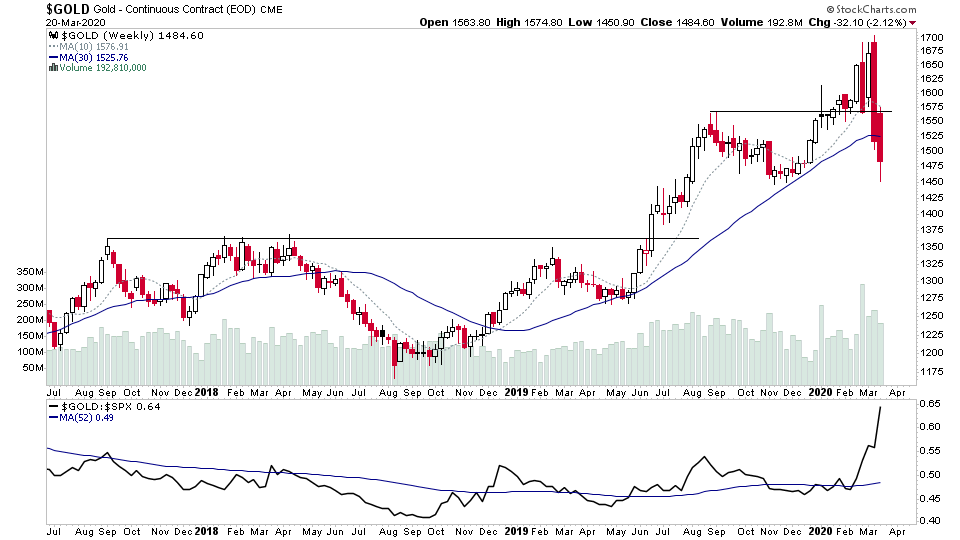
US Treasuries recovered from the previous weeks volatility to close the week higher again, maintaining their Stage 2 advance. Gold on the other hand saw further selling and closed a second week below a flattening 30 week moving average, and so is now in Stage 3A.
Oil had another terrible week. Falling a further -28%, and is now down over -60% from its early year high. A great example of why you never attempt to catch a falling knife.
And Copper finally completed its Stage 4 breakdown that it's been threatening for a while with a huge single drop of its own, highlighting the potential of a global recession from this crisis.
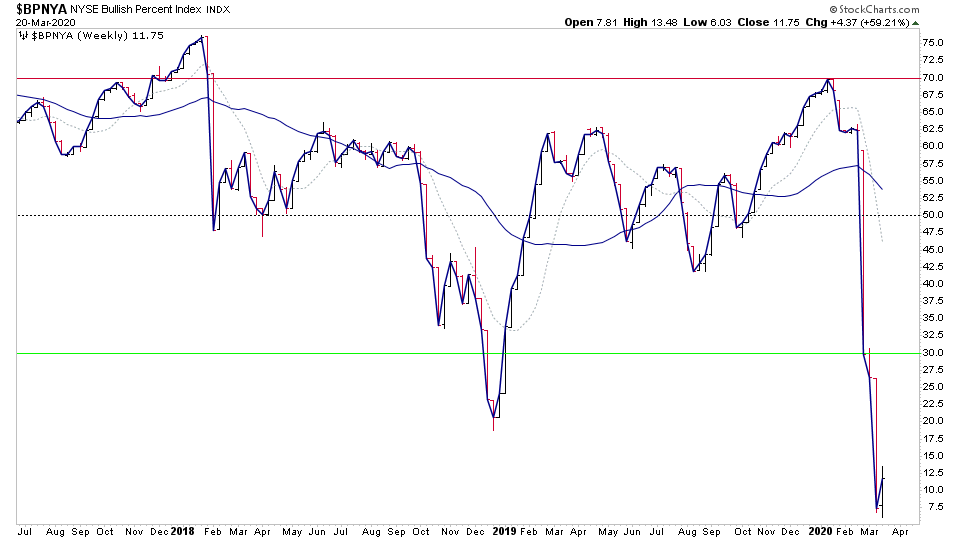
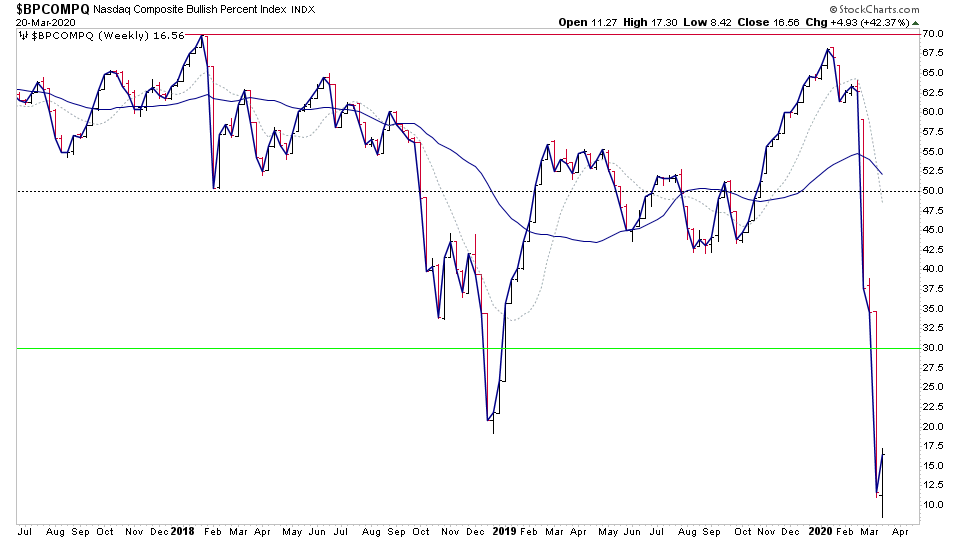
NYSE & Nasdaq Bullish Percent Index
Sector Breadth – Percentage of Stocks Above Their 150 Day Moving Average
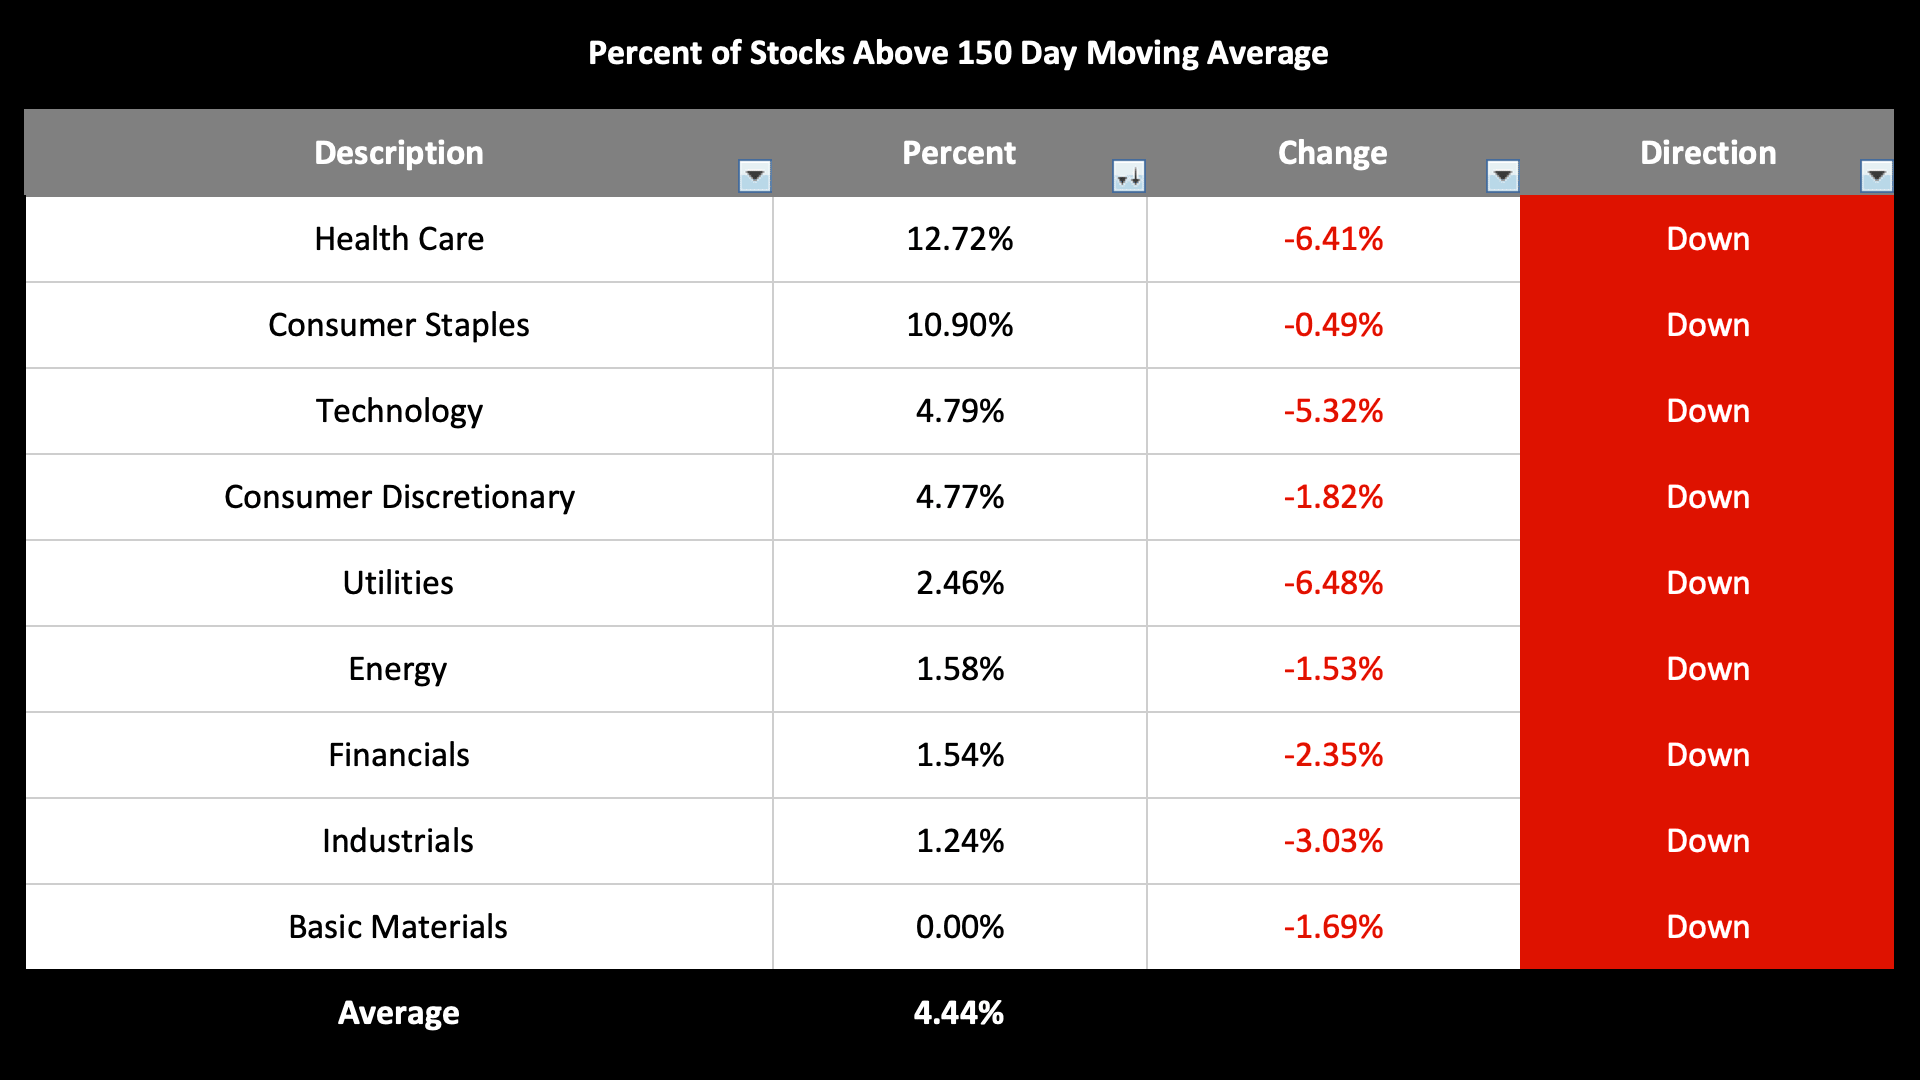
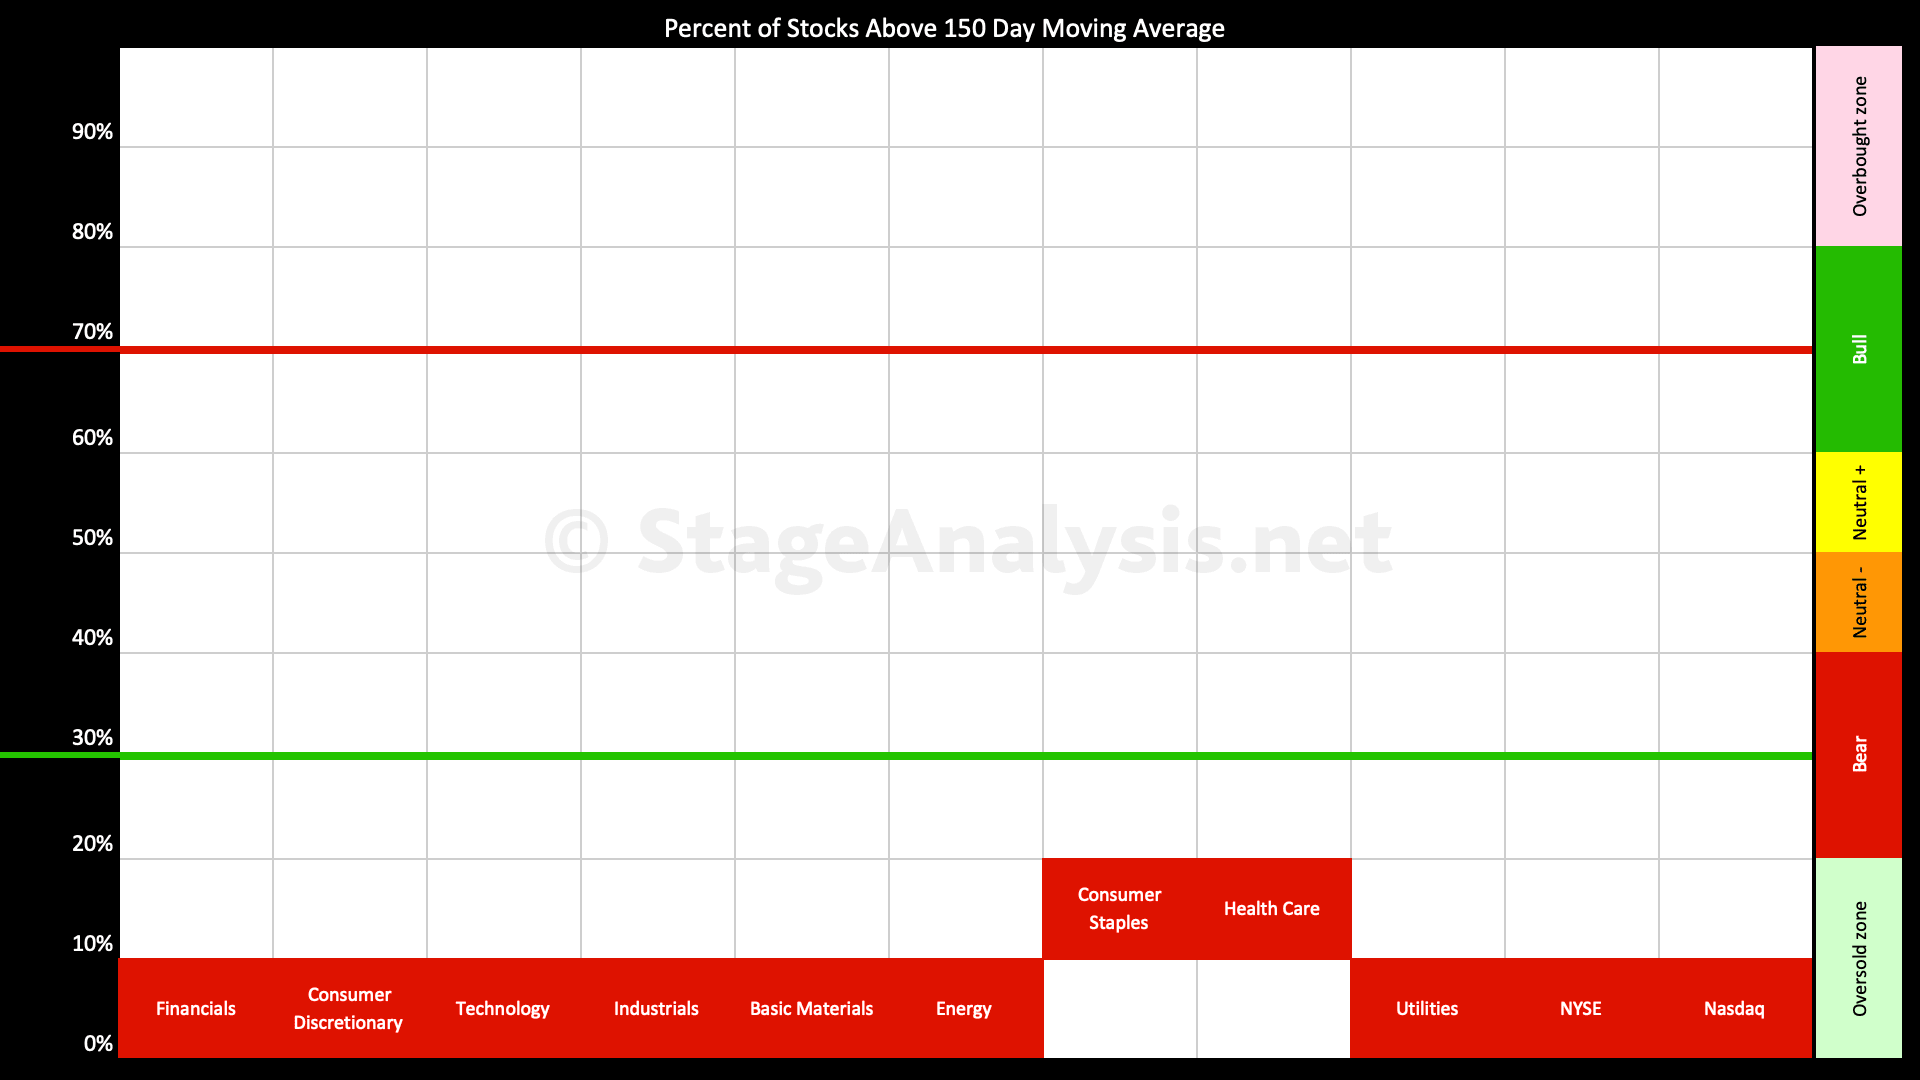
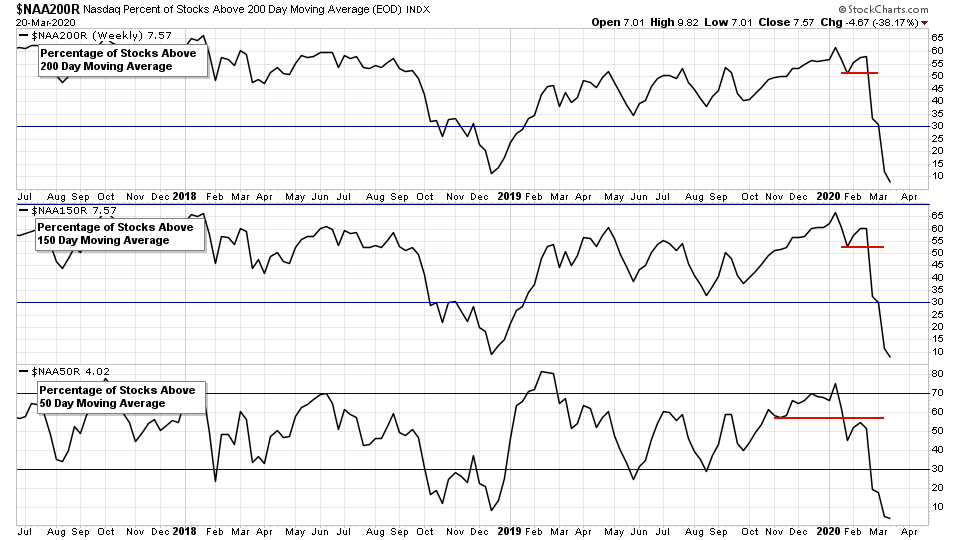
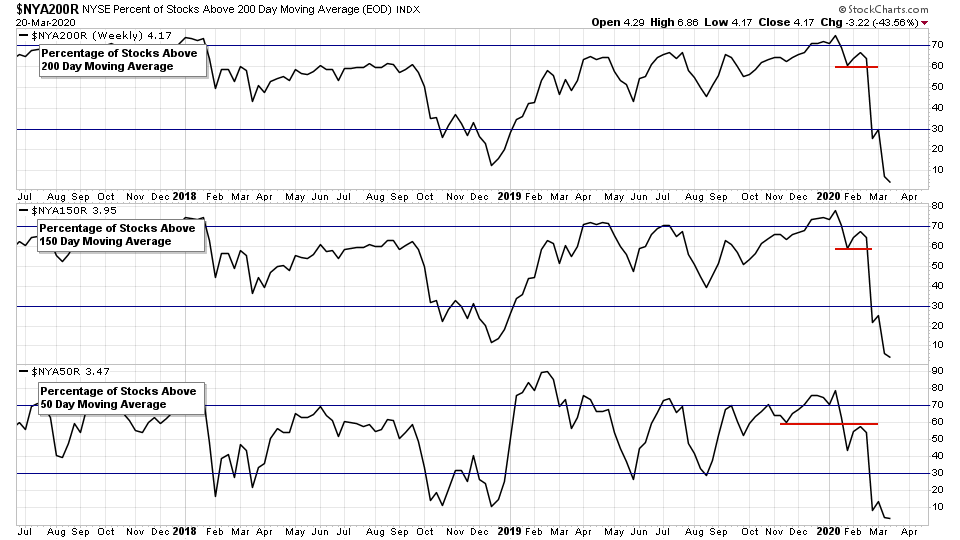
Not much new to say of the Bullish Percent Index Charts and Percentage of Stocks Above Their 150 Day Moving Average. A small bounce in the Bullish Percent Indexes, but the Moving Average charts continued to new lows, and in the Sector Breadth we saw out first ever 0% reading with Basic Materials hitting 0%, whereas the majority of other sectors fell into deeply oversold 0% to 10% range. So no where bar Treasuries seems to have been safe from the carnage in the markets.
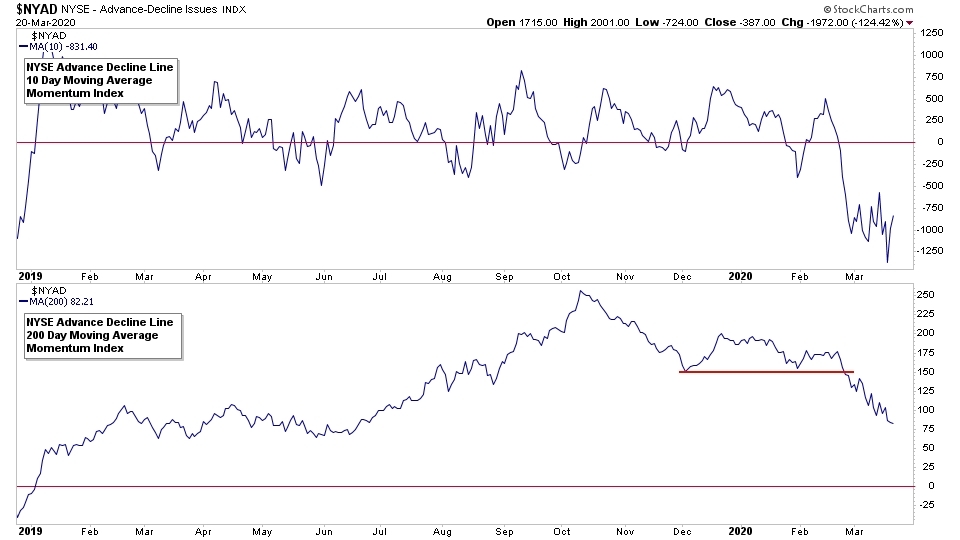
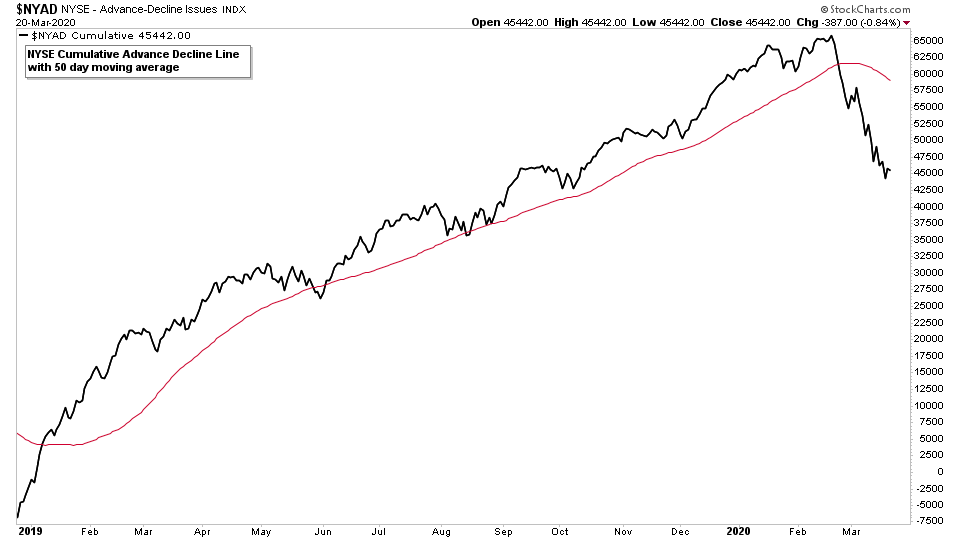
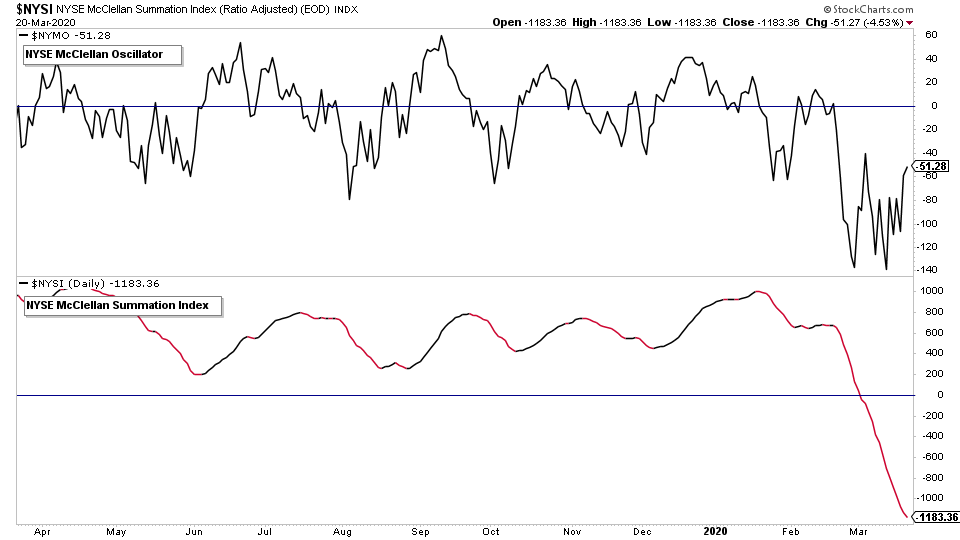
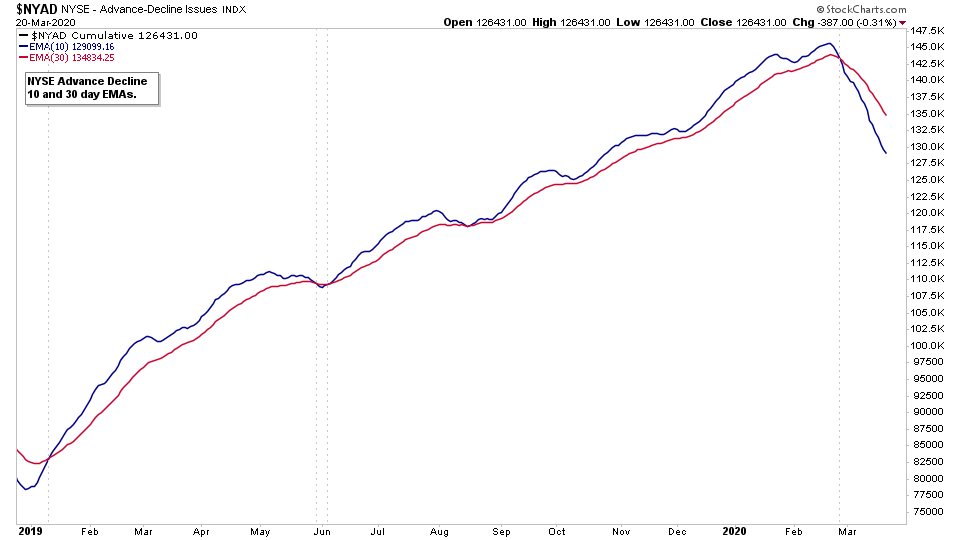
NYSE Advance Decline Line Indicators
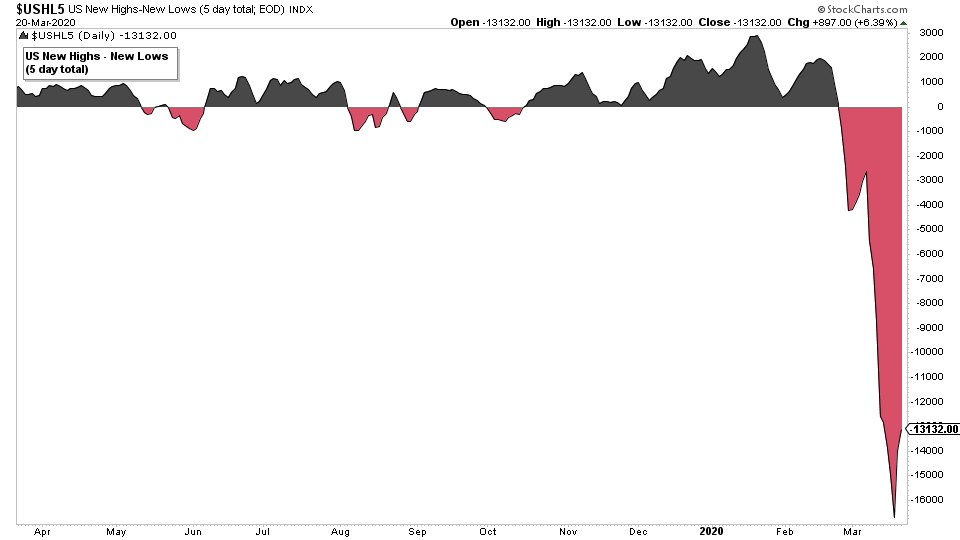
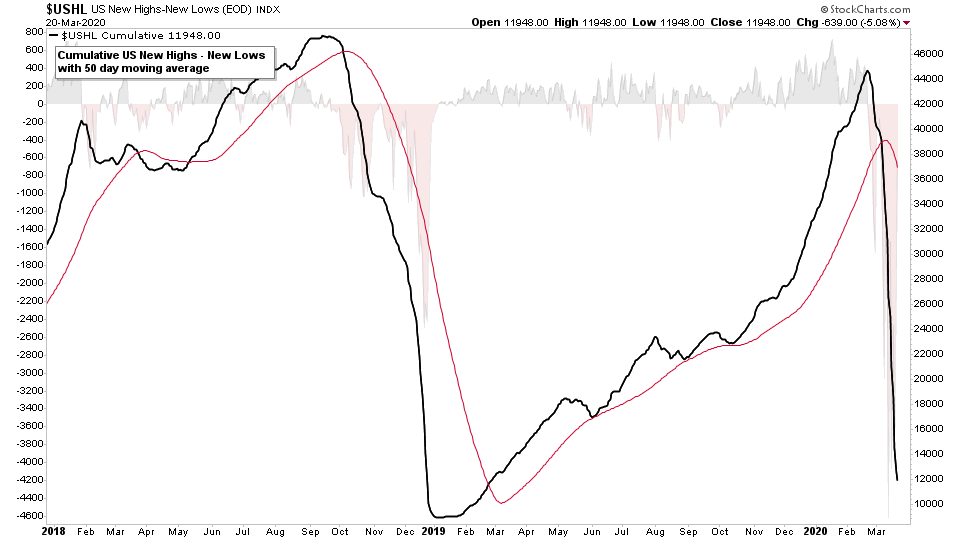
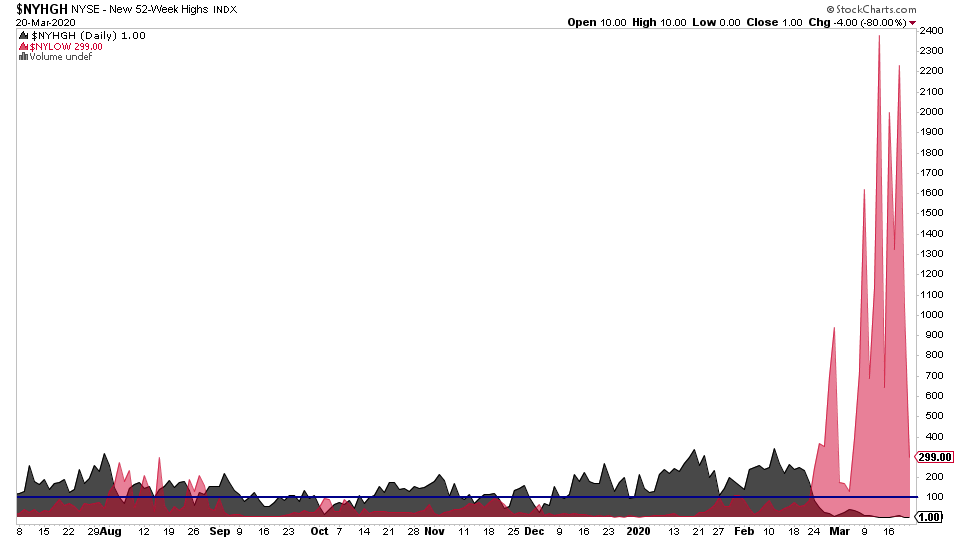
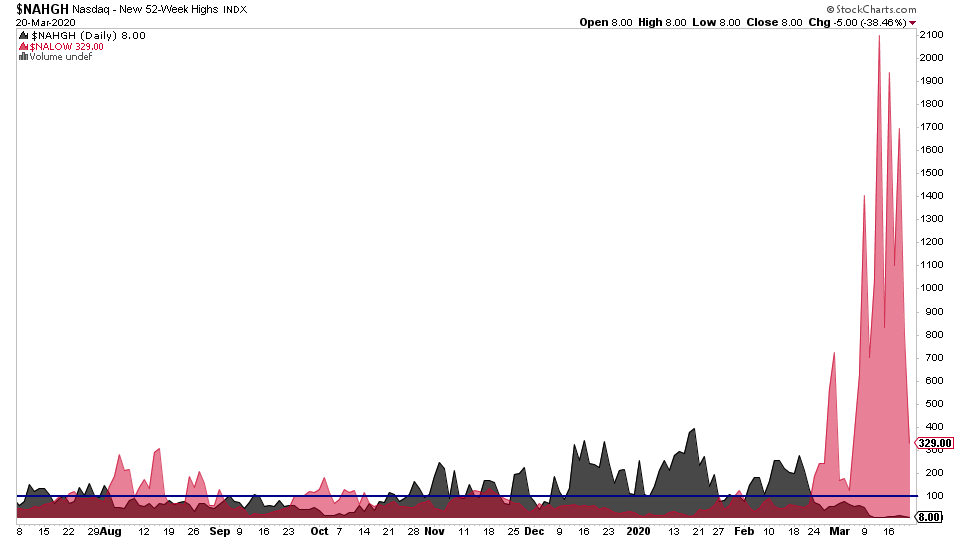
US New Highs New Lows
Cumulative Point and Figure Double Top Breakouts and Double Bottom Breakdowns
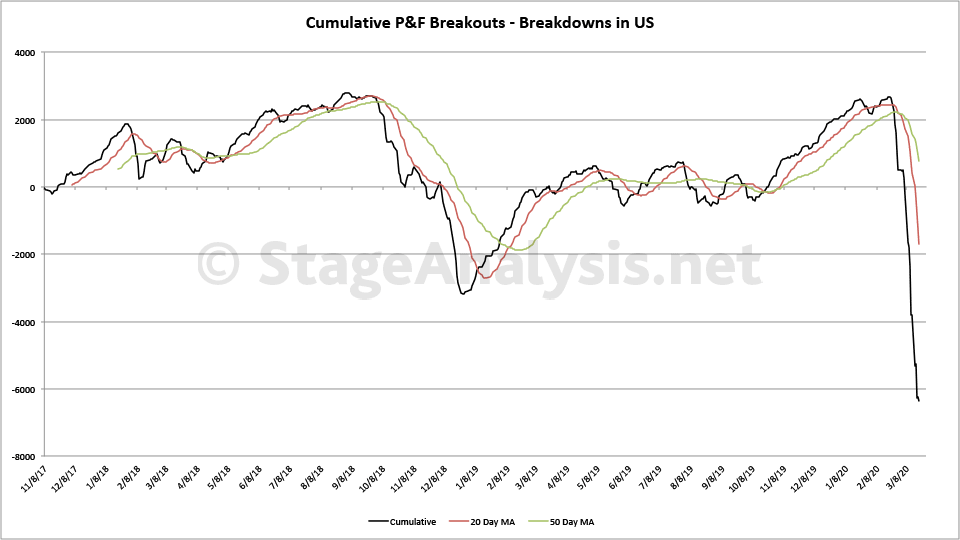
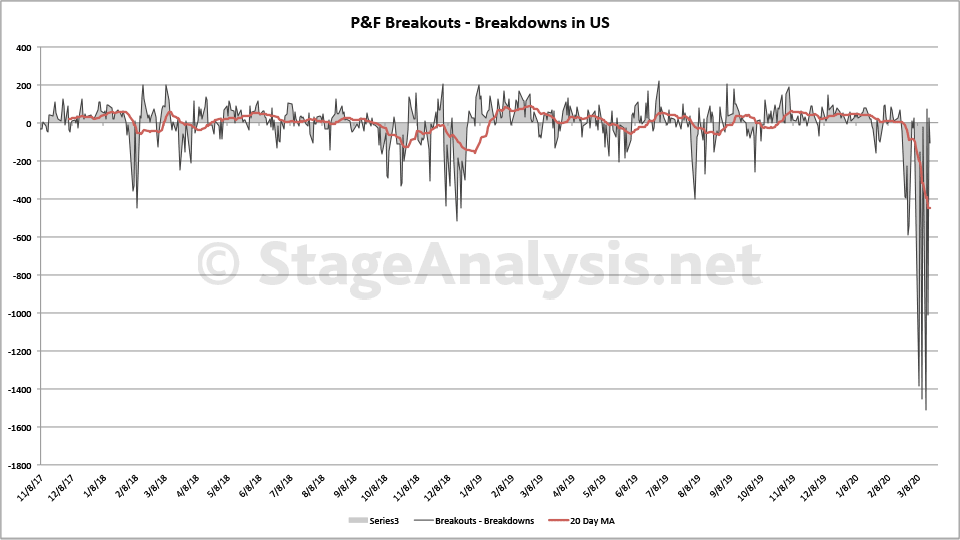
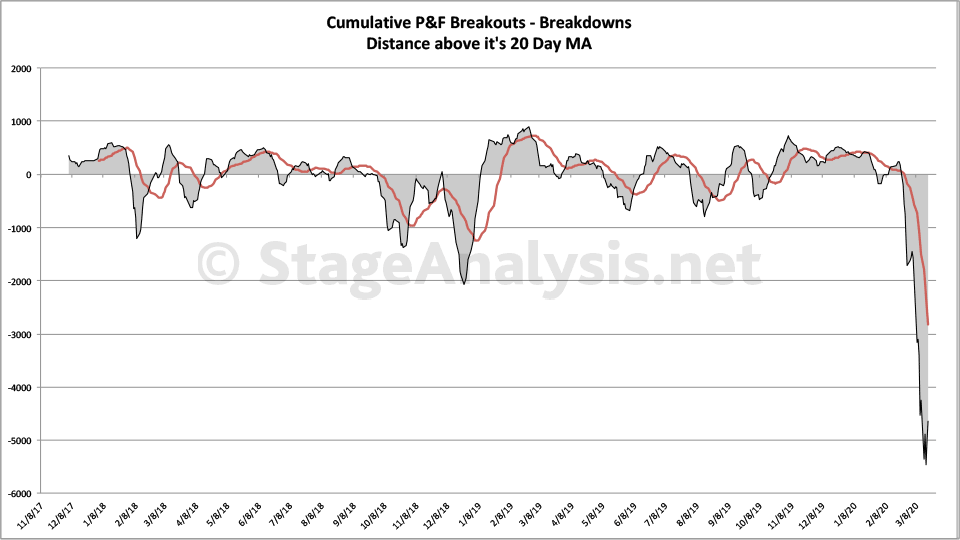
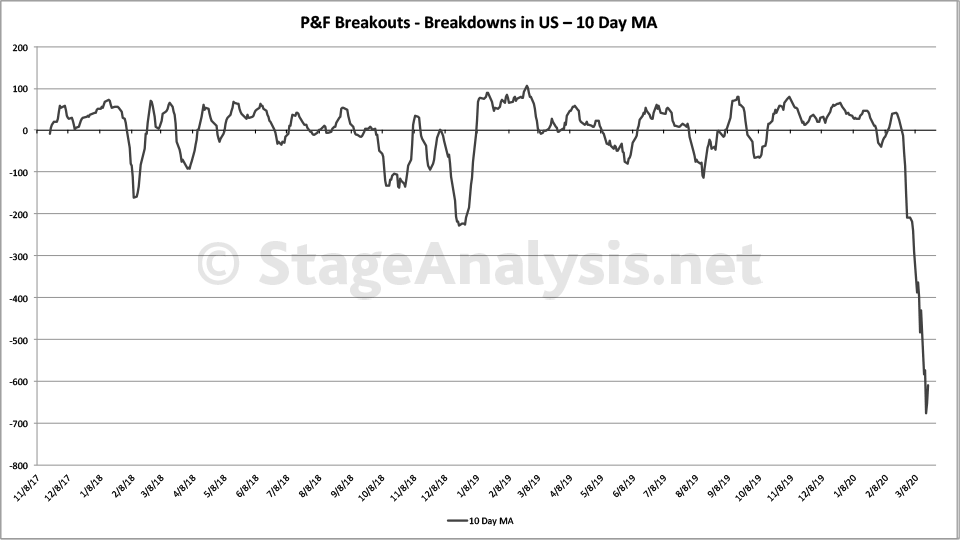
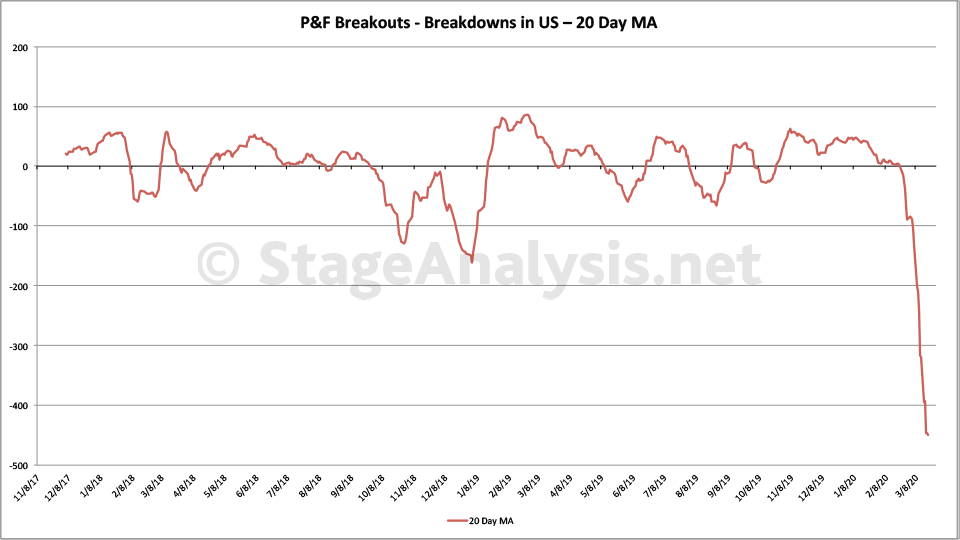
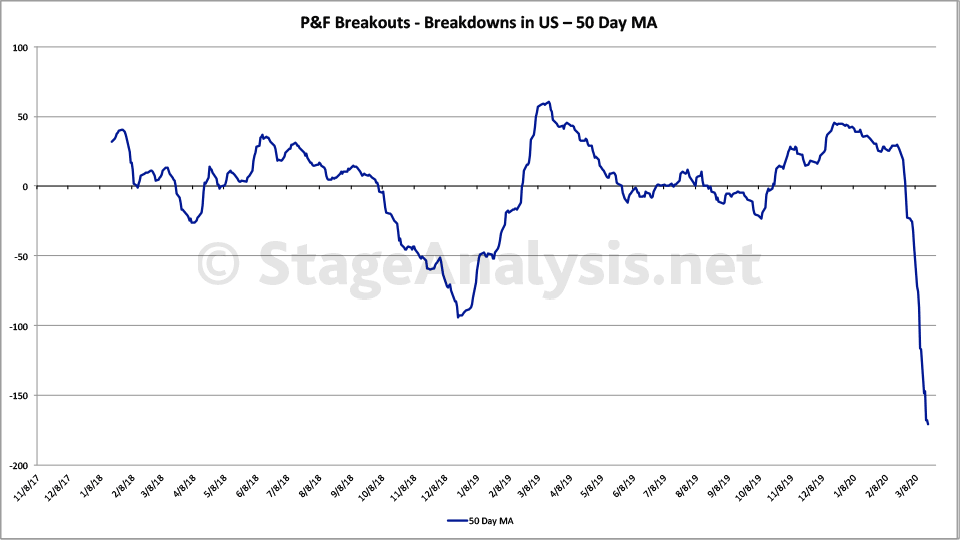
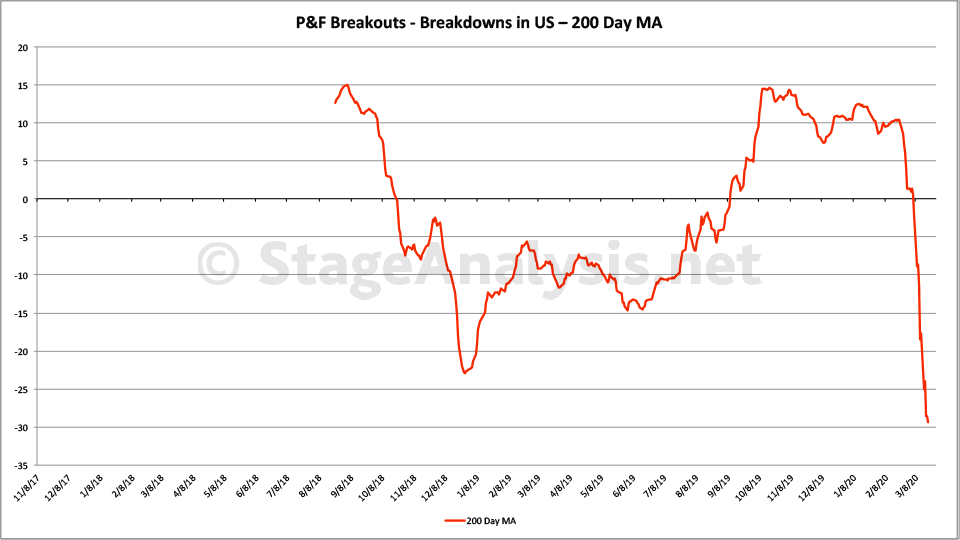
Above is the updated custom breadth charts that I do based on the daily point and figure double top breakouts and double bottom breakdowns.
Totals for the week:
+715 double top stock breakouts
-3251 double bottom stock breakdowns
-2536 net stock breakouts - stock breakdowns
Note: The breakdowns outweighed the breakouts by 4.5 times. With more than half the entire US stock market breaking down again this week. Taking the cumulative daily point and figure double top breakouts minus the double bottom breakdowns charts to new lows.
Final Thoughts
There wasn't much in the way of positive breadth this week. So the Weight of Evidence remains negative for another week for stocks.
The contrarians among you may find the lack of any positives, a positive sign in itself. But I prefer to take a methodical risk first, rules based approach, combining Stan Weinstein's method and the Weight of Evidence from the various breadth charts that I follow, and so I will only start to get back into stocks once a few of the short term breadth indicators move back to buy signals. But for the time being they all remain on risk off signals. So, I'll continue to watch and wait for now. Although I am still holding my physical precious metals positions, with 56% of my portfolio mostly in spot gold. And the rest in cash. So I am down -9.45% since the start of the year now, as gold has been hit hard over the last two weeks. So I'll continue to review on a weekly basis to see whether I should continue to hold or not.
Disclaimer: For educational purpose only. Not investment advice. Seek professional advice from a financial advisor before making any investing decisions.