
US Stock Market Breadth – Quickest 10% Decline From an All-Time High in History
This weeks moves in US stock market indexes and individual stocks confirmed what the market breadth indicators have been warning over the last month (see the recent youtube videos at https://www.youtube.com/c/StageAnalysis). However, the pullback has been much sharper than anyone could have predicted and so it looks like we've put in at least a medium term top imo, and not just a short term top, as there was a huge amount of technical damage done to the stock market indexes and individual stock charts, with almost half of the market having a breakdown of some kind this week. With stocks moving from Stage 2 straight into Stage 4. As many had closes well below their 30 week and 200 day MAs, and wiped out around half a years worth of gains or more.
So the question is, are we in for more selling, with a potential 1987 panic selloff after such dramatic falls in record time from the highs. Or are we near to a short term low that could produce a sharp bounce back in the stock market?
Lets start by looking through the individual US Stock Index charts:
S&P 500, Nasdaq 100, Dow Jones Industrial Average, S&P 600 Small Caps, NYSE, Nasdaq Composite
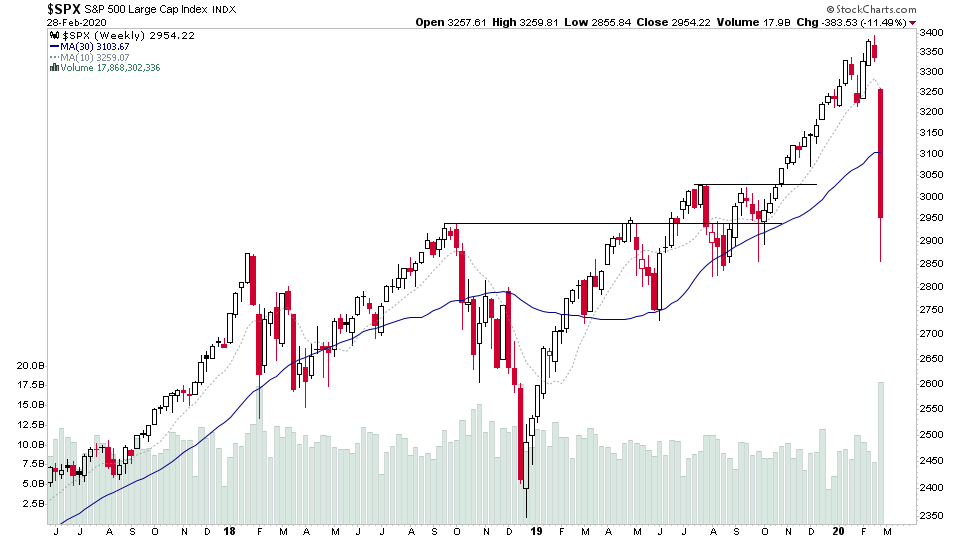
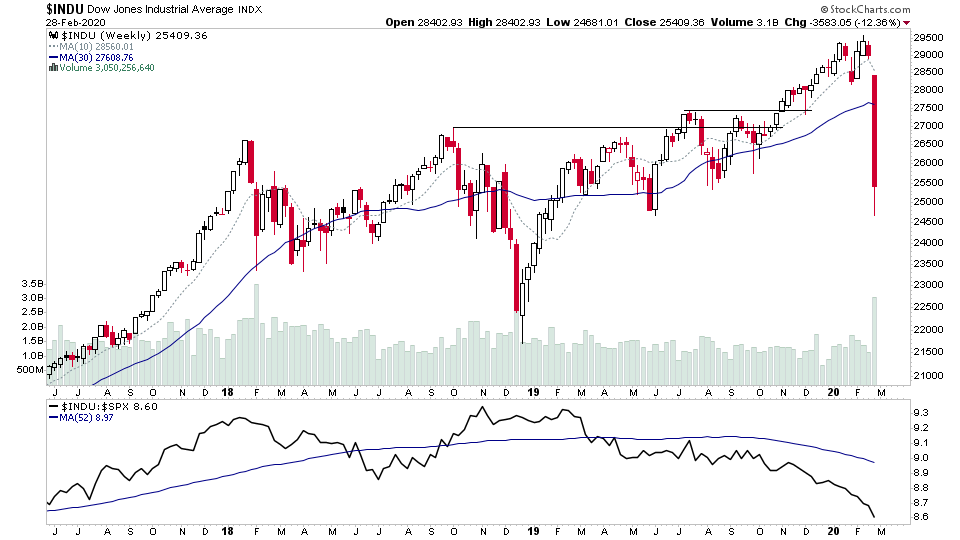
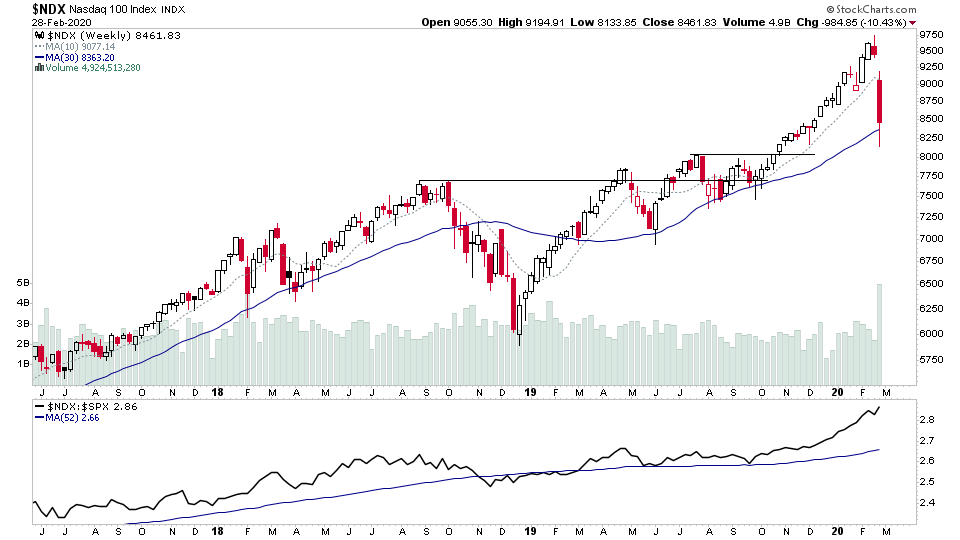

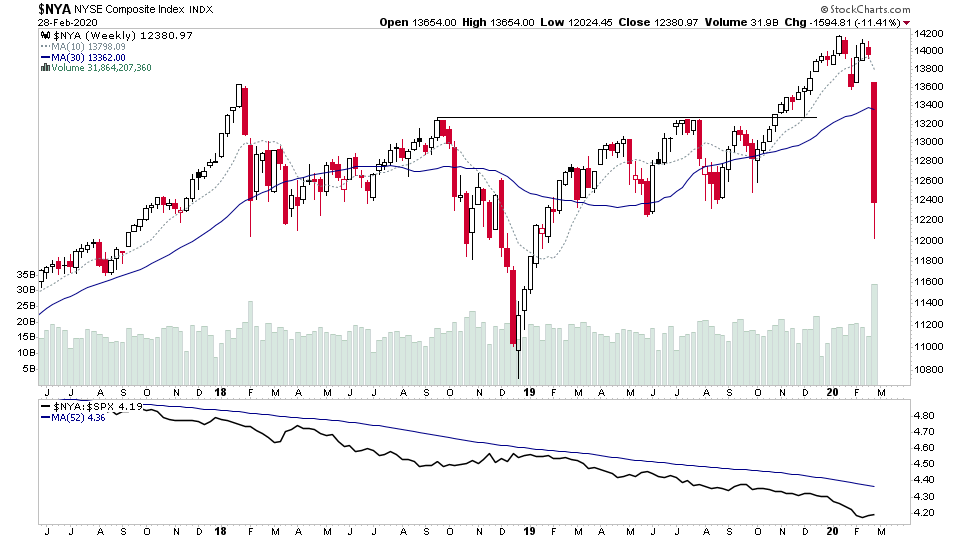
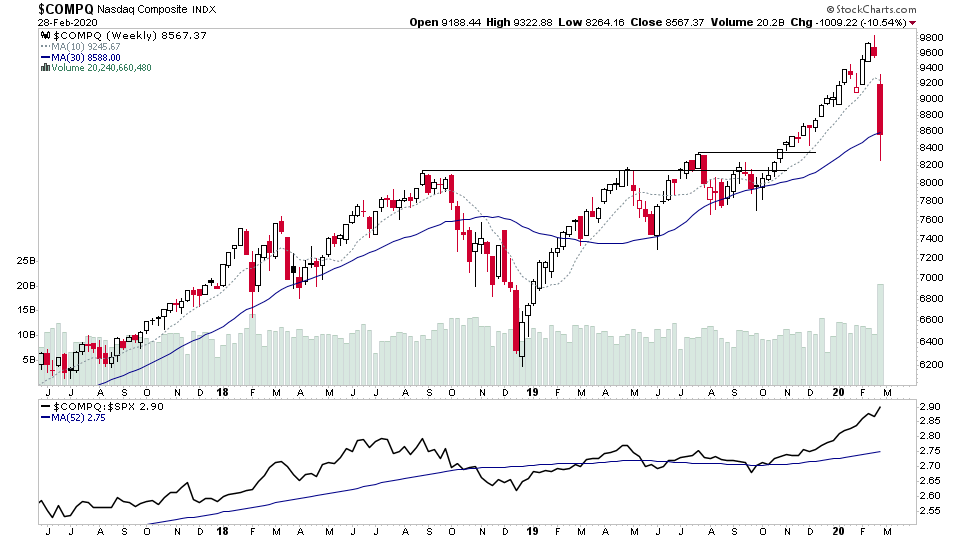
All the major indexes had declines of more than -10%, with only the Nasdaq 100 holding onto its Stage 2, with a slight close above the 30 week MA. However, others such as the benchmark S&P 500 knifed through its 30 week MA, and even closed a fair bit below its 200 day MA and so has bypassed the normal orderly Stage 3 topping phase, and moved directly into Stage 4. The DOW and the S&P 600 Small Caps took some of the worst technical damage, and are now further below their 30 week MA than they were when they were near their highs.
NYSE & Nasdaq Bullish Percent Index and Moving Average Breadth Indicators
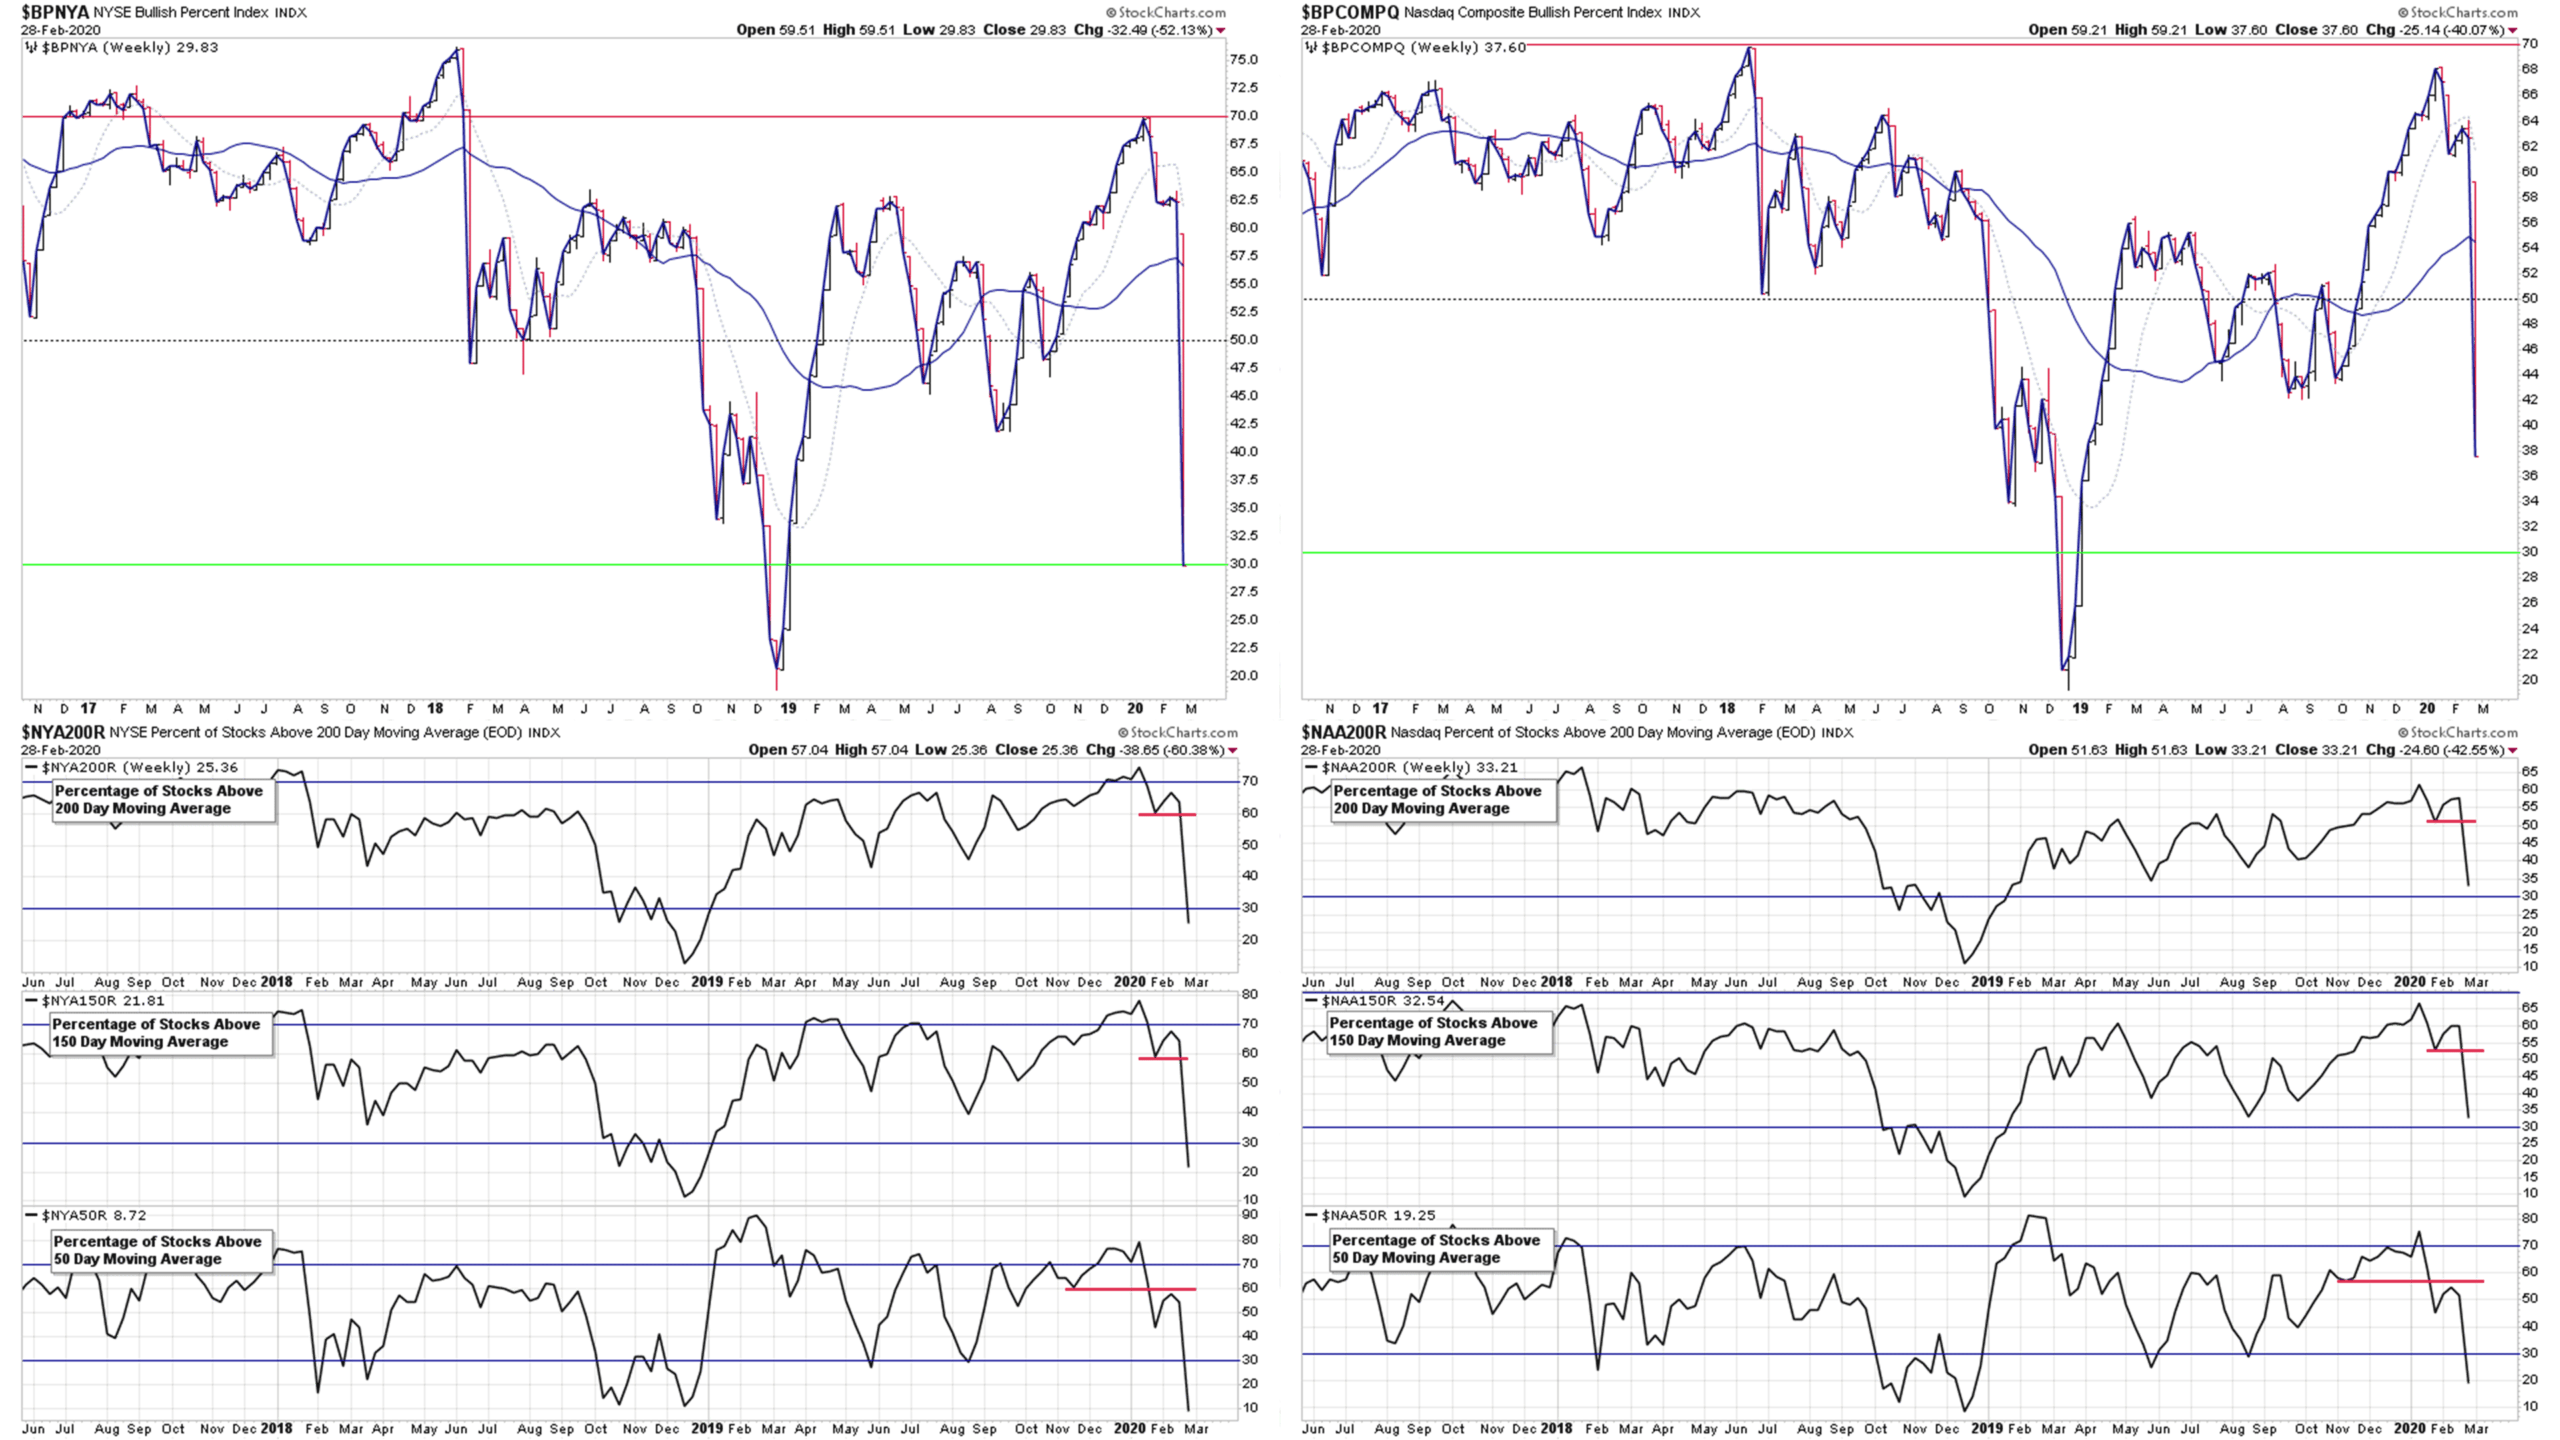
Above is the NYSE Bullish Percent Index and the Nasdaq Bullish Percent Index with the 200 day, 150 day and 50 day Moving Average Breadth Indicators below it. The Moving Average Breadth Indicators are used for market timing, with the 50 day being used for short term signals, the 150 day for medium term signals and the 200 day for long term signals.
The major signals are when all three are giving the same signal, and moving up or down from one of the extremes. So for example, if all three have gone to sell signals from being above the key 70% level for a long period. Then that's something significant to take note of. And likewise, if all three have traded below the key 30% level for a period, and then move to buy signals and break out back above the 30% level and their recent highs - then that also is a time to take action.
So where are we currently?
The medium and long term Moving Average Breadth Indicators all moved to sell signals over the last week to join the short term, which moved to a sell signal in January. So, all three are now on a Bear Confirmed status, and have moved rapidly to the lower zone below 30%.
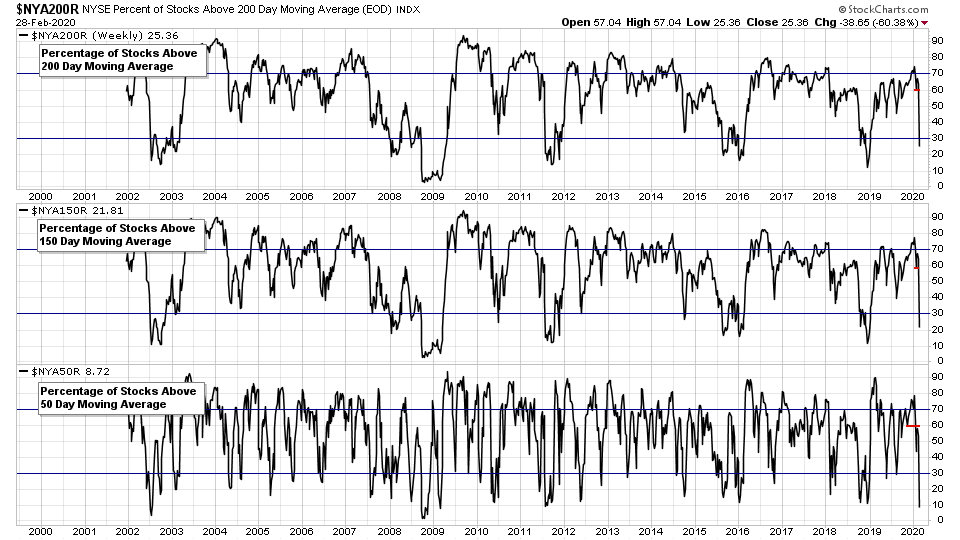
So we are now into the lower zone, with the short term readings at extremes only seen a near lows. So the odds of a short term bounce in the next week seems probable. However, the medium and long term have only just moved below the 30% level, and history shows us (see the 20 year chart above) that it can take a few months at least until we see the ultimate low if this is just a pullback, and all move back to buy signals. So it's something I'm going to be keeping a close eye on
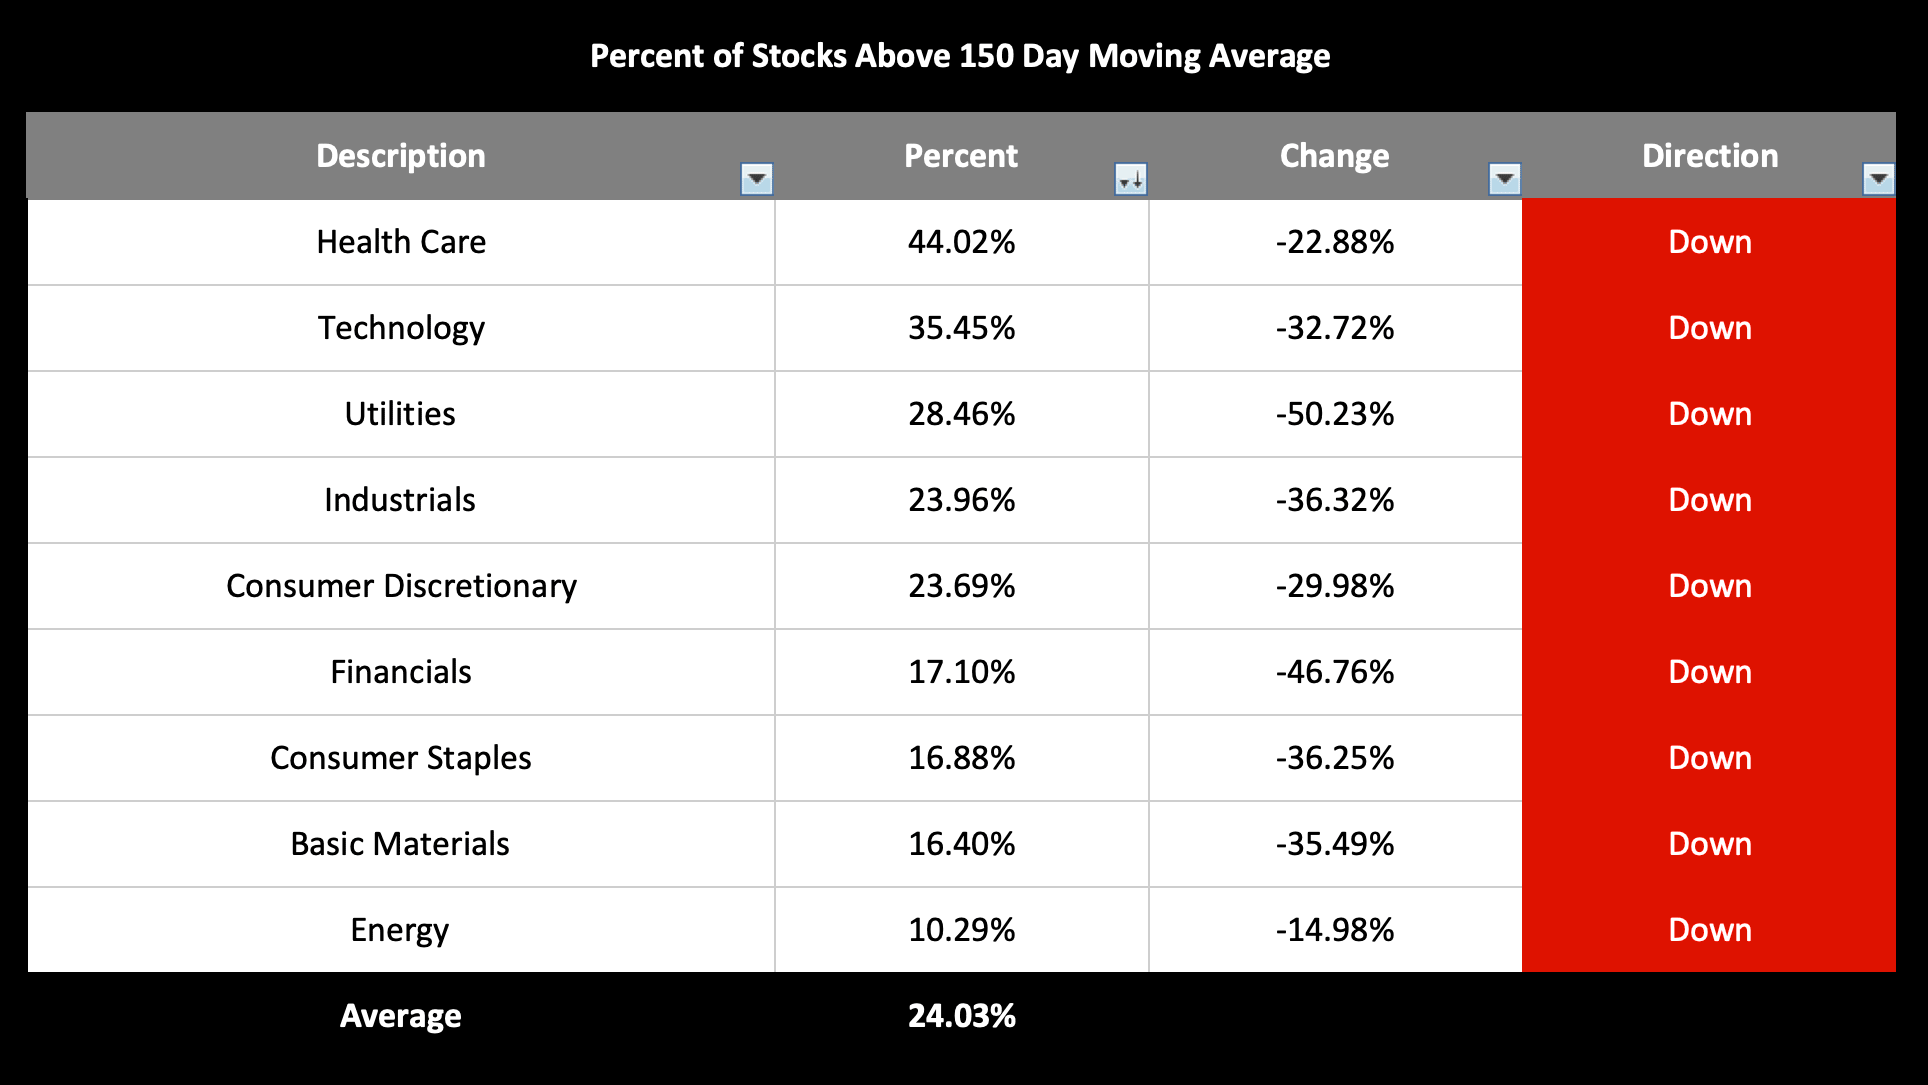
Sector Breadth – Percentage of Stocks Above Their 150 Day Moving Average
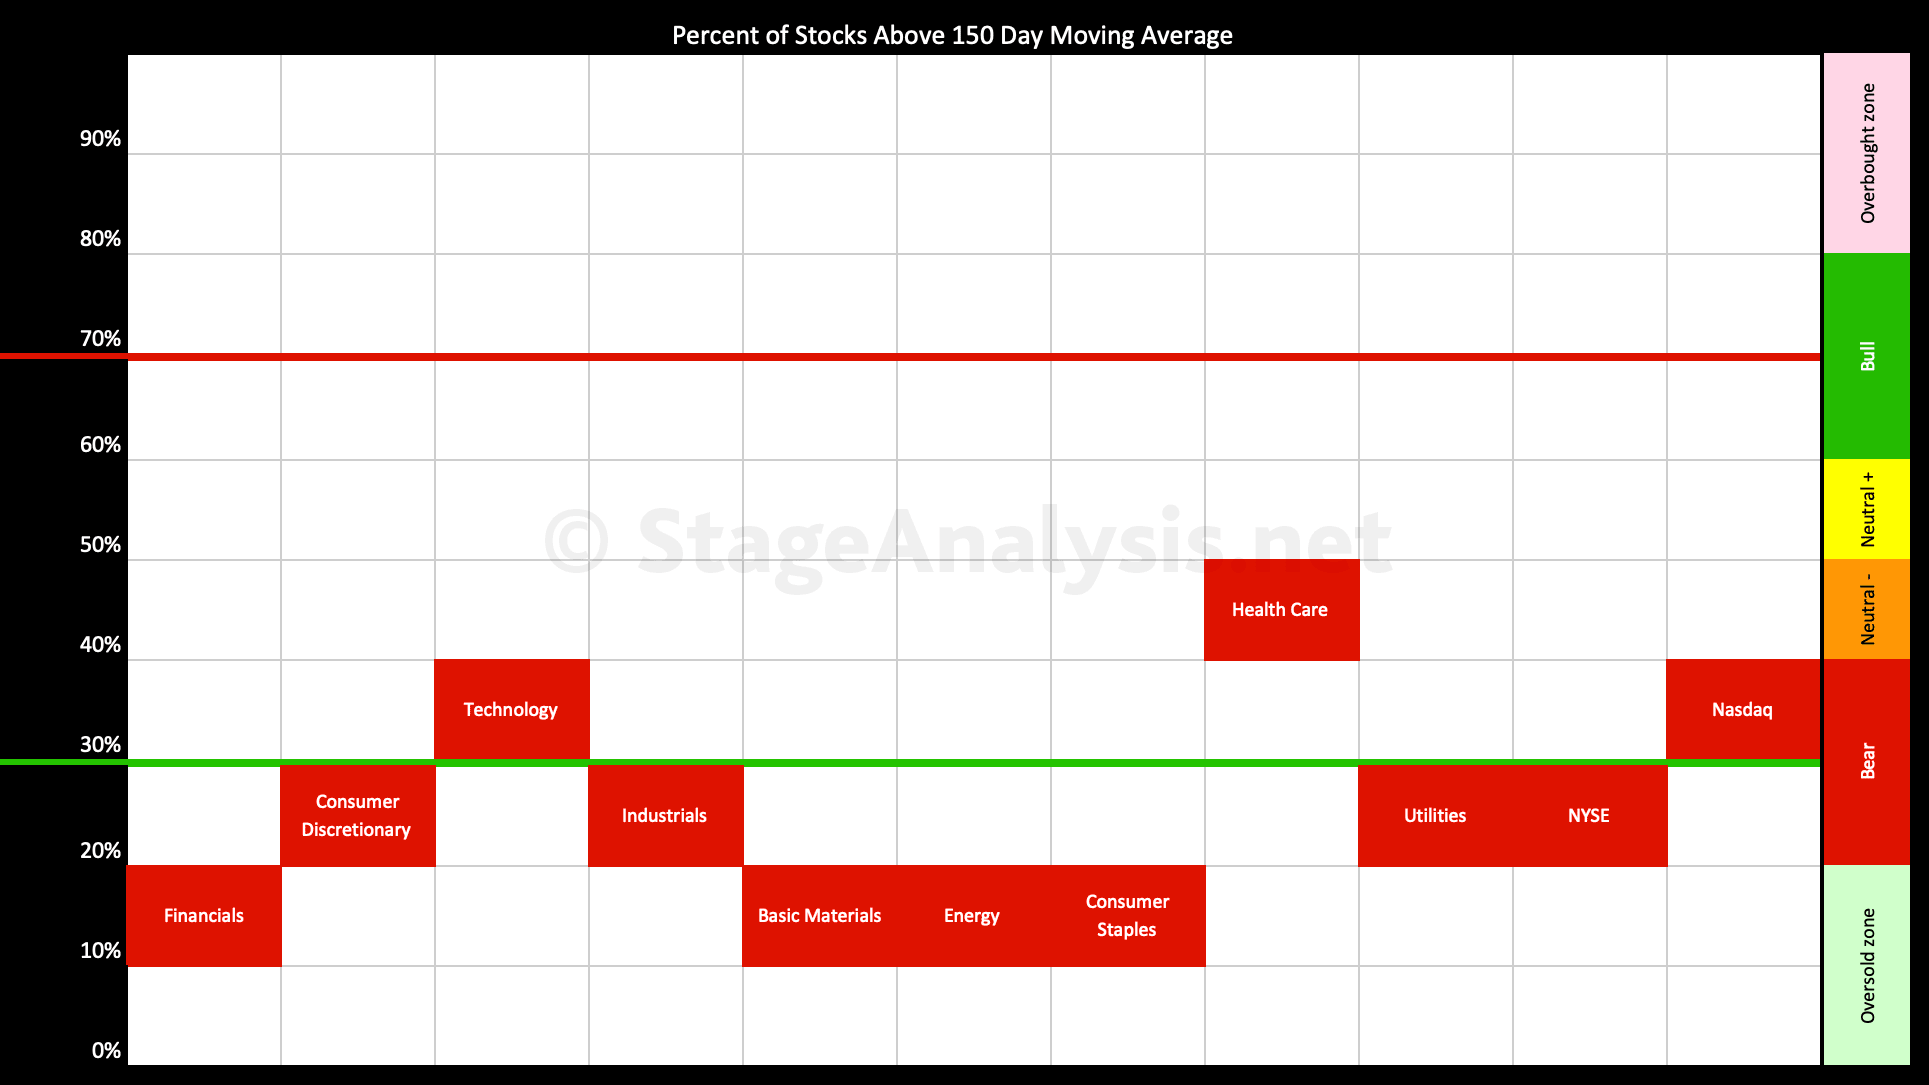
The Sector Average is at 24.03% currently and declined -33.96% since last week with Utilities (-50.23%) and Financials (-46.76%) having the largest hits this week. Although all sectors were punished severely. Below is the sector breadth table ordered by relative strength.
NYSE Advance Decline Line Indicators
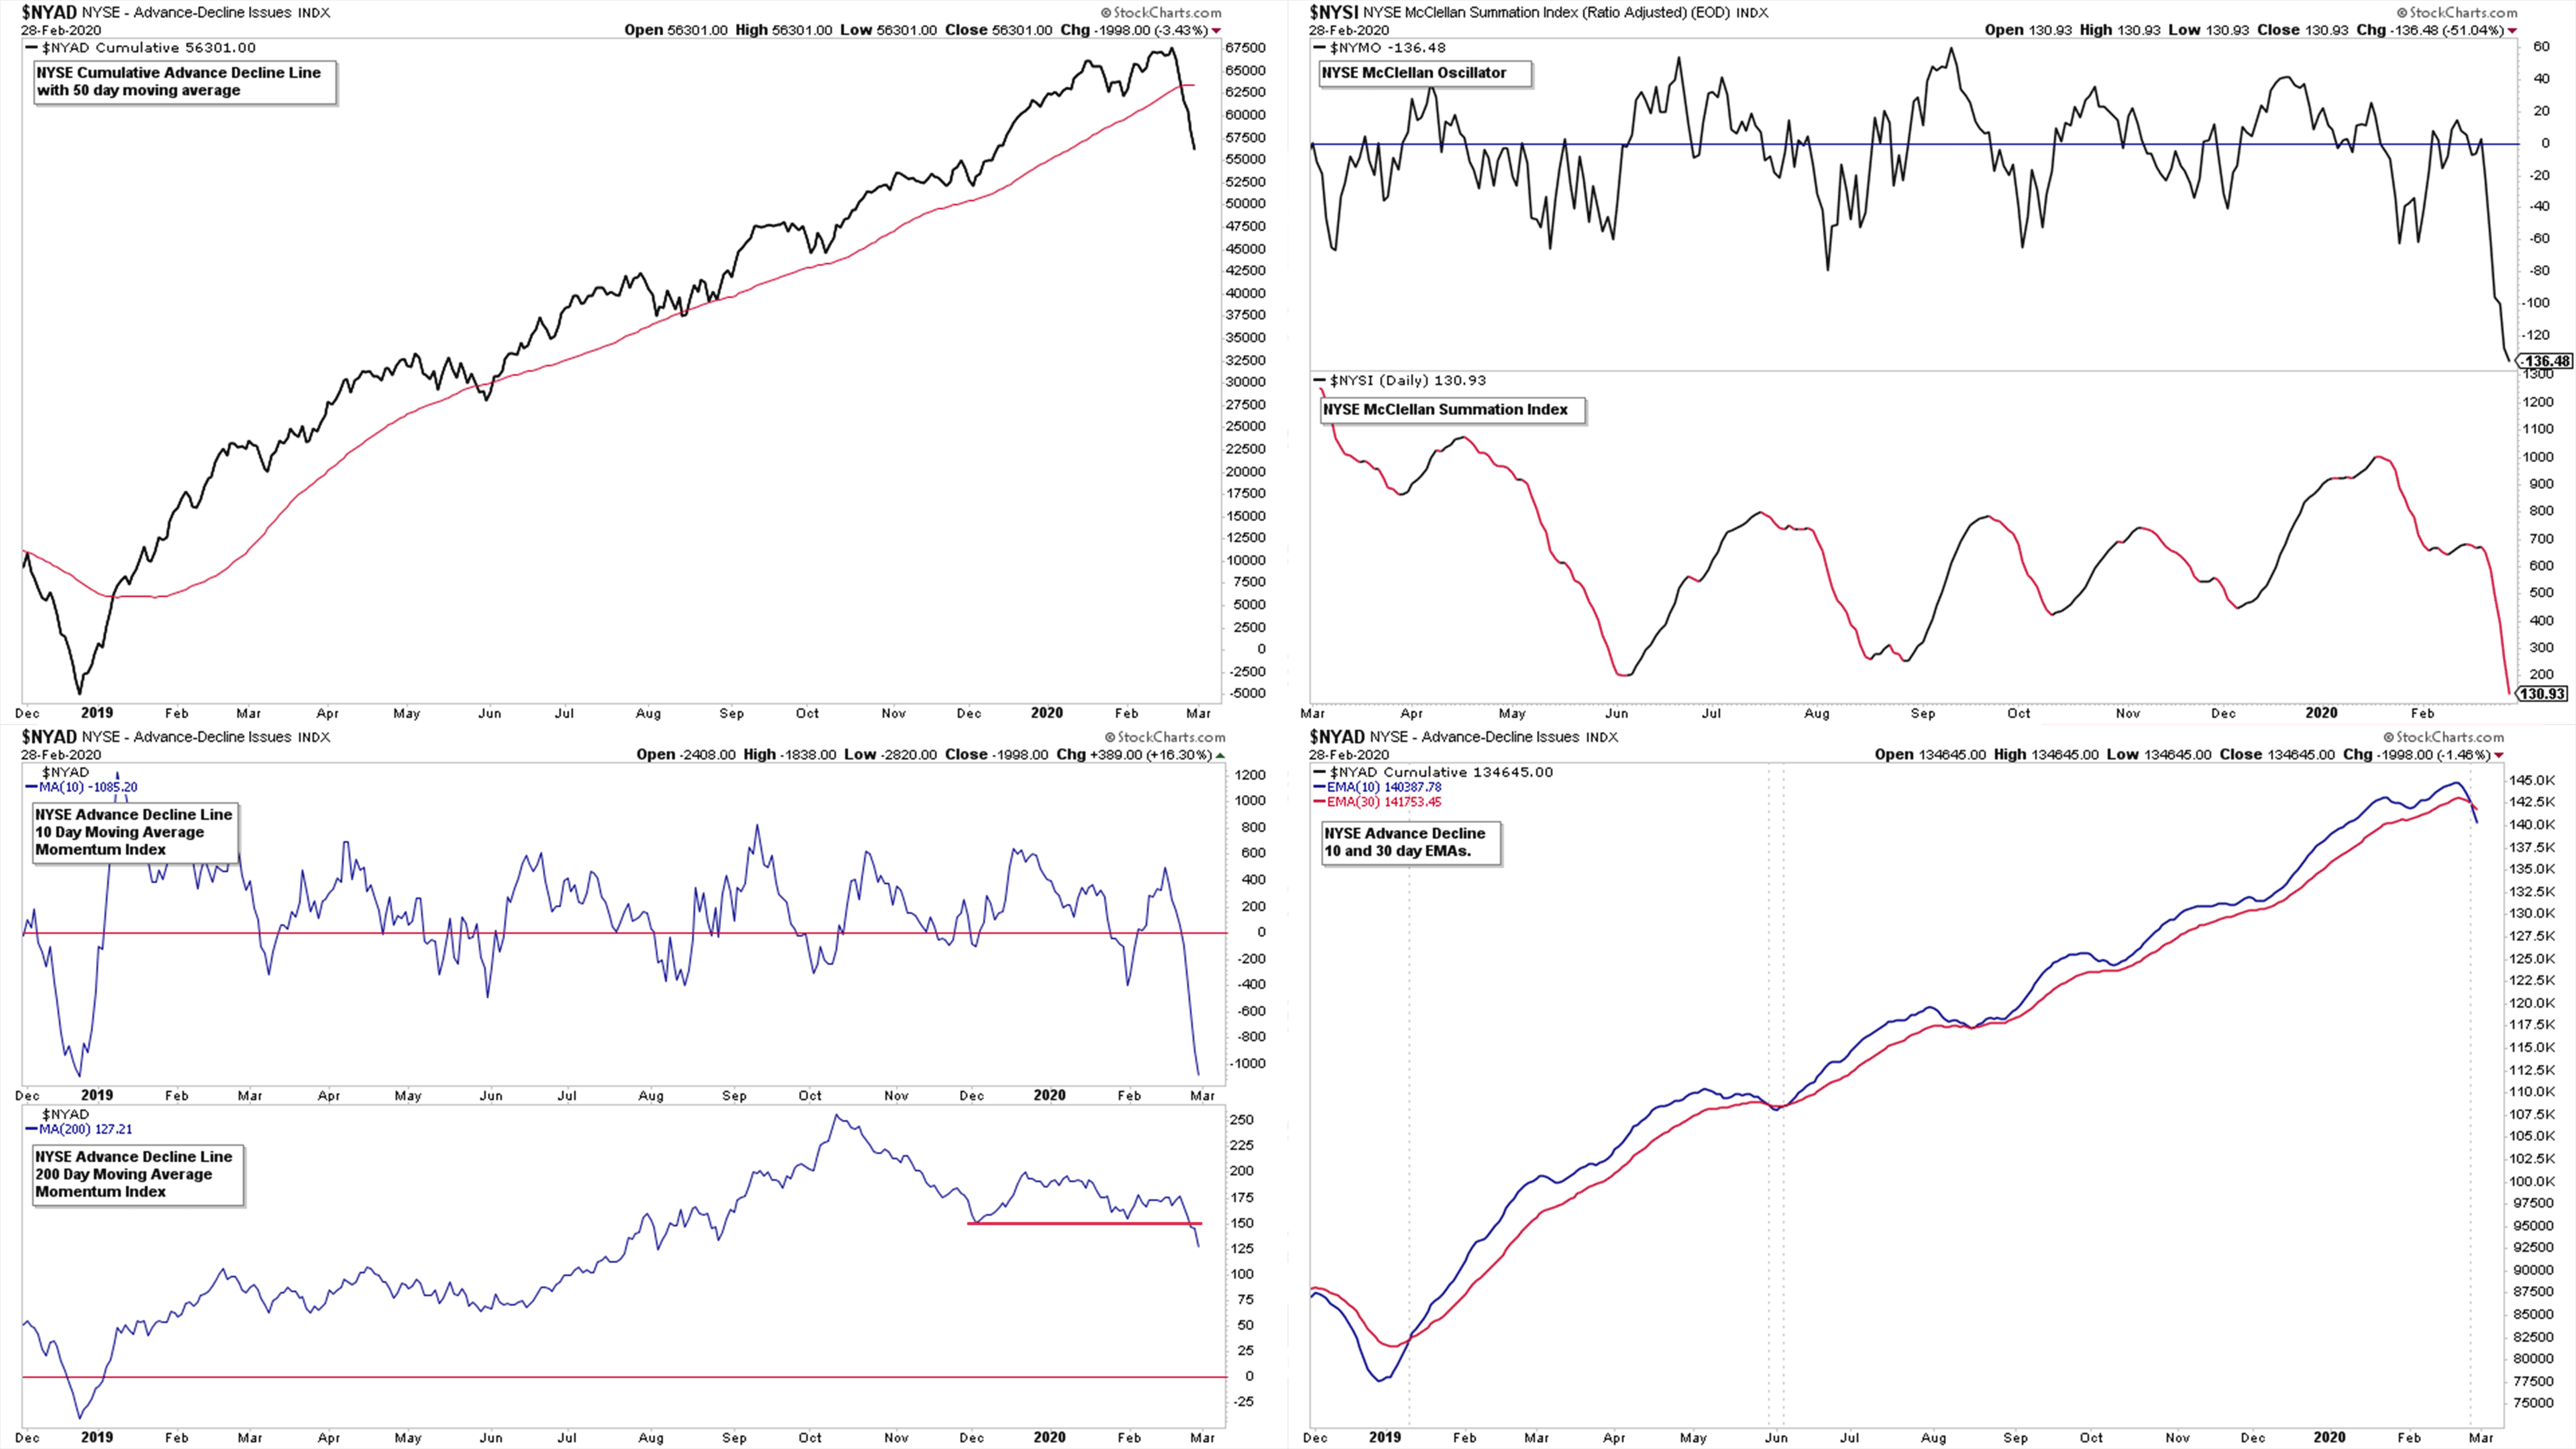
The NSYE Advance Decline Line Indicators also all moved to sell signals over the last week. Which won't be a surprise considering the stock market price action, but as I noted in the youtube videos over the last month. There have been some warning signs appearing as the market moved higher, as the momentum index was approaching a major breakdown level as the stock market hit new highs. And the McClellan Oscillator and McClellan Summation Index were also showing weakness relative to the market, which was highlighted multiple times.
US New Highs New Lows
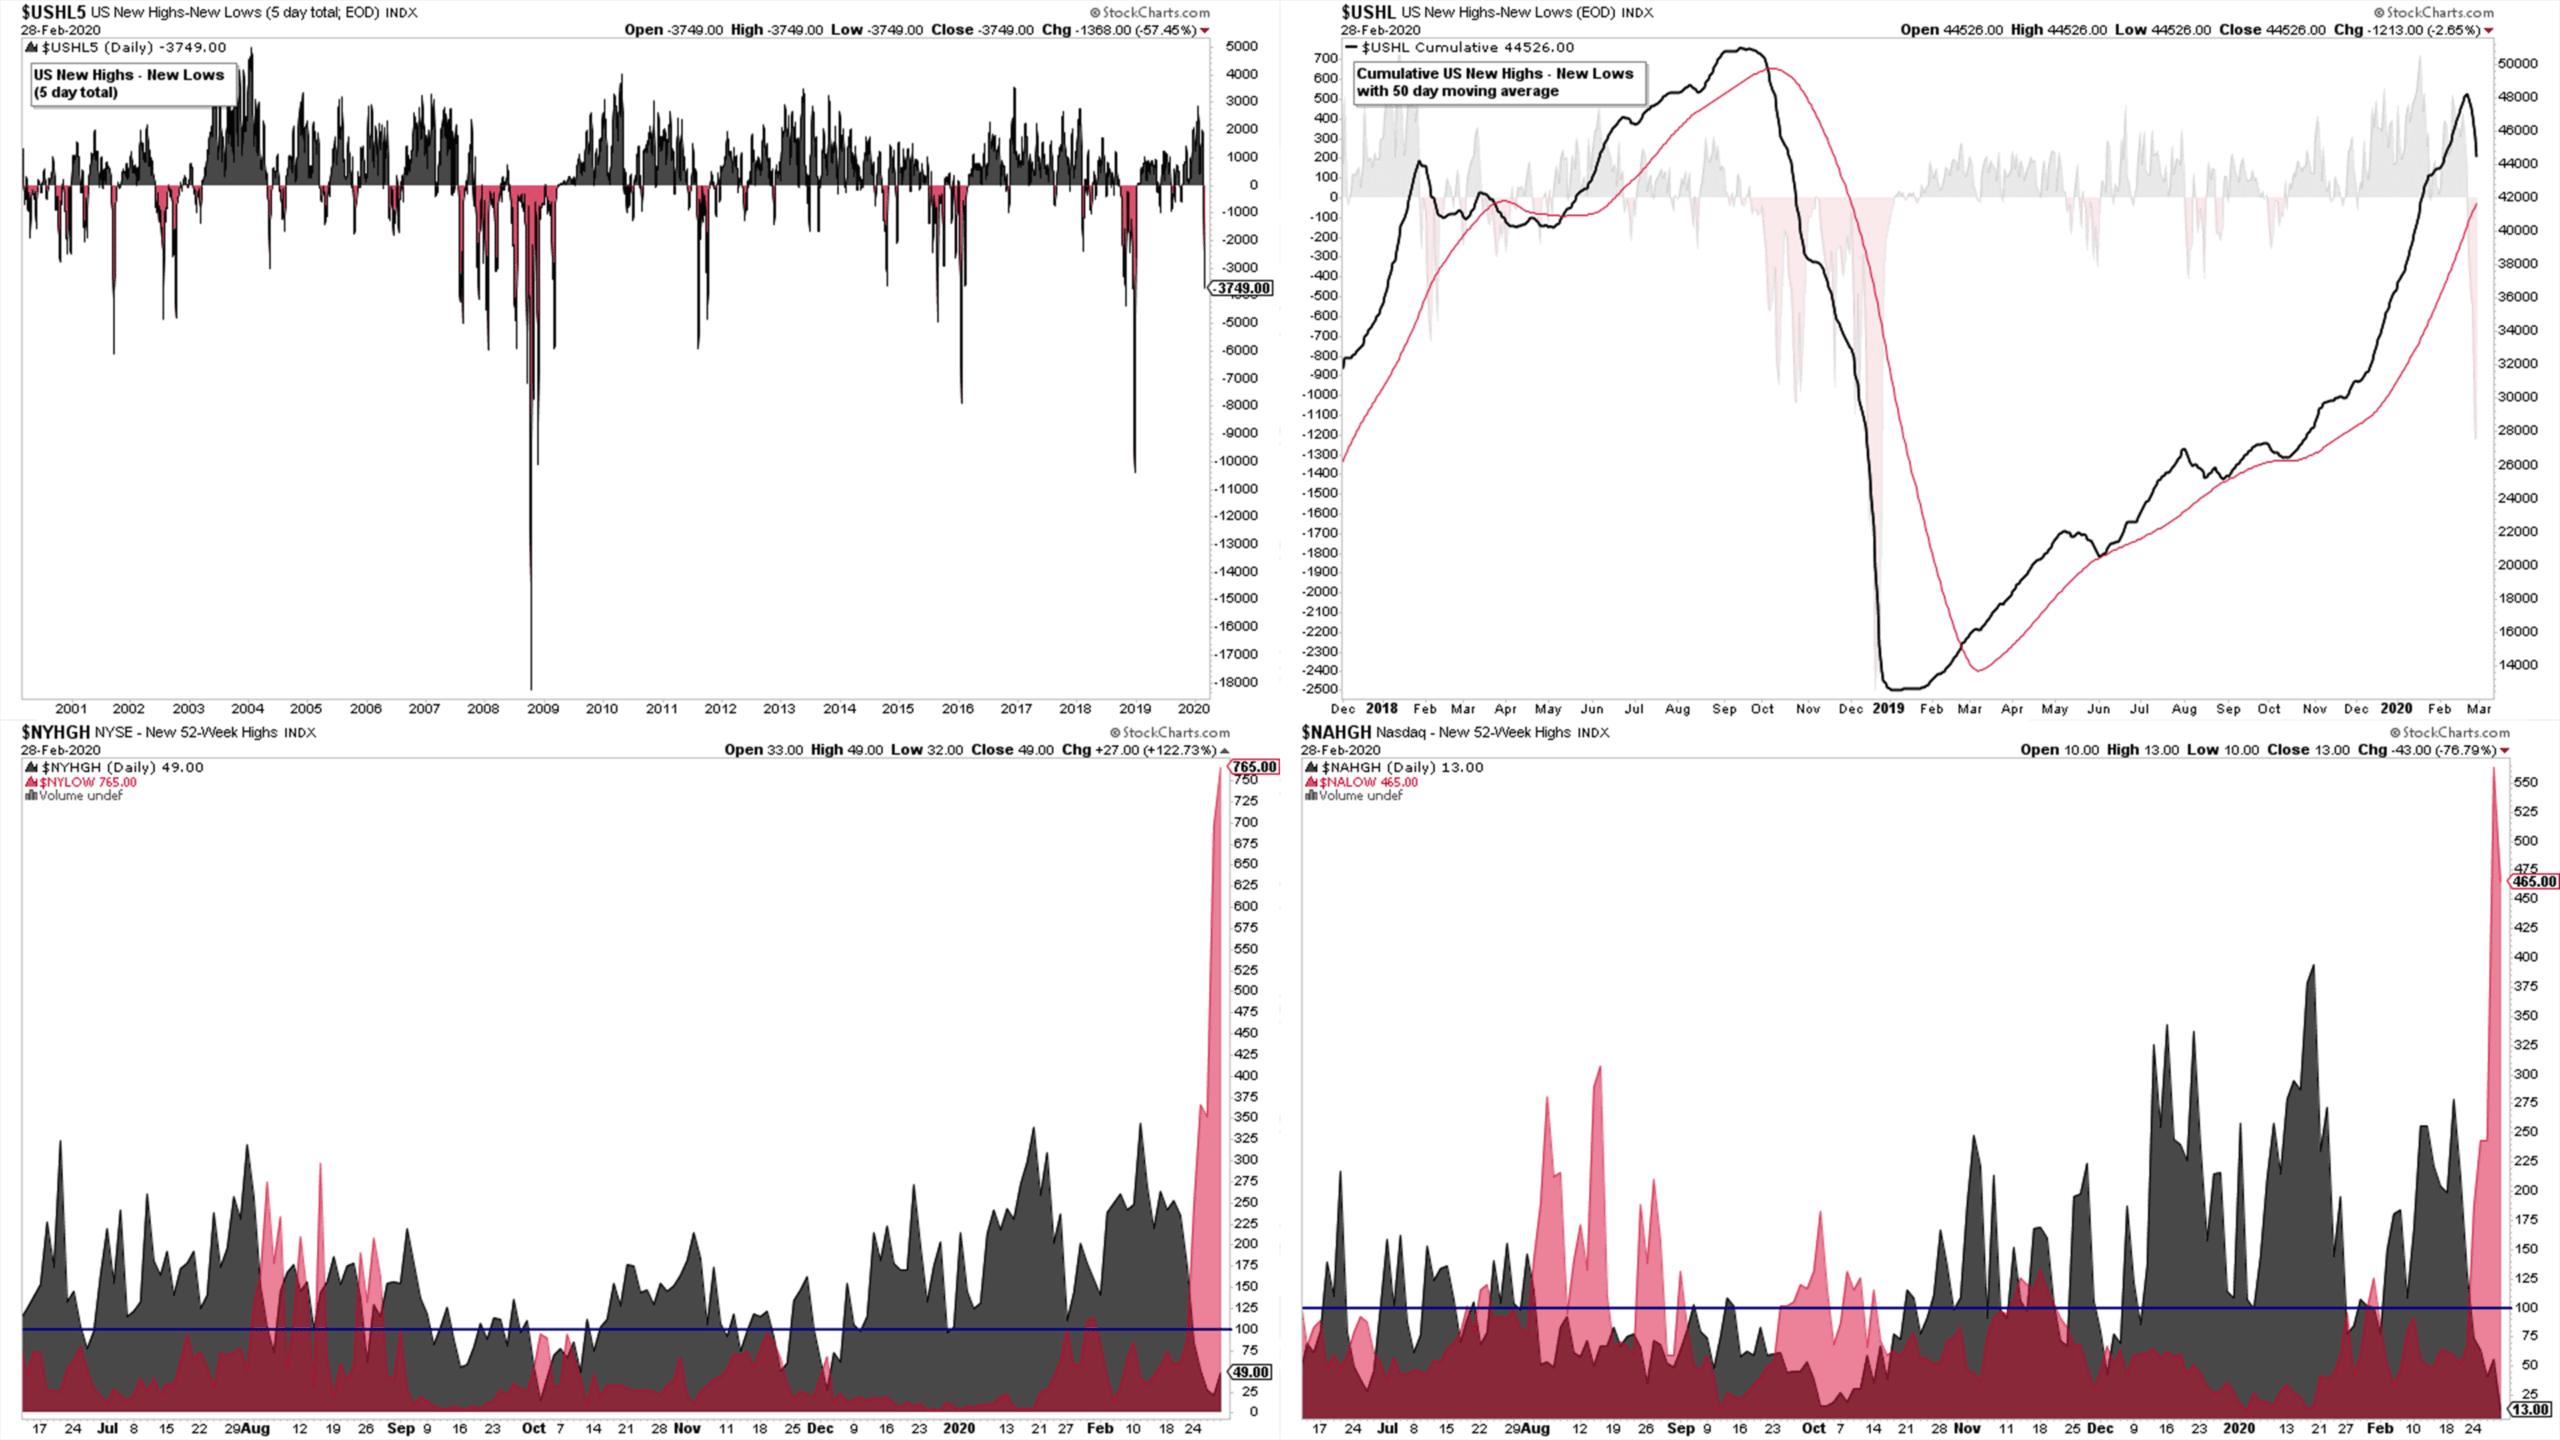
The new lows surged this week, hitting levels not seen since the 2018 Stage 4 decline in the stock market. Friday was the peak in the NYSE with 765 new lows for the day, whereas the Nasdaq had 465. I've included the 20 year chart for the US New Highs - New Lows 5 day total to give a bit of perspective. As although it was big move in a single week. As you can see above, it can get a lot worse if we have a sustained Stage 4 decline. And if you look at the cumulative chart in the top right, it's still above it's 50 day MA, after getting parabolic recently.
Cumulative Point and Figure Double Top Breakouts and Double Bottom Breakdowns
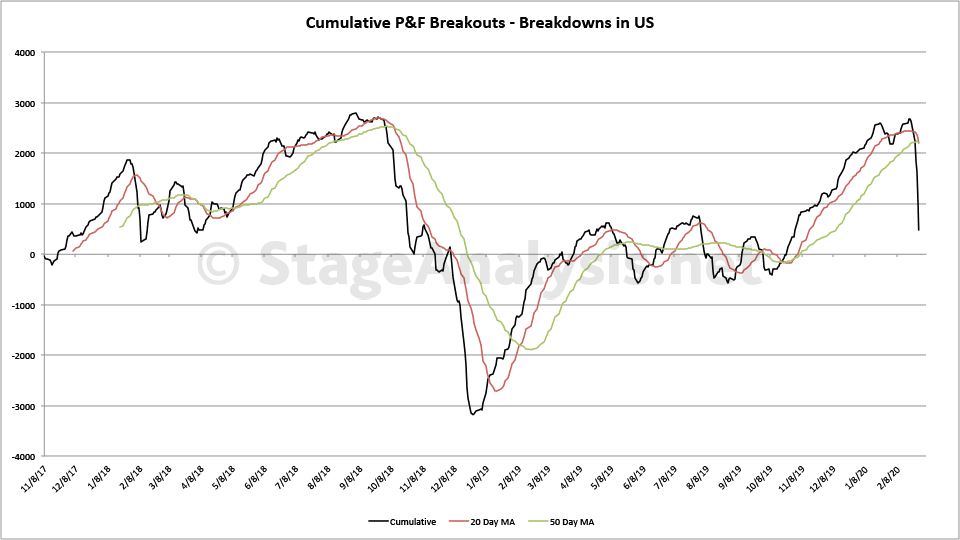
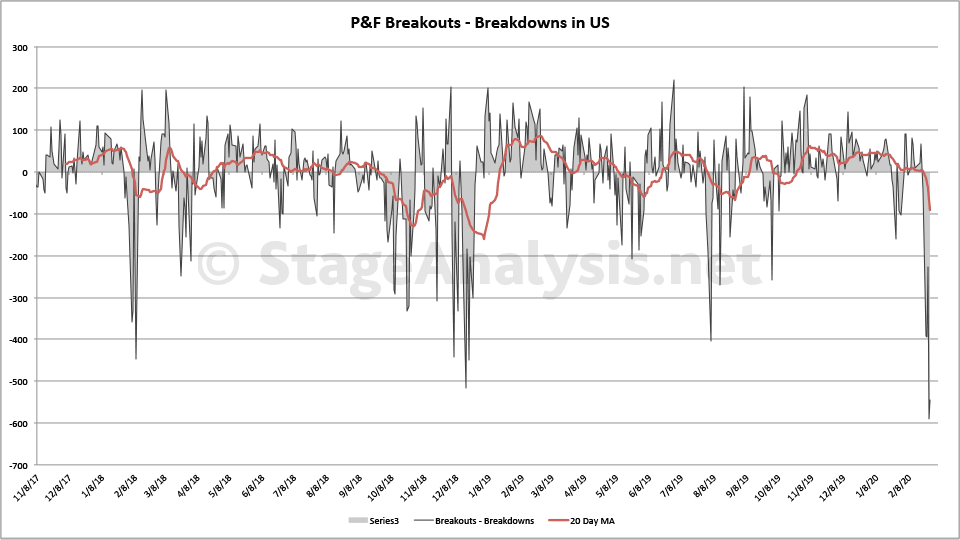
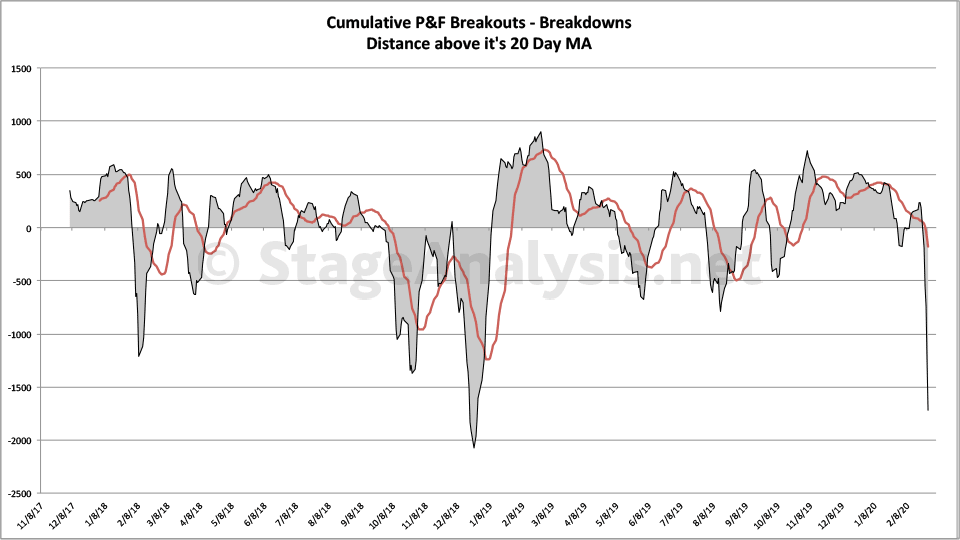
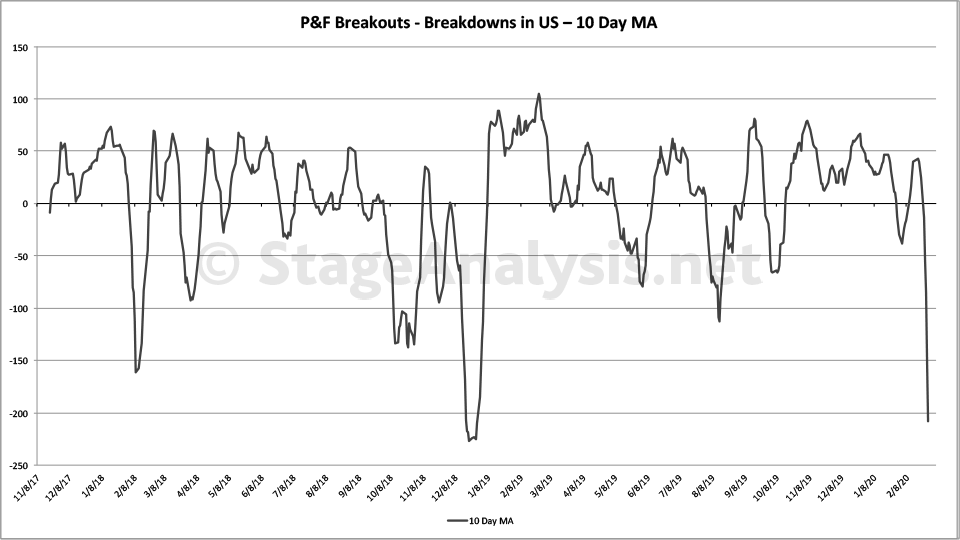
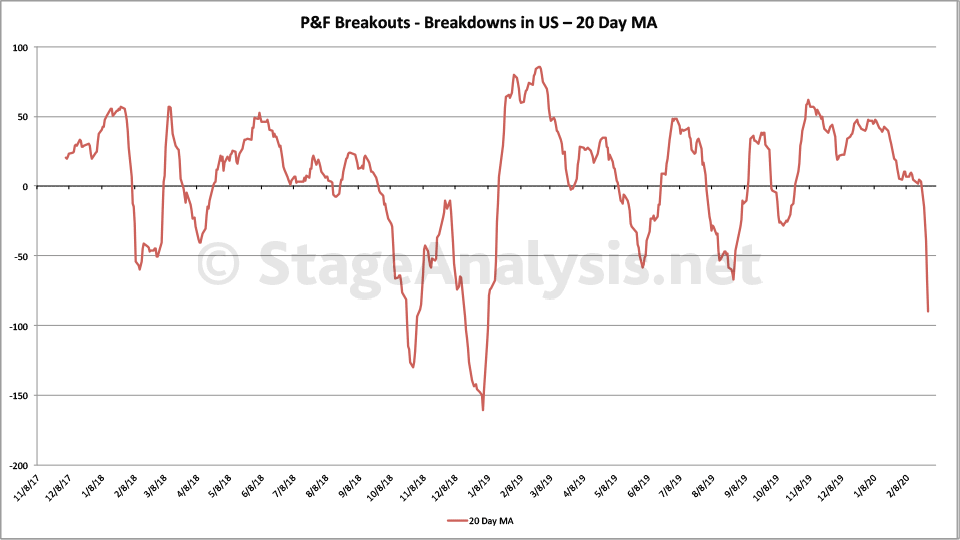
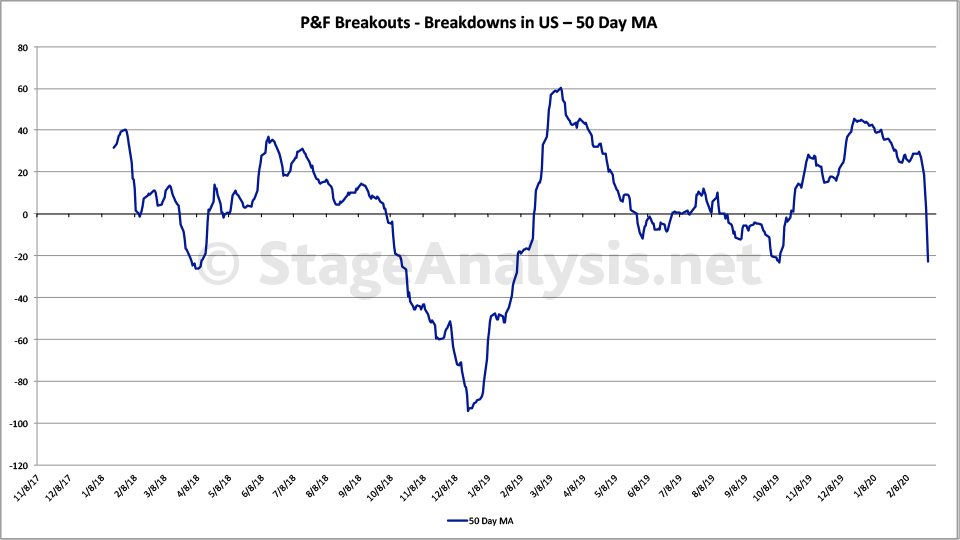
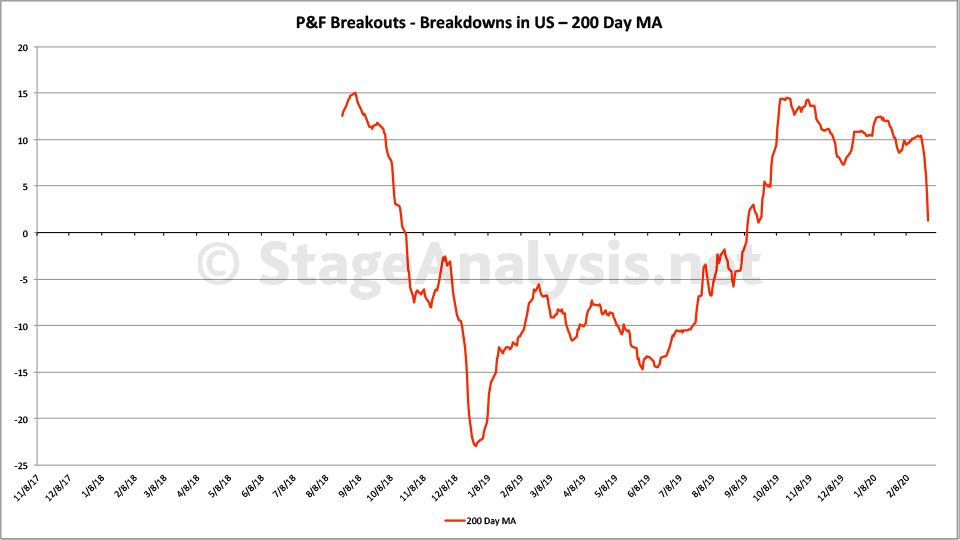
Above is the updated custom breadth charts that I do based on the daily point and figure double top breakouts and double bottom breakdowns.
Totals for the week:
+140 double top breakouts
-2288 double bottom breakdowns
-2148 net breakouts - breakdowns
As you can see, this week produced a record number of stock breakdowns in a single week, and we also saw the highest number of daily stock breakdowns since I've been recording these with -619 on Thursday.
US Treasuries, Gold, Crude Oil and Copper
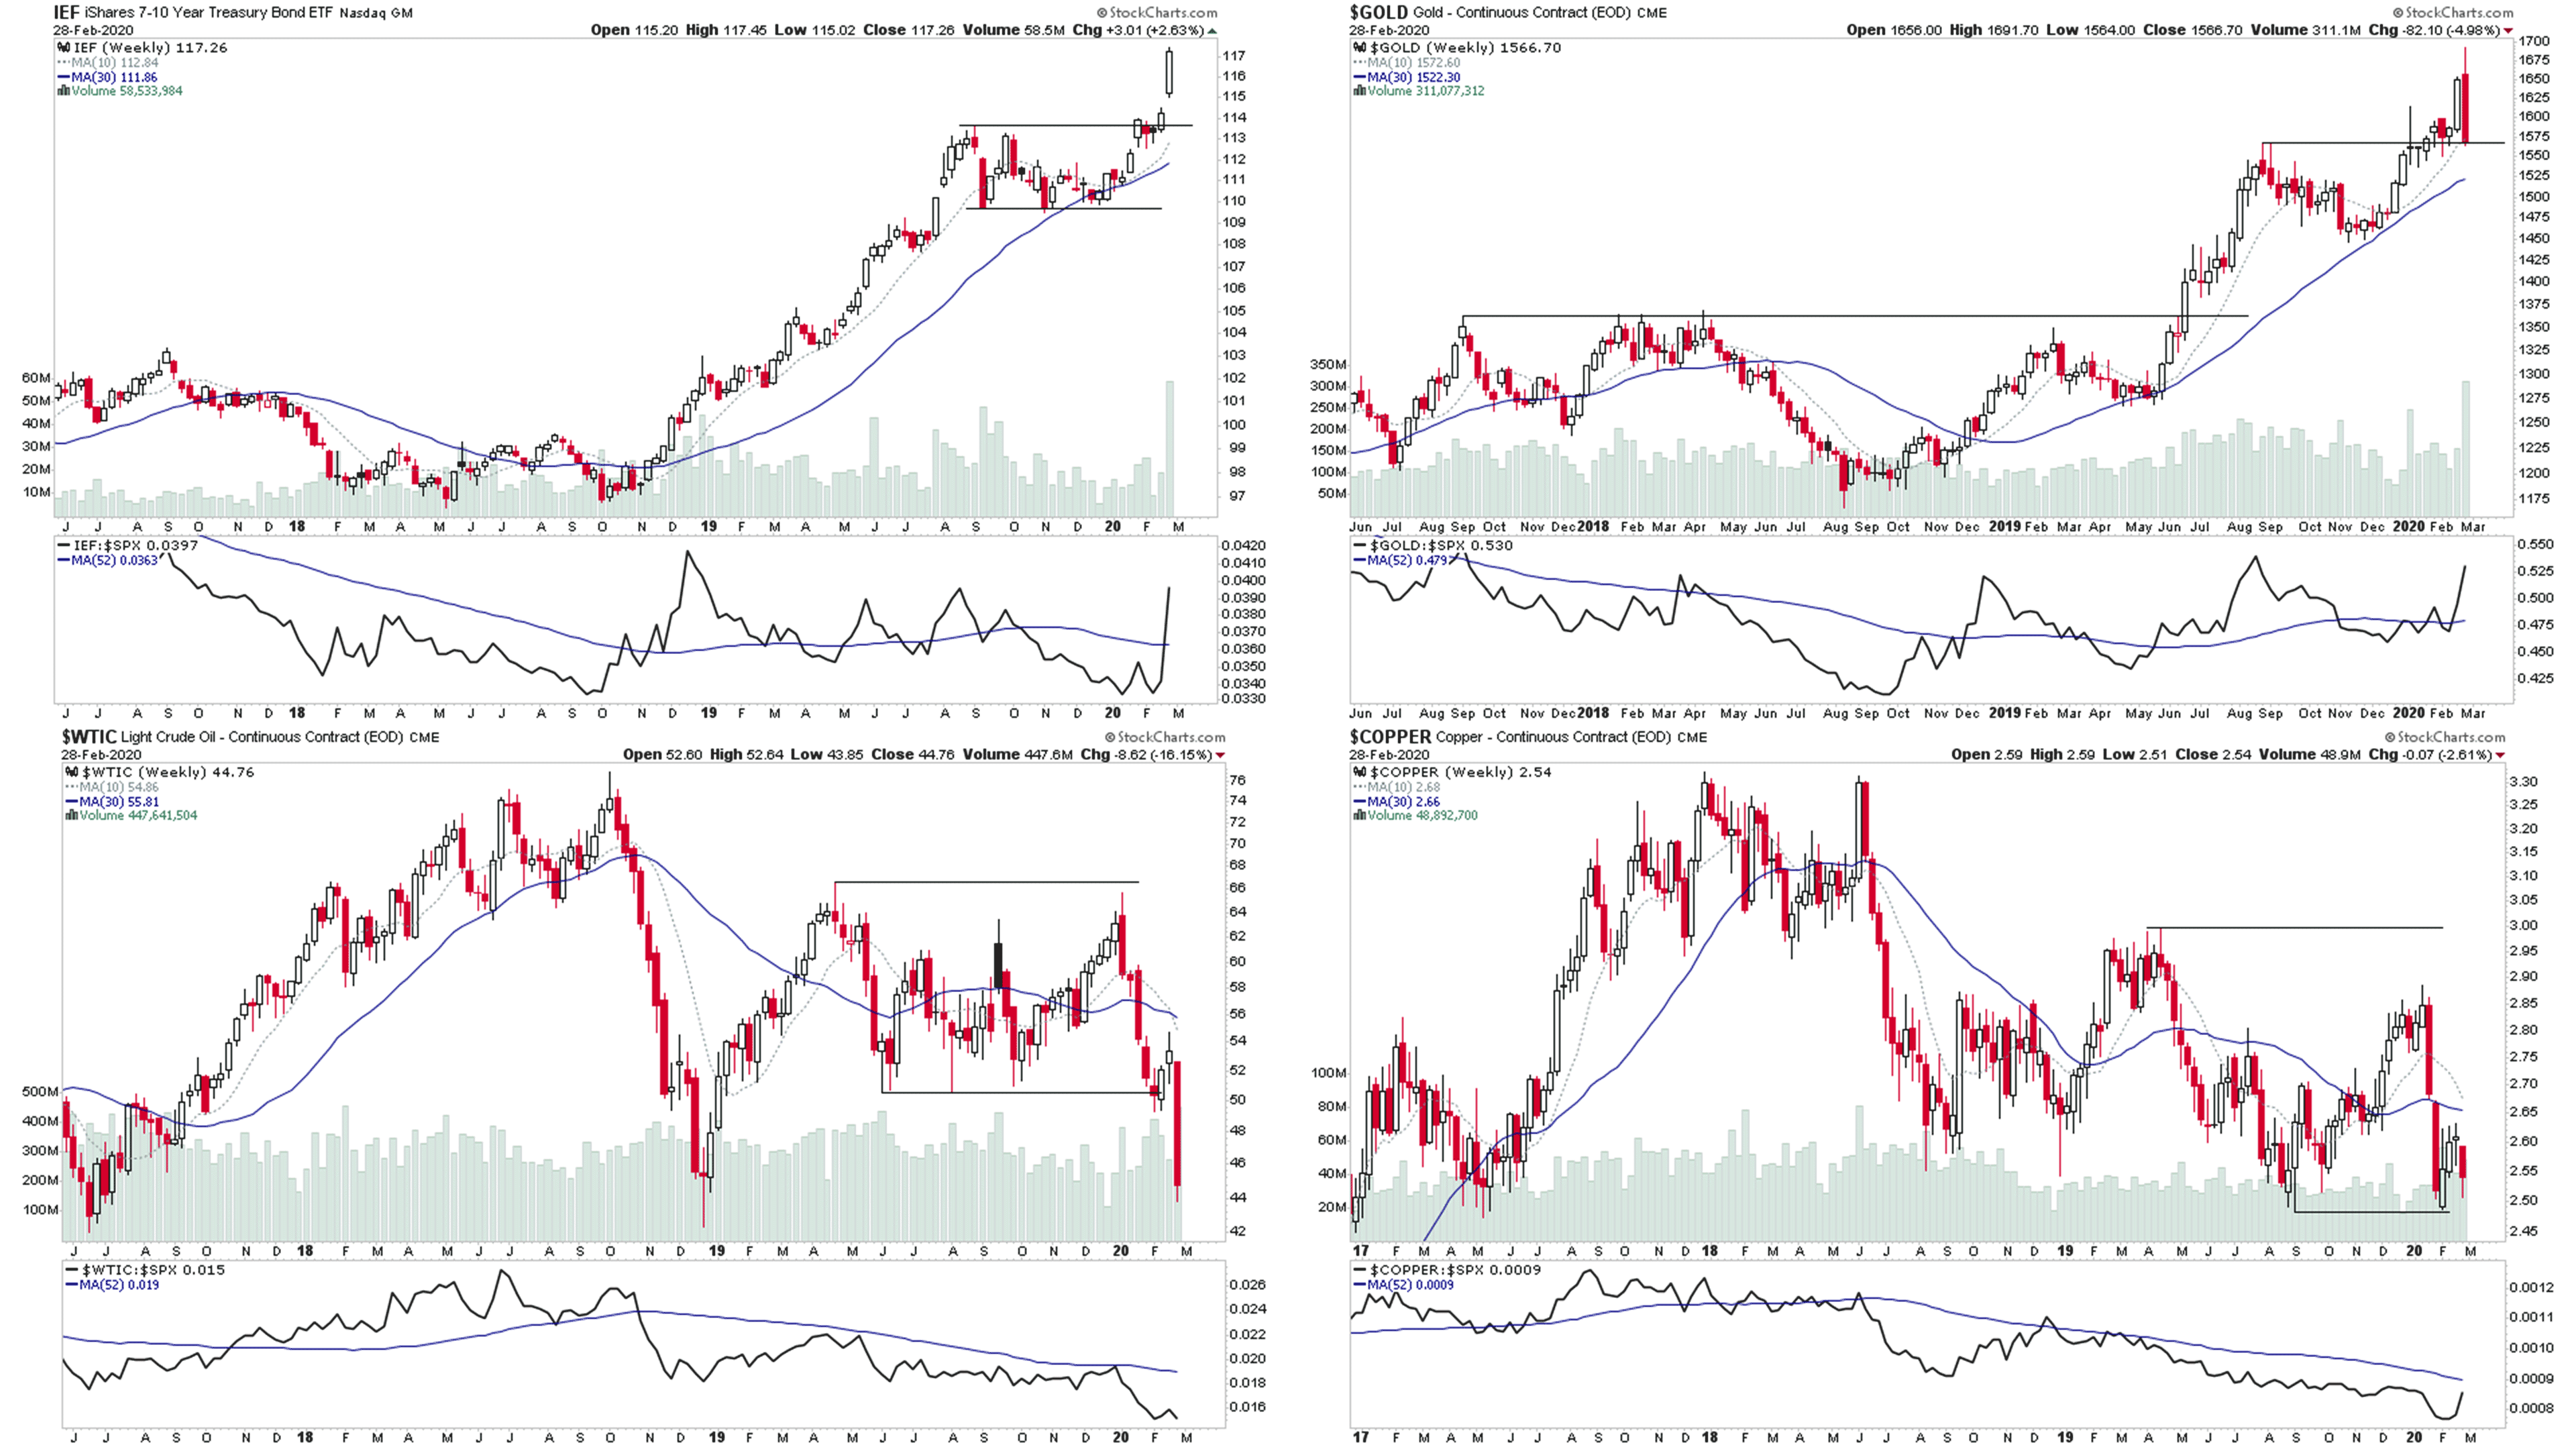
Lets round up the week with with a look at US Treasuries, Gold, Crude Oil and Copper charts.
US Treasuries was the only area of the market to get some love this week it seems, with the further continuation to new highs of its recent Stage 2 continuation breakout on stronger volume. Gold and precious metals on the other hand didn't fair so well, although it did a lot better than equities and only pulled back 5%, which imo could be due to margin calls in other areas like we've seen in past rapid declines in stocks. But it remains in Stage 2, back at the breakout level again.
Crude Oil made a Stage 4 breakdown below the 2019 Stage 1 base with a huge -16% sell off and now rapidly approaching the 2018 low.
Finally Copper showed some outperformance and only declined a few percent and remains near the lows of its Stage 1 range. So there is potential for a Stage 4 breakdown to be aware of.
Final thoughts
It's been a dramatic week in stock markets all around the world due to fears of the Coronavirus spreading and its economic impact also, due to knock effects from shutdowns in the supply chain from China and I'm sure many other factors. I'm sure people will have many reasons as to why we've had this dramatic drop, but the market breadth could have helped you to avoid the worst of it, as it had been giving warnings for the last few months, and so personally I had gotten out of stocks in early January and had started to build a position in precious metals (see my journal thread in the forum), and am at around 20% invested currently. So although the precious metals got hit too, I've only down -1.33% in my pension account since the start of the year, compared to the S&P 500 which is down -9.32%. Which puts me in a good position for when the market breadth starts to give some short term buy signals in the coming weeks or months.
So I hope you took the market breadth warning signs seriously too, and was using a defensive strategy that protected your account from the carnage this week. But if not, make sure that you learn from this event, as successful trading over the long term requires proper risk management techniques. And the Weight of Evidence from the key Market Breadth indicators helps you to know what strategy that you should be using at what time, and so helps you to make the right decisions to protect your account.
Disclaimer: For educational purpose only. Not investment advice. Seek professional advice from a financial advisor before making any investing decisions.