
Market Breadth: Percentage of Stocks Above their 50 Day, 150 Day & 200 Day Moving Averages Combined
The full post is available to view by members only. For immediate access:
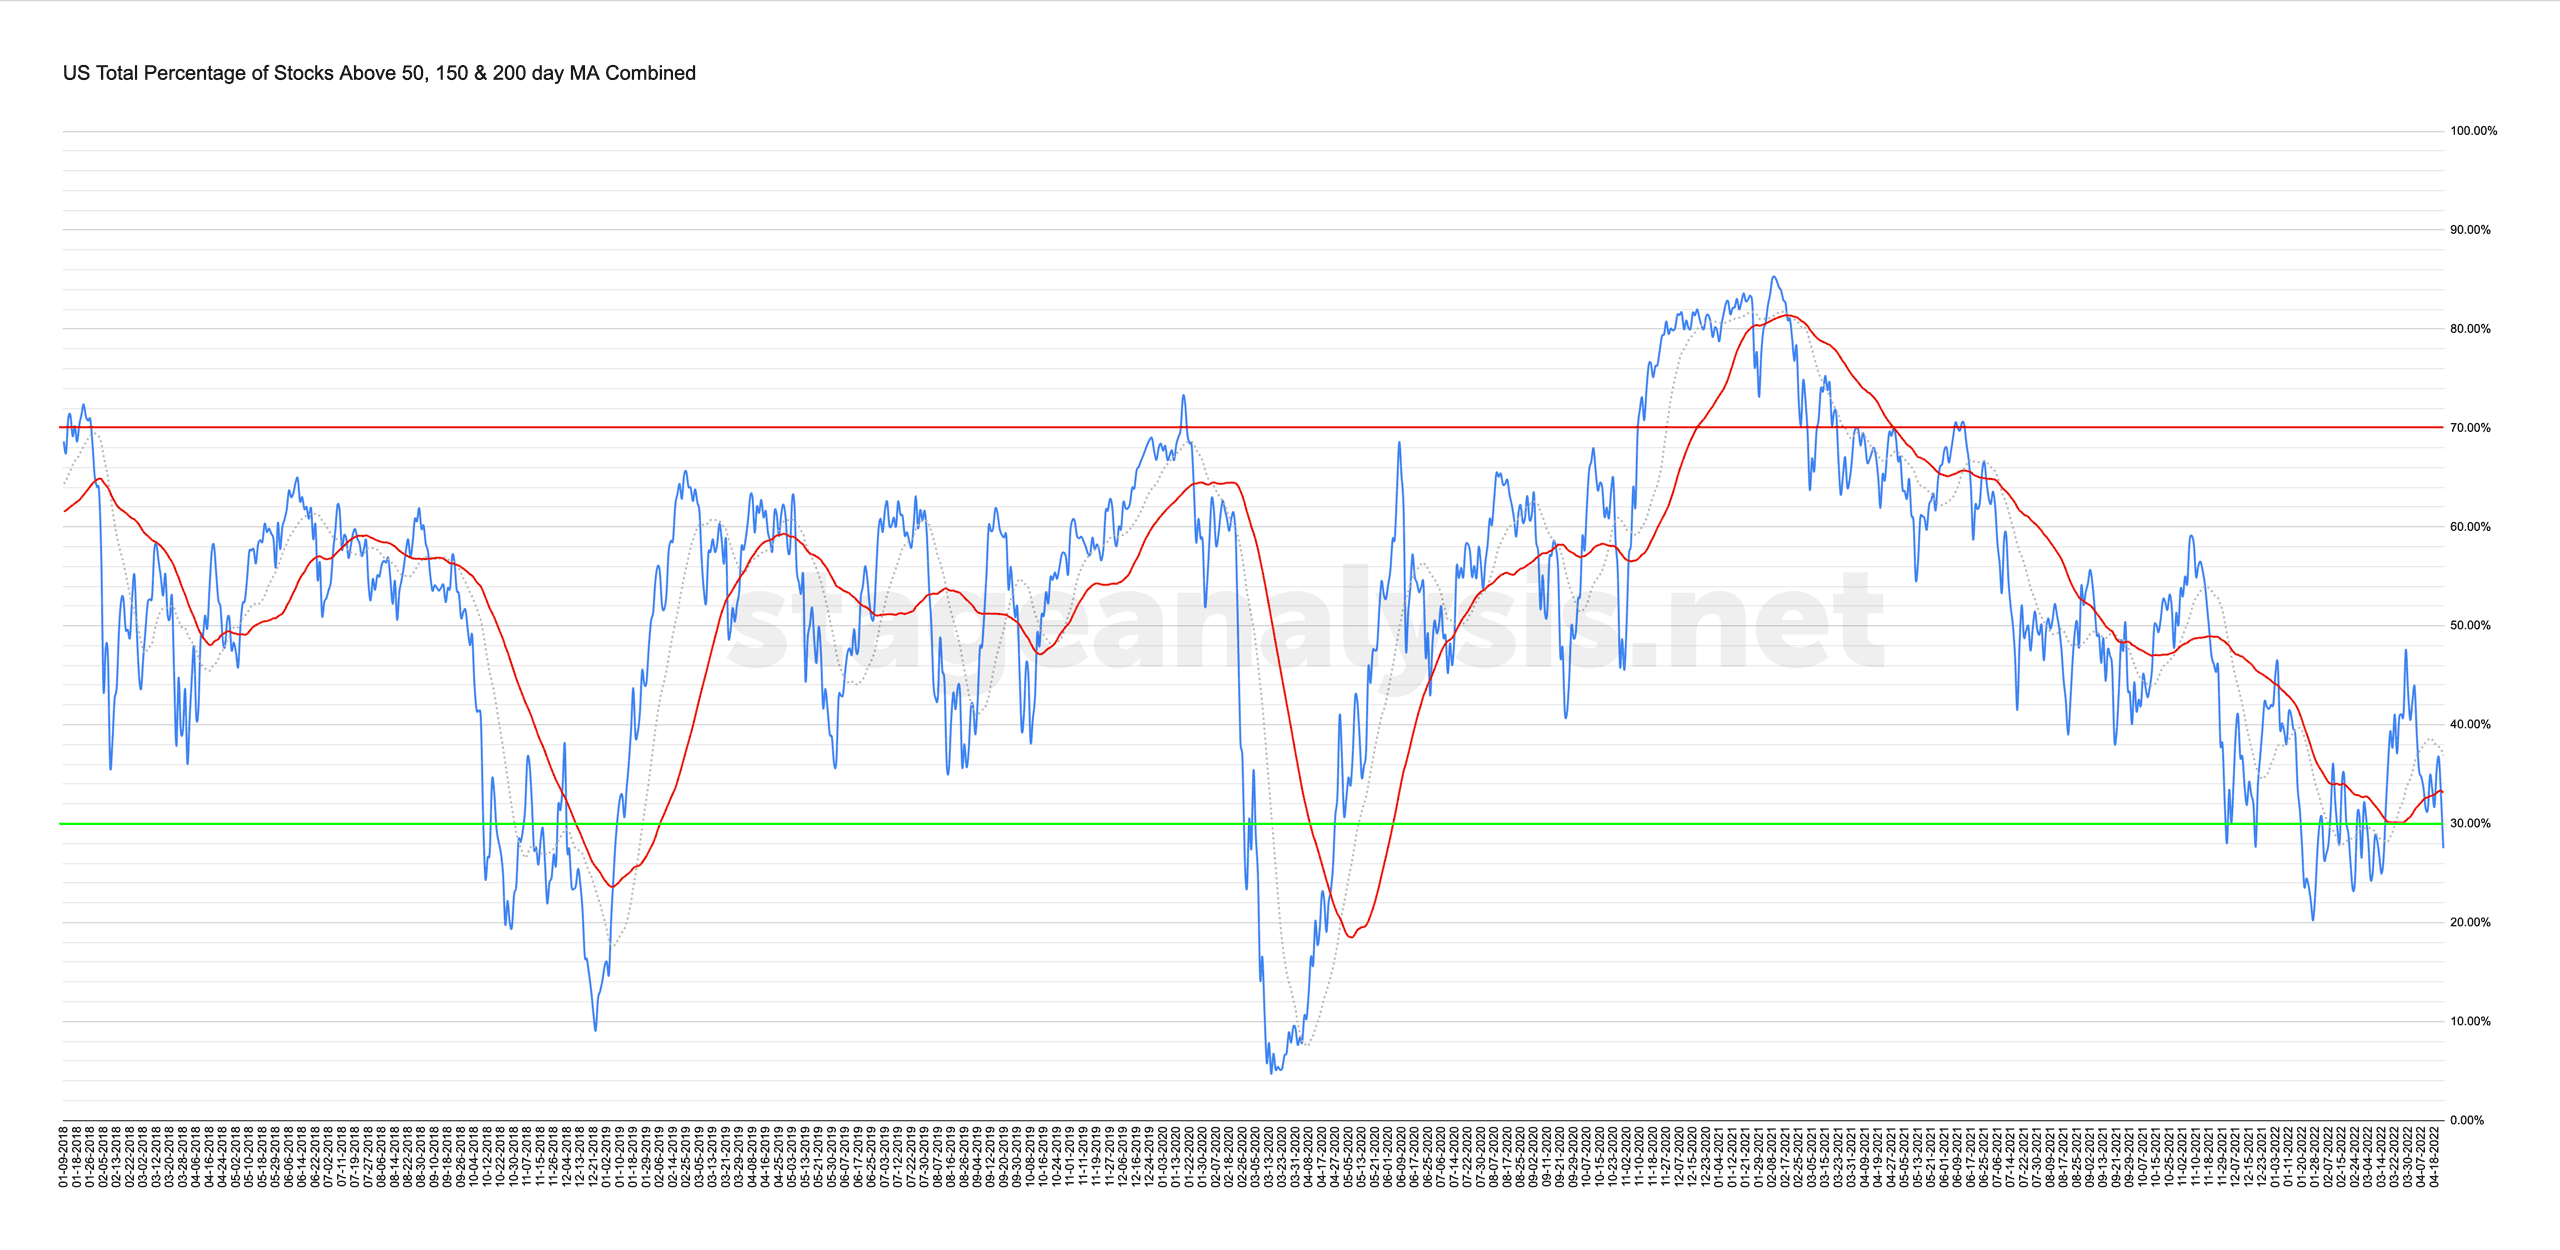
27.52% (-5.92% 1wk)
Status: Difficult Environment in Stage 4 zone
The US Total Percentage of Stocks Above their 50 Day, 150 Day & 200 Day Moving Averages Combined chart moved back below its own 50 day MA on Monday, and after a brief recovery back above on Tuesday and Wednesday it then more decisively moved below from Thursday, which caused the P&F chart to add a further 3 Os to its current column. And so the status has further changed to be even more Defensive with a Difficult Environment status.
I'll discuss this in more detail in the members weekend video (due out later on Sunday afternoon EST)
Long Term Moving Average Breadth Charts (20 Years)
Below is the 20 year charts of the Nasdaq and NYSE moving average breadth with the current level marked by the horizontal red dashed line for a clear comparison with the past periods when the moving average breadth reached similar levels.
Nasdaq Percentage of Stocks Above their 50 Day, 150 Day & 200 Day Moving Averages Combined
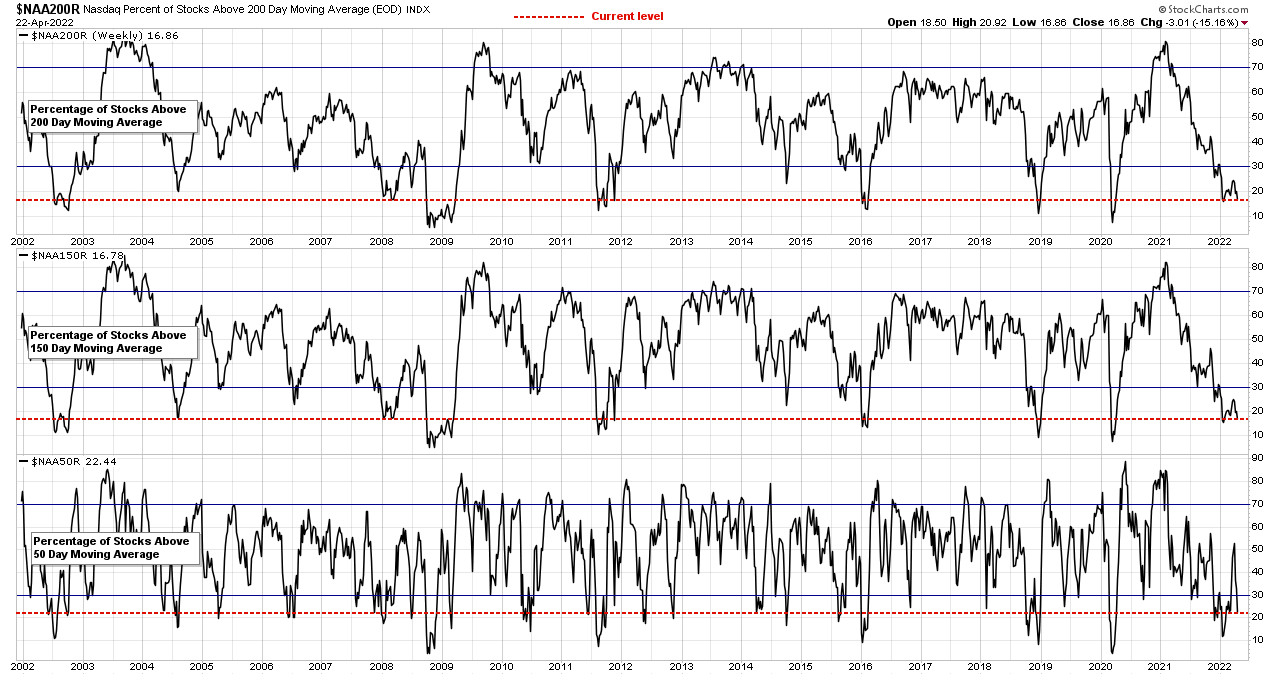
As you can see the Nasdaq Composite chart has reached levels on the long and medium term moving averages that would be considered rare. Highlighting the Stage 4 environment that the Nasdaq stocks have been in since around November 2021 when it dropped below the 40% level and then into the lower zone – which it since hasn't managed to recover from. Although the short term measure did manage to rebound back up to to 50% level. But as you can see the long term measure barely moved. Highlighting just how deeply a lot of the Nasdaq stocks have fallen below their long and medium term MAs (200 day MA and 150 day MA).
NYSE Percentage of Stocks Above their 50 Day, 150 Day & 200 Day Moving Averages Combined
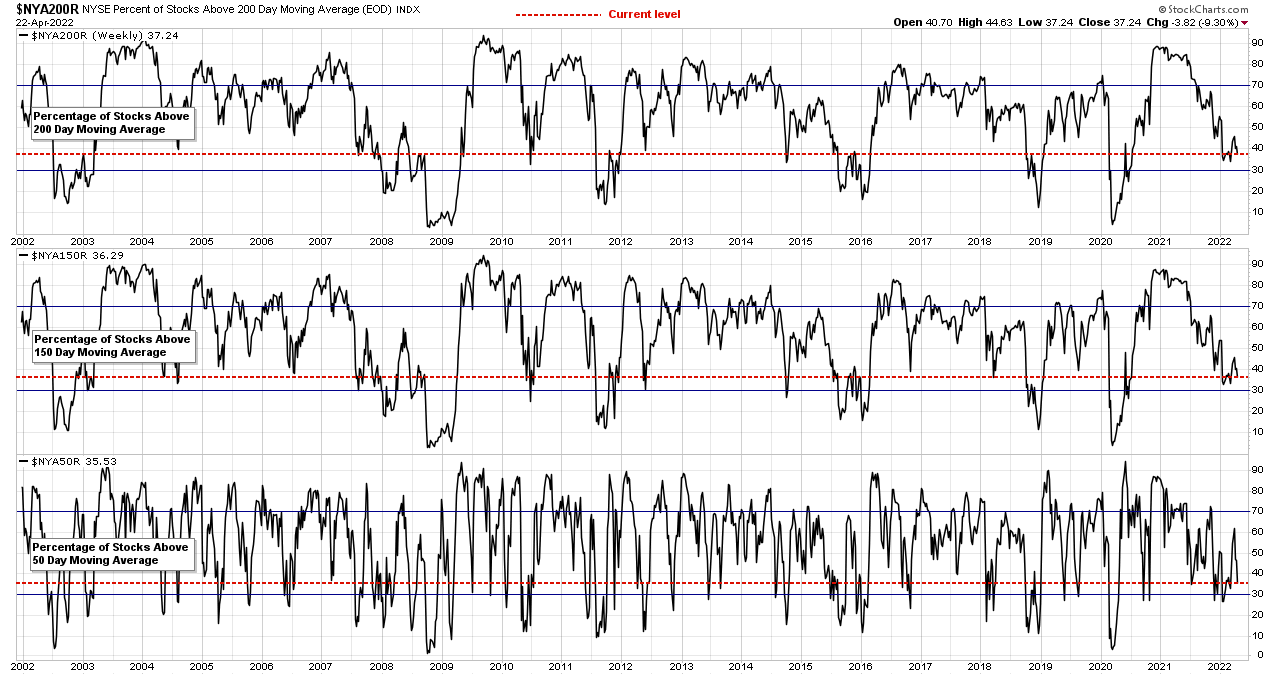
The NYSE moving average breadth continues to show better relative strength compared to the Nasdaq Composite, due to the make up of the indexes, with the majority of the recent strong RS sectors – Energy & Materials – residing in the NYSE market.
As you can see below, the NYSE percentage of stocks above their long and medium term measures has not reached the lower zone. Which it has done in every other major market Stage 4 decline. So it highlights that even with the recent weakness that we've see in the market, that there's still plenty of room for further pain – if that's the path the market chooses to take.
Become a Stage Analysis Member:
To see more like this – US Stocks watchlist posts, detailed videos each weekend, use our unique Stage Analysis tools, such as the US Stocks & ETFs Screener, Charts, Market Breadth, Group Relative Strength and more...
Join Today
Disclaimer: For educational purpose only. Not investment advice. Seek professional advice from a financial advisor before making any investing decisions.