
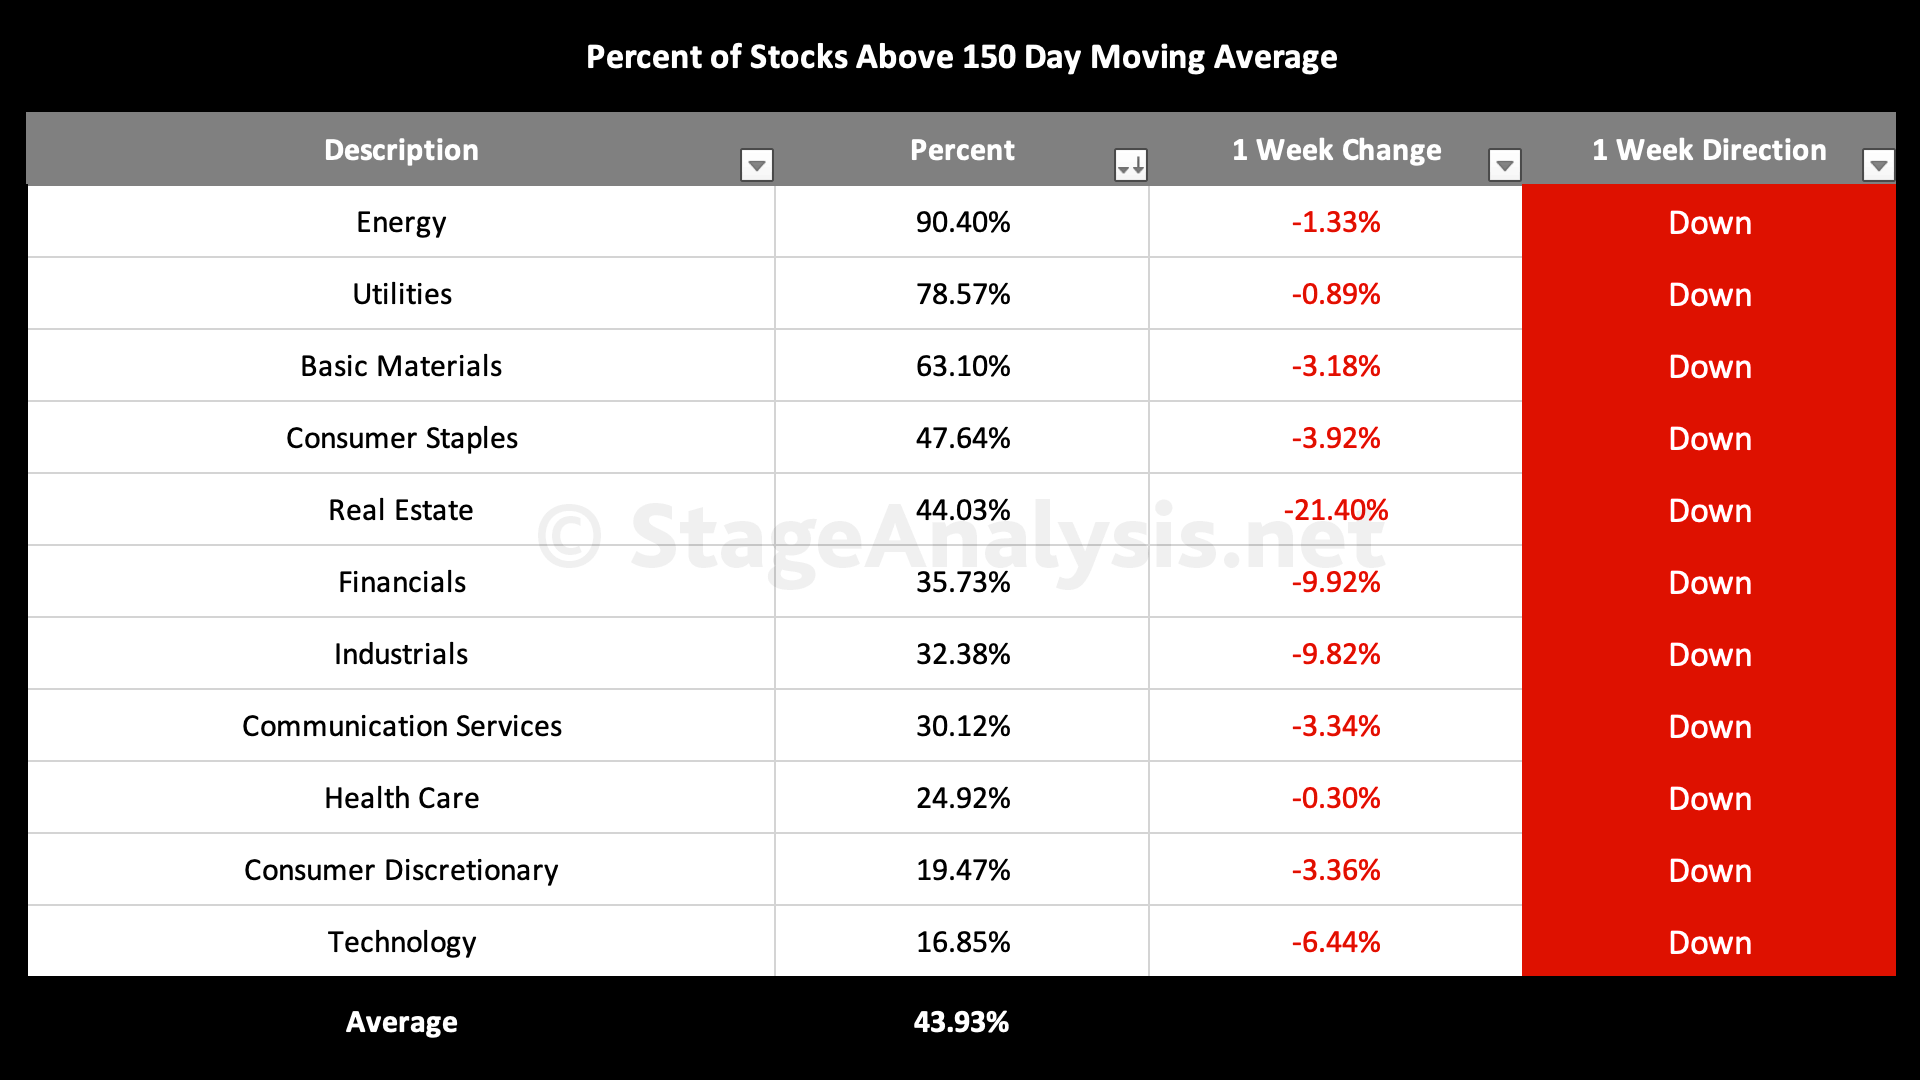
Sector Breadth: Percentage of US Stocks Above Their 150 day (30 Week) Moving Averages
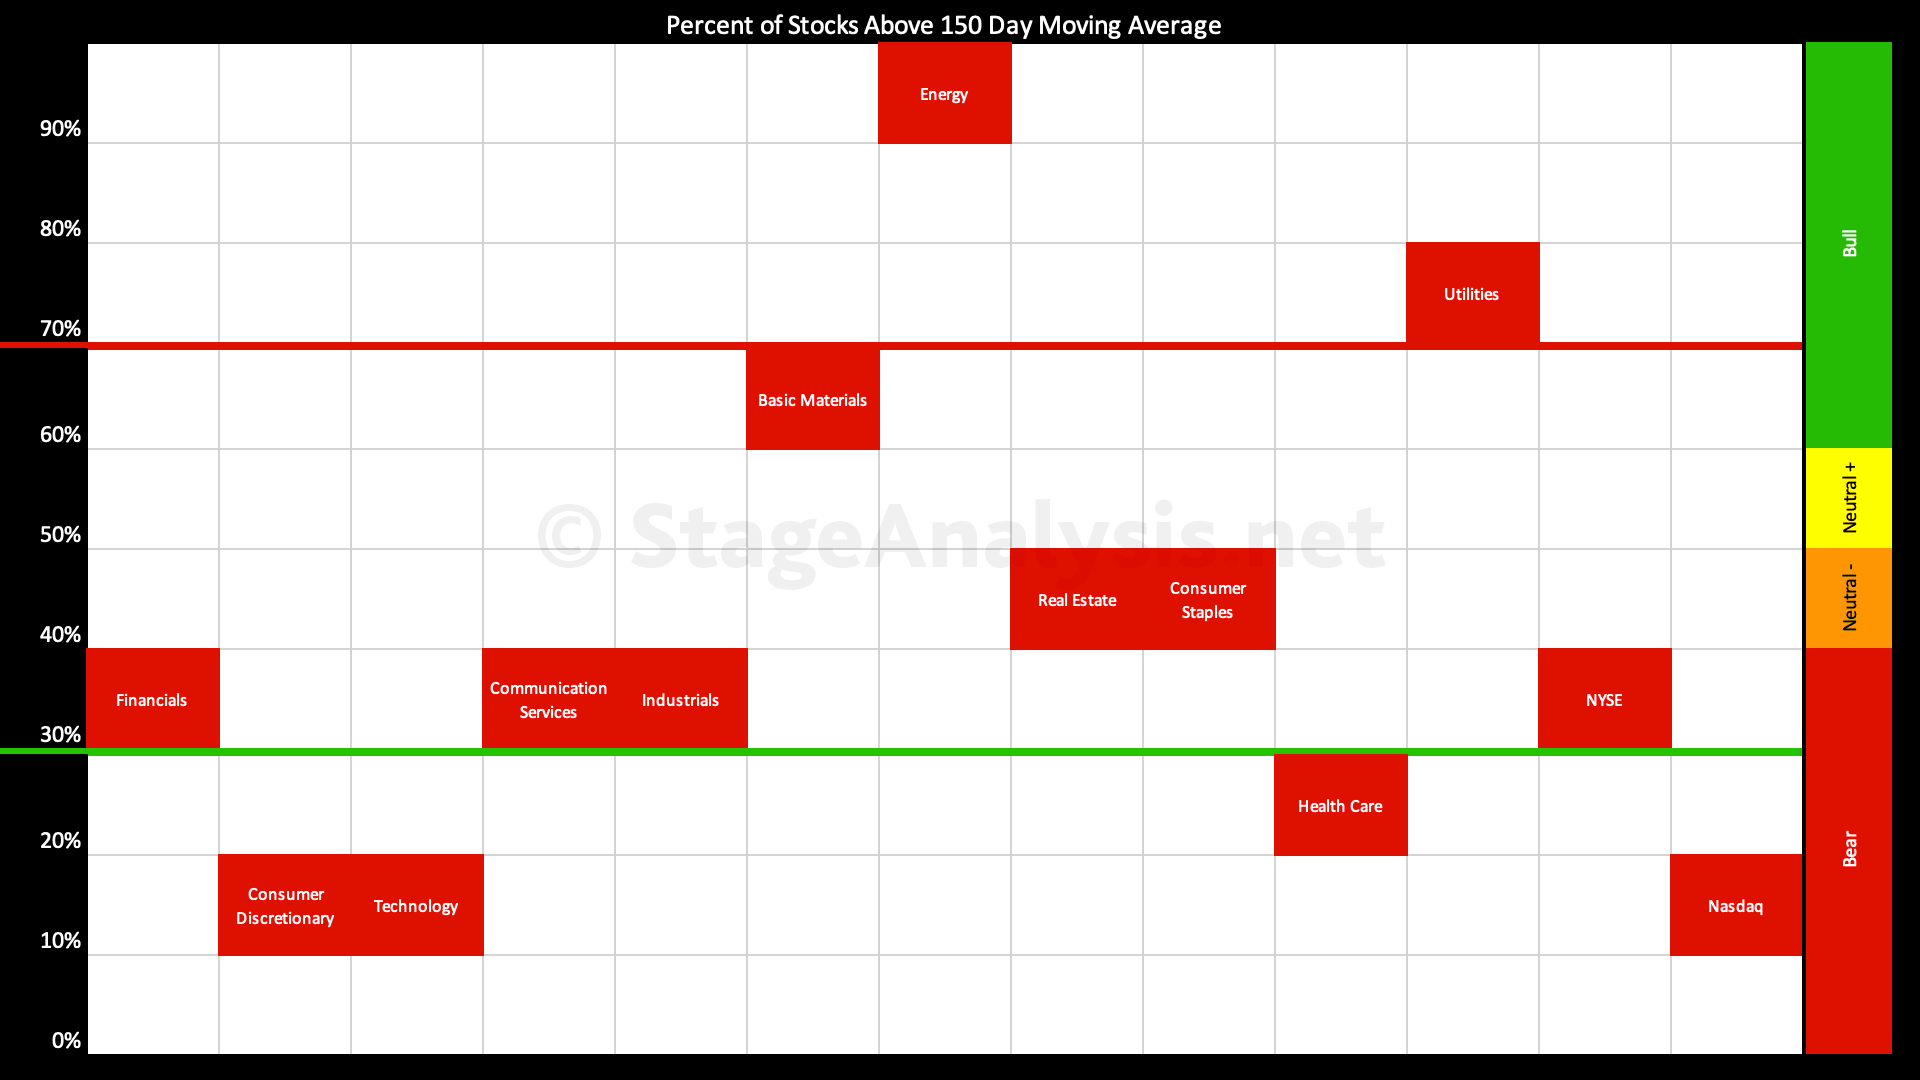
Average: 43.93% (-5.81% 1wk)
- 3 sectors are in the Stage 2 zone (Energy, Utilities, Basic Materials)
- 2 sectors are in Stage 1 / 3 zone (Real Estate, Consumer Staples)
- 6 sectors are in Stage 4 zone (Financials, Industrials, Communication Services, Health Care, Consumer Discretionary, Technology)
Declines across the entire US stock market this week with the overall average dropping back to 43.93%, which as you can see from the sector data is being propped up by the lingering strength in Energy, Utilities, and Basic Materials. While the rest of the market is lagging, especially the Consumer Discretionary and Technology sectors – which have less than 20% of stocks in each above their medium term 150 day (30 week) moving averages, and which can be seen in much greater detail by looking at the individual Industry Groups positions on the unique bell curve chart that I posted a few days ago on the website. To see that go to: US Industry Groups Bell Curve – Exclusive to Stage Analysis
*Data from the whole US market
Become a Stage Analysis Member:
To see more like this – US Stocks watchlist posts, detailed videos each weekend, use our unique Stage Analysis tools, such as the US Stocks & ETFs Screener, Charts, Market Breadth, Group Relative Strength and more...
Join Today
Disclaimer: For educational purpose only. Not investment advice. Seek professional advice from a financial advisor before making any investing decisions.