
Market Breadth: Percentage of Stocks Above their 50 Day, 150 Day & 200 Day Moving Averages Combined
The full post is available to view by members only. For immediate access:
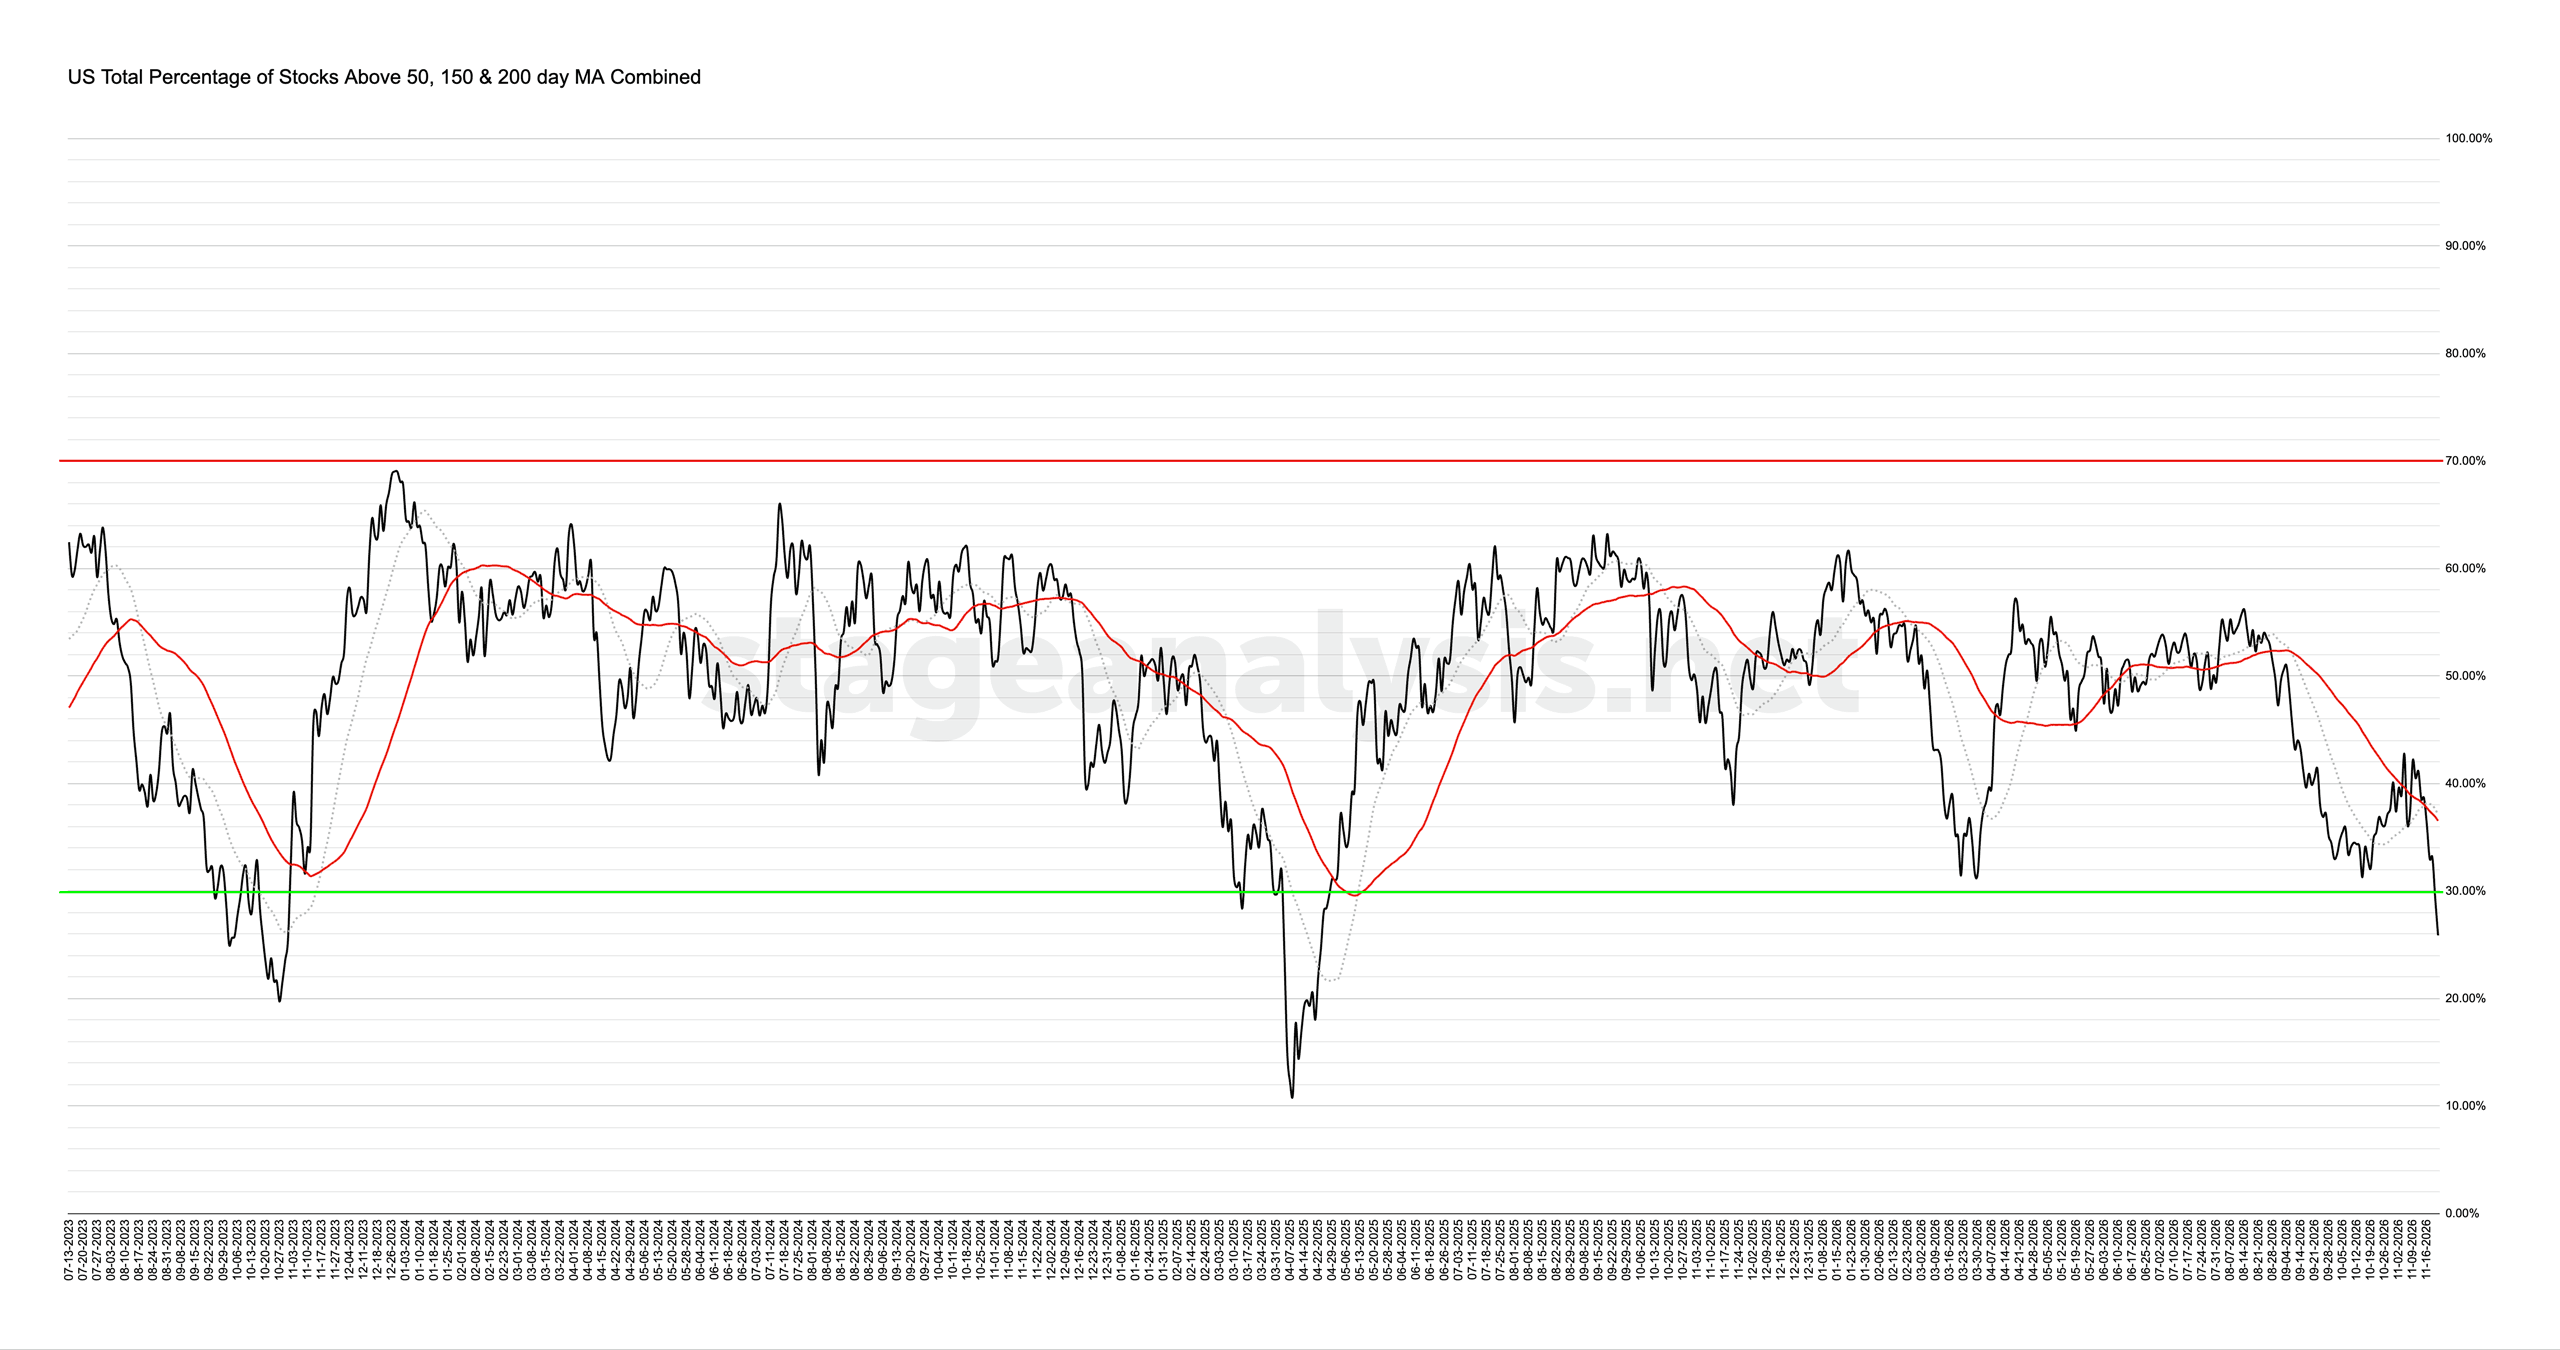
25.88% (-12.75% 1wk)
Status: Difficult Environment
The US Total Percentage of Stocks above their 50 Day, 150 Day & 200 Day Moving Averages (shown above) decreased by -12.75% this week.
Therefore, the overall combined average is at 25.88% in the US market (NYSE and Nasdaq markets combined) above their short, medium and long term moving averages.
The combined average dropped sharply throughout the week, as more stocks closed below their longer term moving averages and moved into Stage 4 declines.
It closed the week -11.21% below its short-term 20 day MA, and -10.66% below its 50 day MA (signal line). So its on Difficult Environment status.
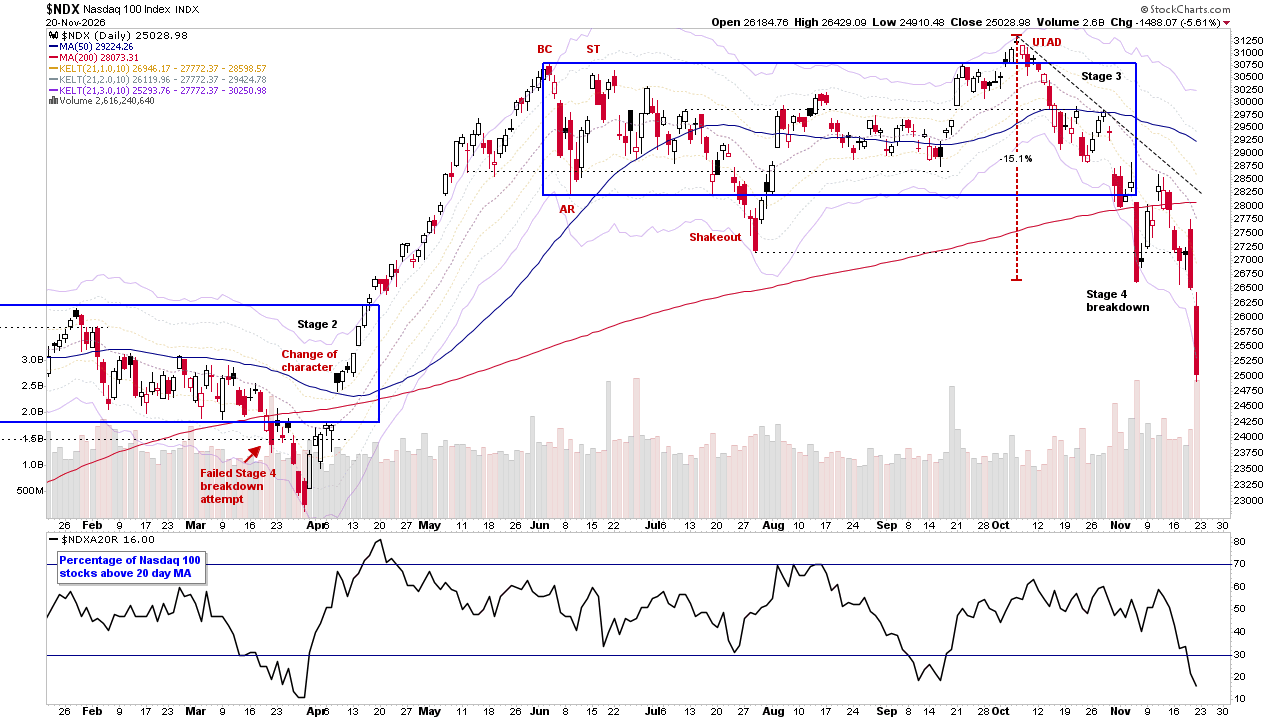
Note: All the major US indexes closed the week in Stage 4 positions. So extreme caution seems prudent still. However, around 15% of stocks are extended on the downside of their normal ATR ranges and the Nasdaq 100 futures is over -20% from it highs and approaching its VPOC anchored from the 2025 lows. So, odds of a short covering rebound attempt are increasing, especially if there's some further panic selling early in the week.
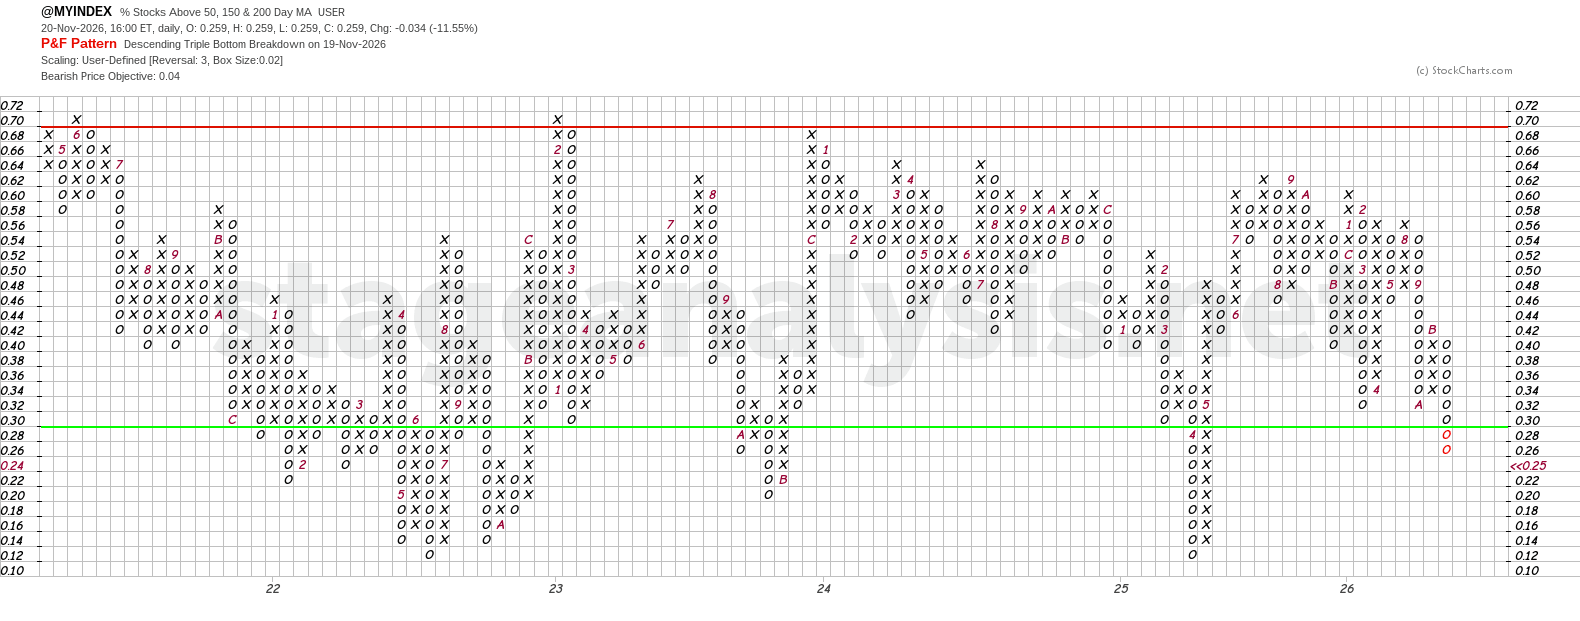
The Point and Figure (P&F) chart (shown above) moved lower in a column of Os this week, and is in P&F Bear Confirmed status in the lower zone of the field.
To reverse to a column of Xs, it needs to close above the 32% level – which would be a Bull Alert signal if that happens.
See the Bullish Percent article for more information on the P&F statuses.
Become a Stage Analysis Member:
To see more like this – US Stocks watchlist posts, detailed videos each weekend, use our unique Stage Analysis tools, such as the US Stocks & ETFs Screener, Charts, Market Breadth, Group Relative Strength and more...
Join Today
Disclaimer: For educational purpose only. Not investment advice. Seek professional advice from a financial advisor before making any investing decisions.