
Market Breadth: Percentage of Stocks Above their 50 Day, 150 Day & 200 Day Moving Averages Combined
The full post is available to view by members only. For immediate access:
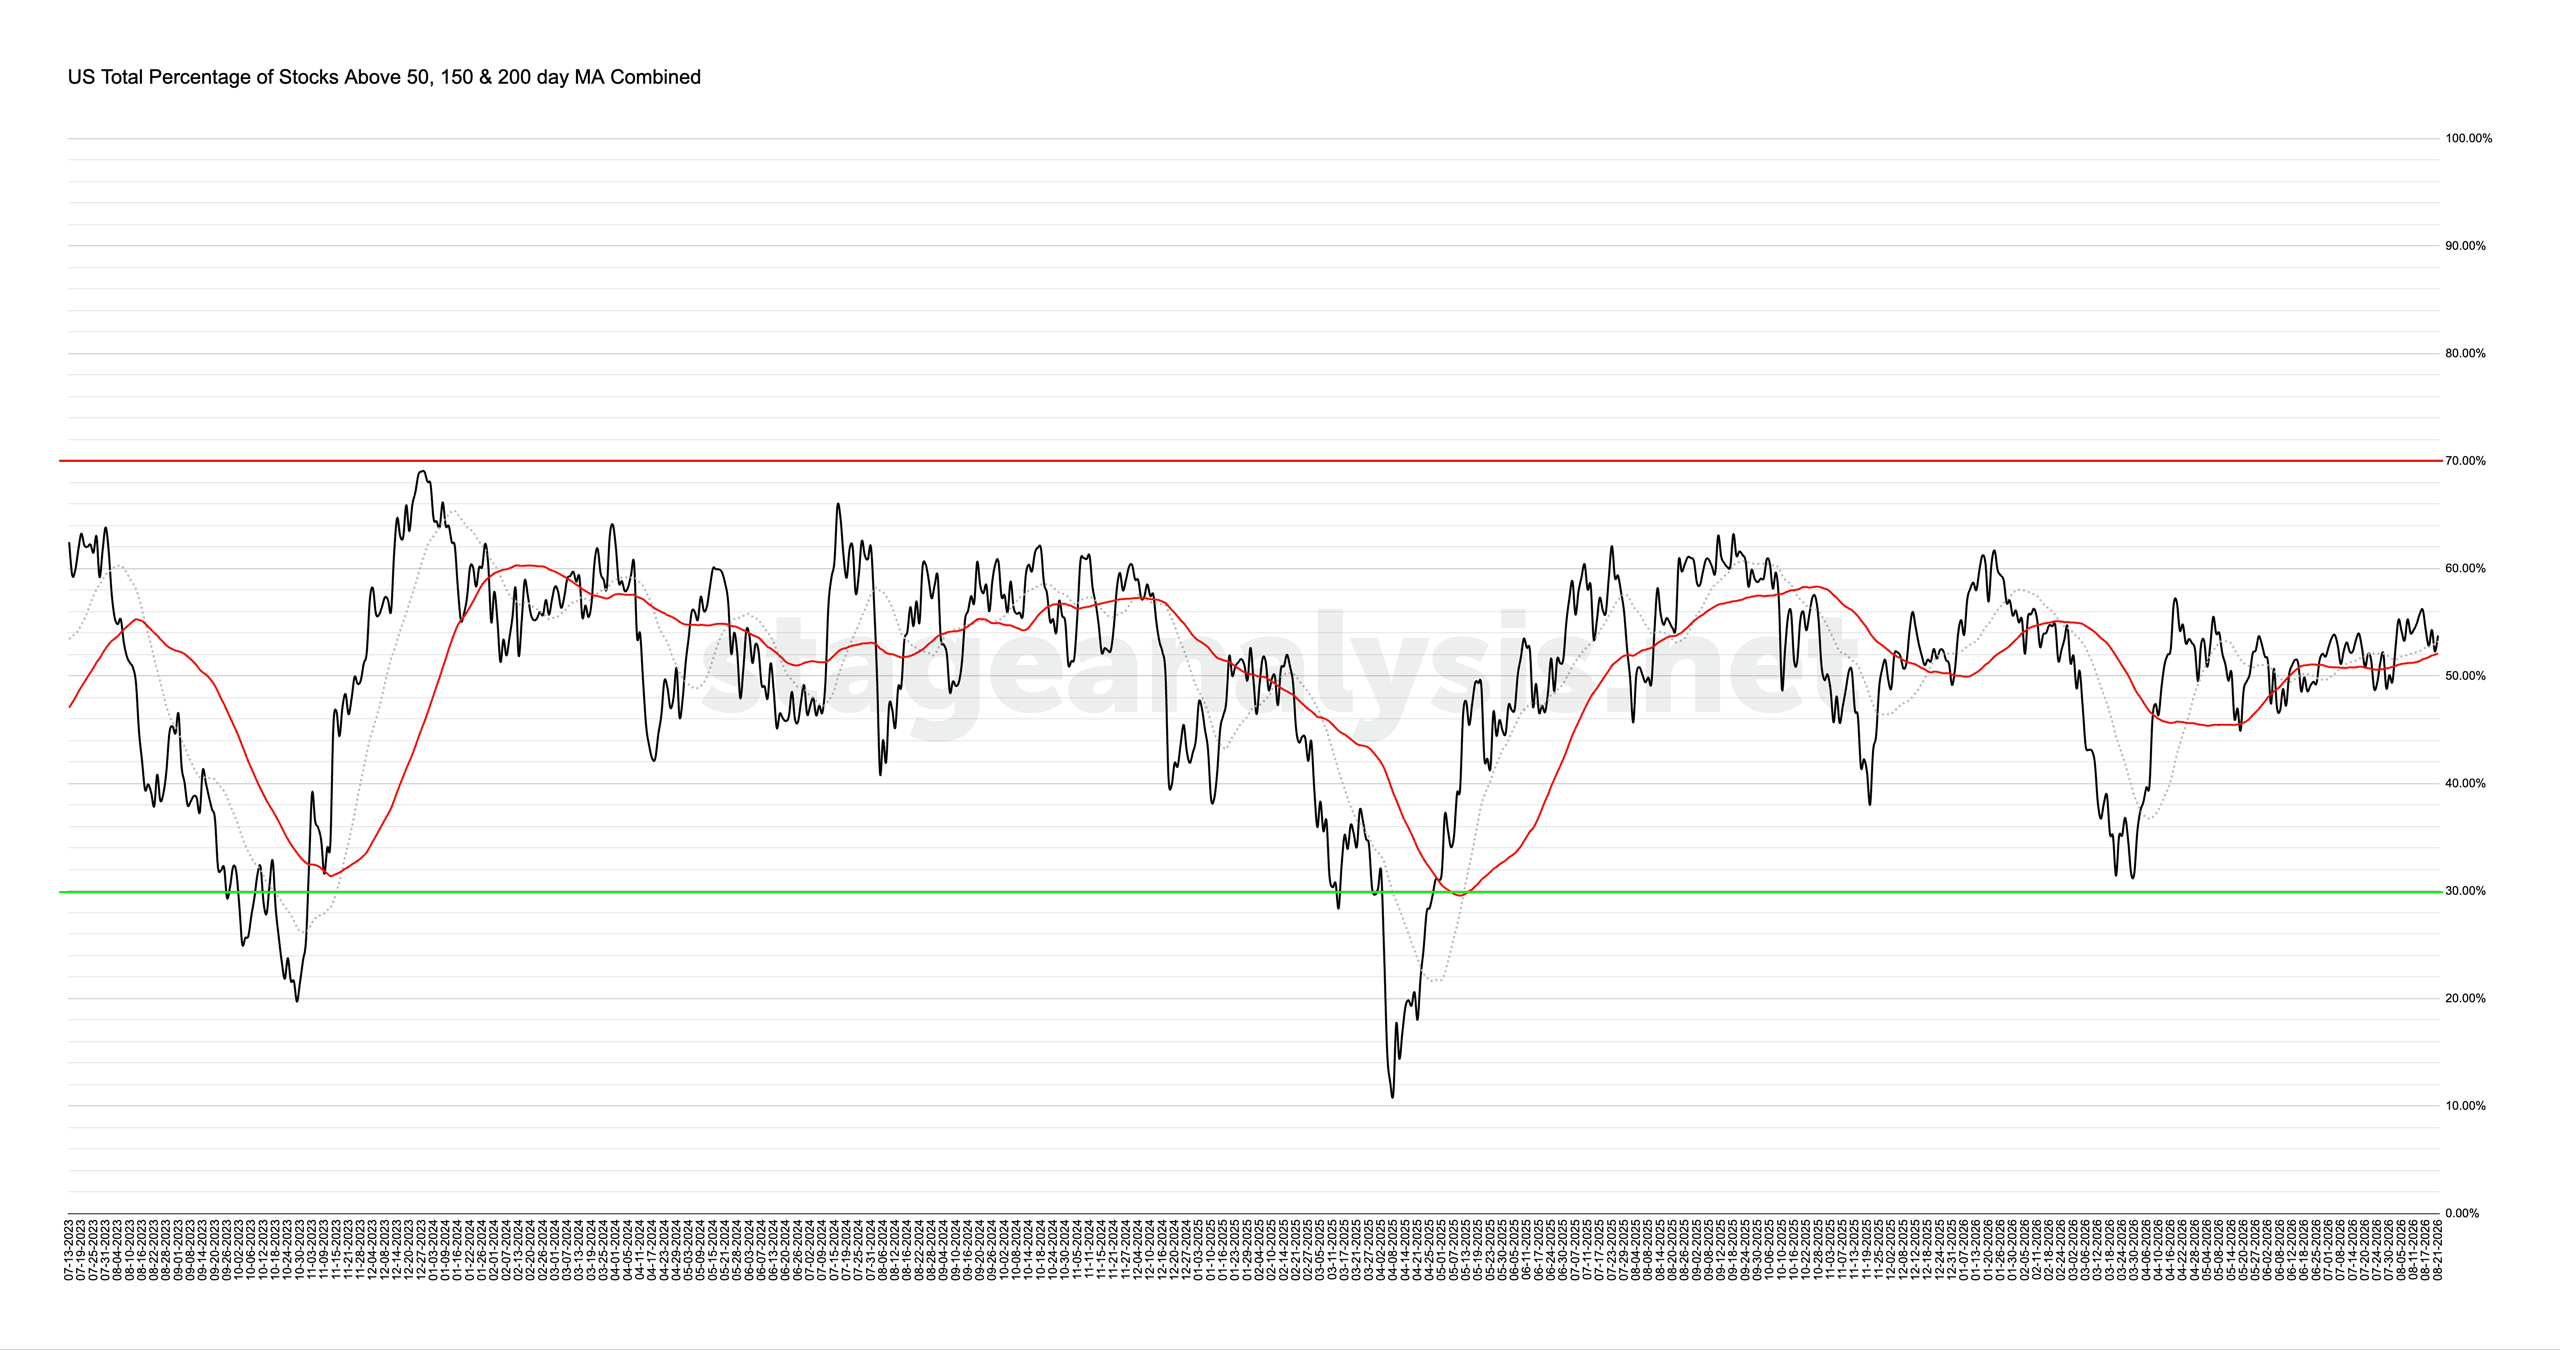
53.76% (-2.40% 1wk)
Status: Positive Environment
The US Total Percentage of Stocks above their 50 Day, 150 Day & 200 Day Moving Averages (shown above) decreased by -2.40% this week.
Therefore, the overall combined average is at 53.76% in the US market (NYSE and Nasdaq markets combined) above their short, medium and long term moving averages.
The combined average consolidated this week, with a brief dip below its short-term MA on Thursday, before recovering it on Friday. So it is currently +0.53% above its short-term 20 day MA, and +1.66% above its 50 day MA (signal line). Hence the status remains on a Positive Environment status in the upper-middle of the field. But the Feds Jackson Hole meeting later this week could add volatility.
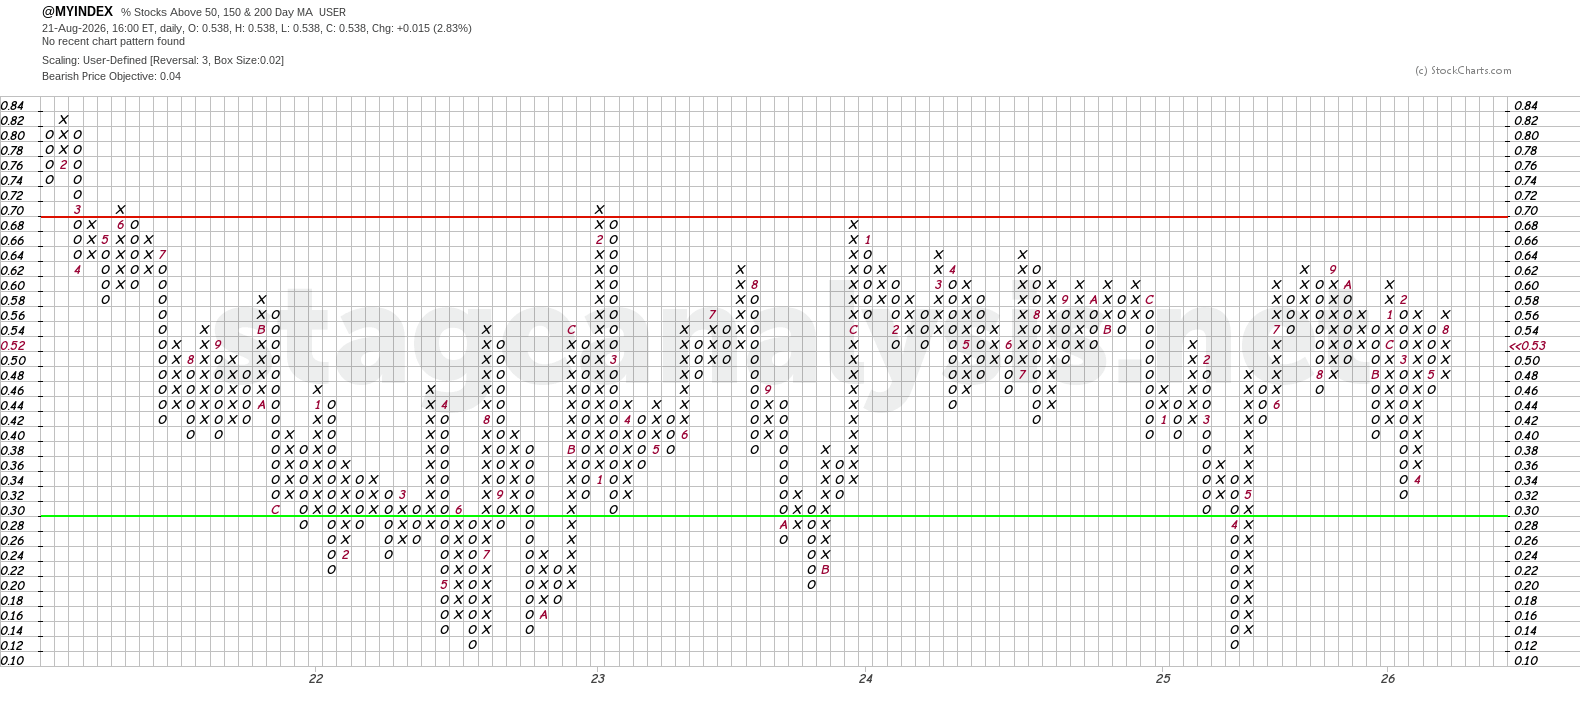
The Point and Figure (P&F) chart (shown above) was unchanged in its current column of Xs this week. So the P&F strategy remains on Offense (as it is in a column of Xs) in the upper-middle of the field.
To reverse to a column of Os (defense), it would currently need to close below the 50% level.
See the Bullish Percent article for more information on the P&F statuses.
Become a Stage Analysis Member:
To see more like this – US Stocks watchlist posts, detailed videos each weekend, use our unique Stage Analysis tools, such as the US Stocks & ETFs Screener, Charts, Market Breadth, Group Relative Strength and more...
Join Today
Disclaimer: For educational purpose only. Not investment advice. Seek professional advice from a financial advisor before making any investing decisions.