
Market Breadth: Percentage of Stocks Above their 50 Day, 150 Day & 200 Day Moving Averages Combined
The full post is available to view by members only. For immediate access:
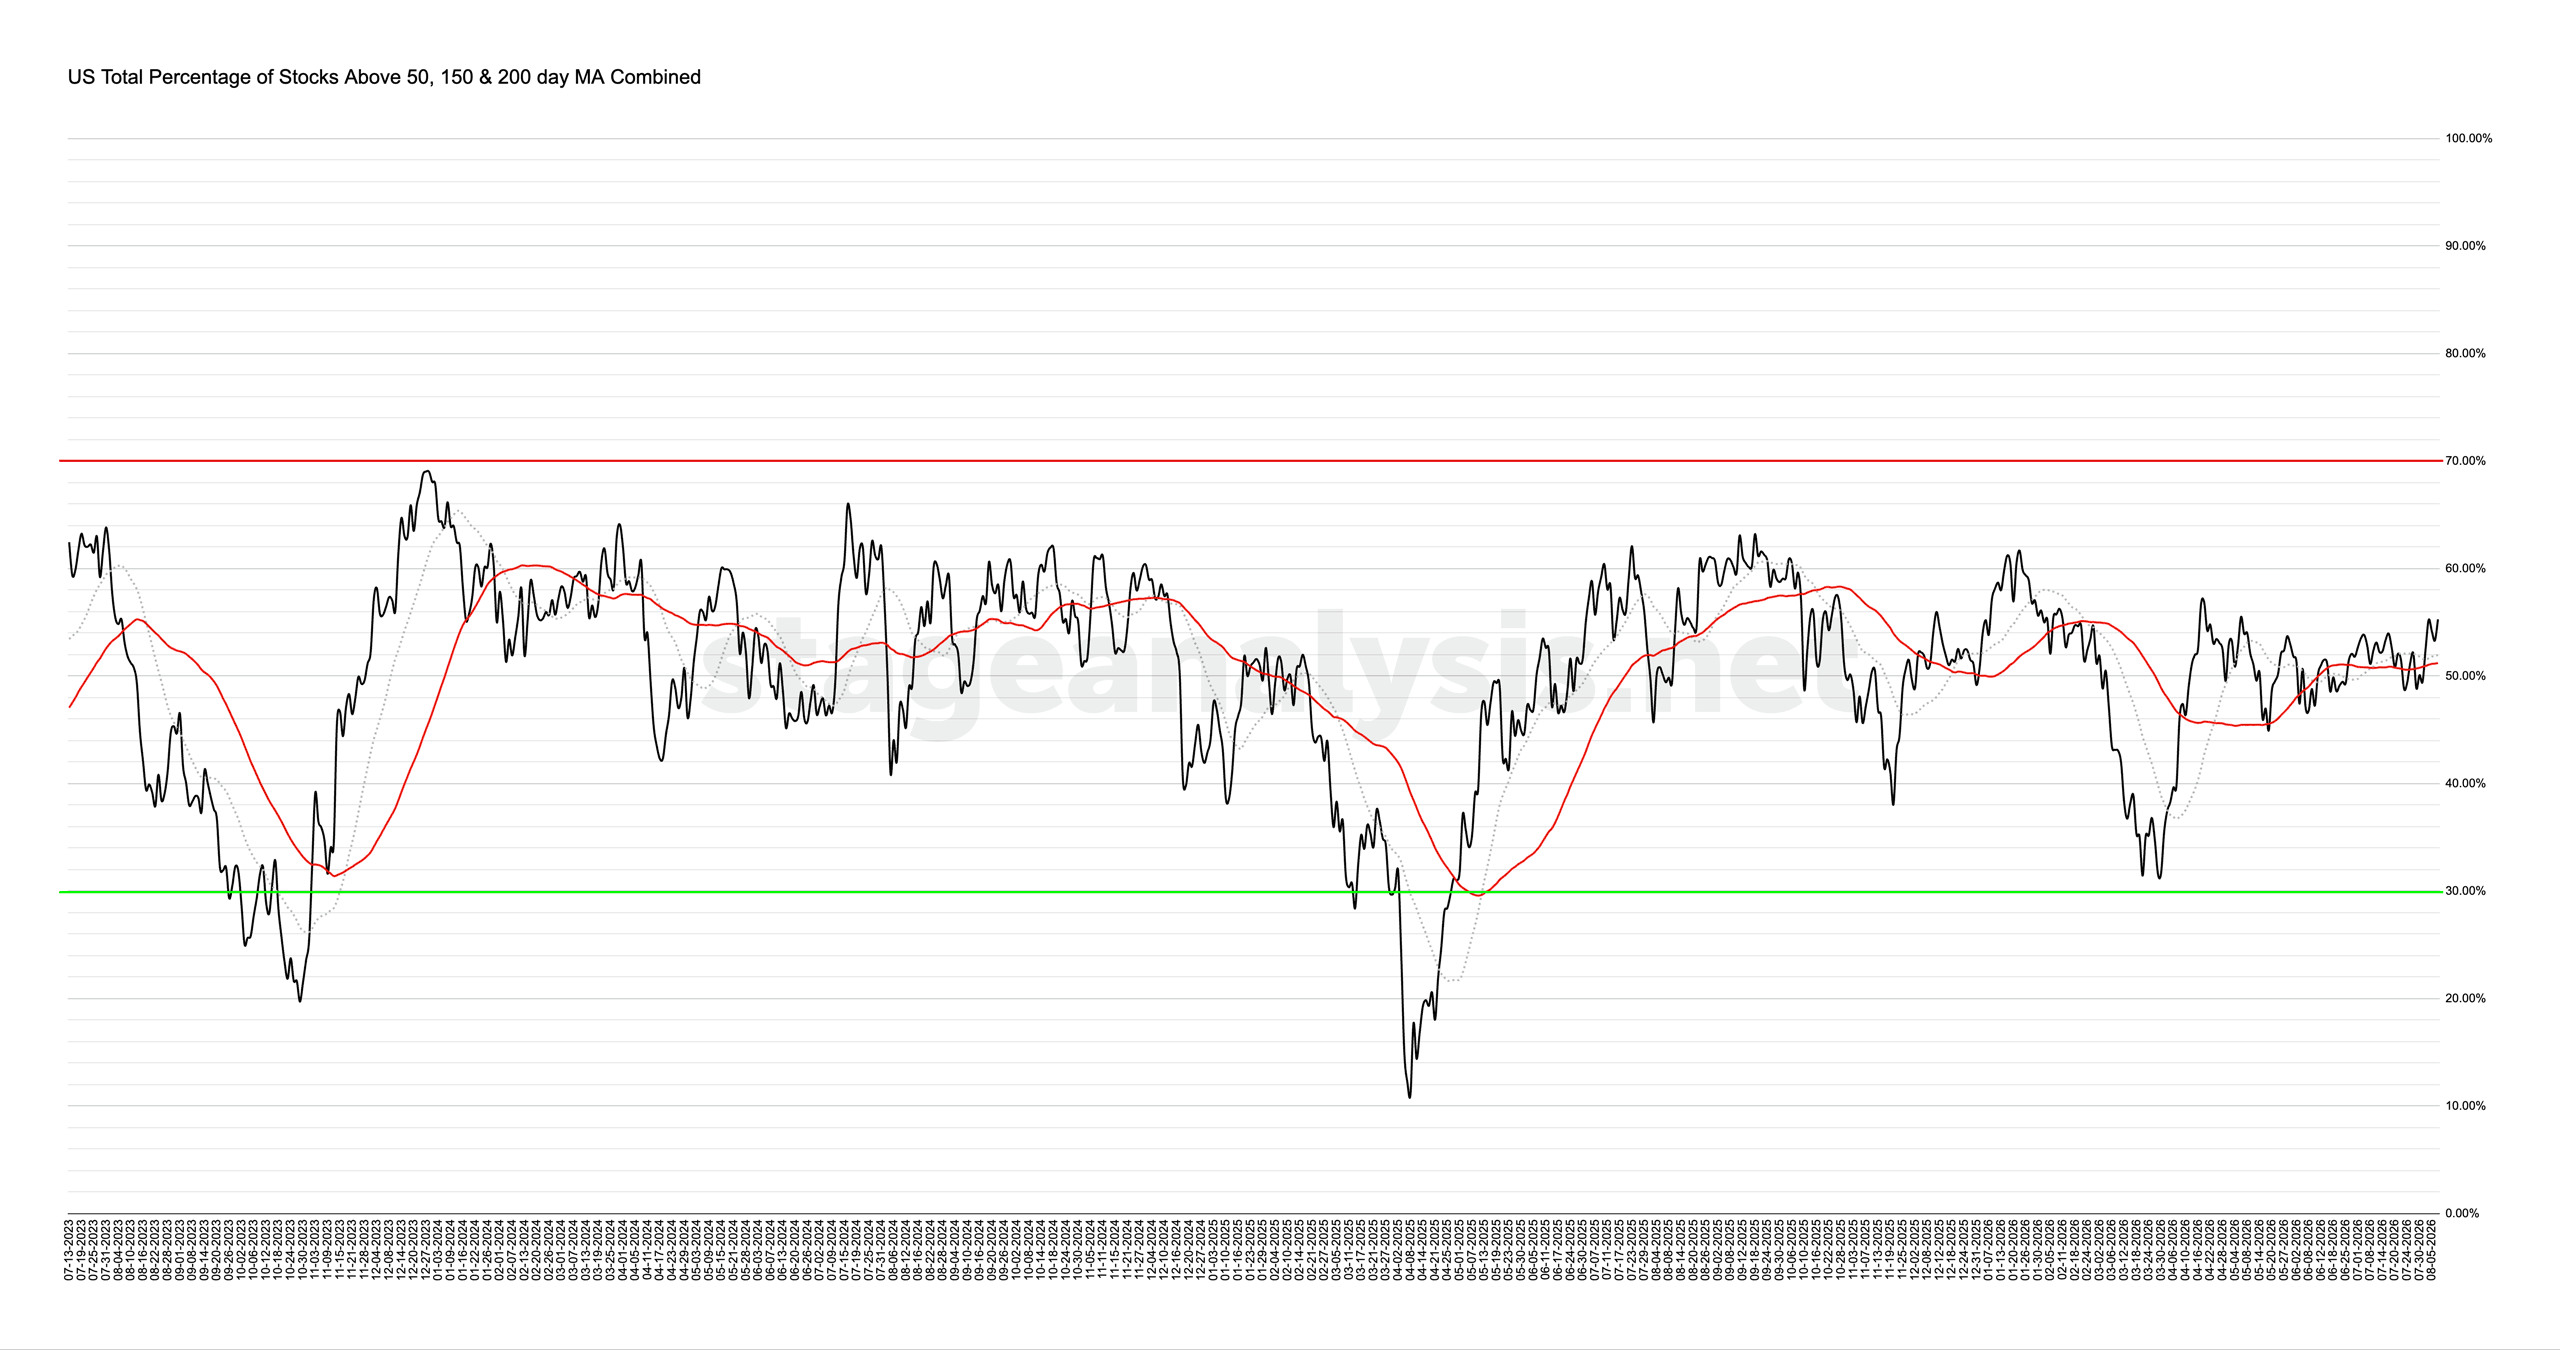
55.27% (+5.82% 1wk)
Status: Positive Environment
The US Total Percentage of Stocks above their 50 Day, 150 Day & 200 Day Moving Averages (shown above) increased by +5.82% this week.
Therefore, the overall combined average is at 55.27% in the US market (NYSE and Nasdaq markets combined) above their short, medium and long term moving averages.
The combined average broke out on Tuesday above the previous pivots highs, and then consolidated and closed the week back at the the highs again. So it is currently +3.31% above its short-term 20 day MA, and +4.06% above its 50 day MA (signal line). Hence the status changed to a Positive Environment status in the upper-middle of the field.
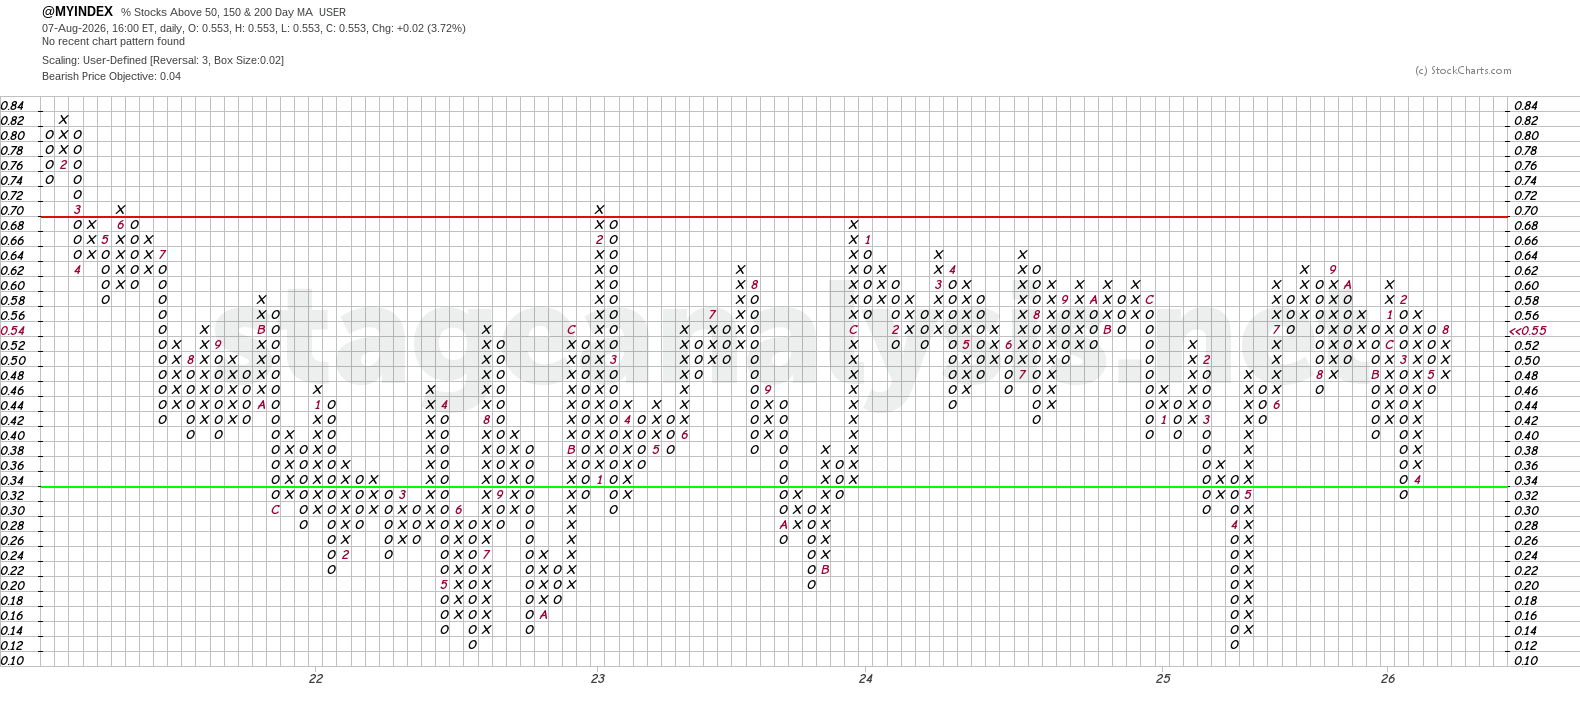
The Point and Figure (P&F) chart (shown above) added a additional X to its current column of Xs this week. So the P&F strategy remains on Offense (as it is in a column of Xs) in the upper-middle of the field.
To reverse to a column of Os (defense), it would currently need to close below the 48% level.
See the Bullish Percent article for more information on the P&F statuses.
Become a Stage Analysis Member:
To see more like this – US Stocks watchlist posts, detailed videos each weekend, use our unique Stage Analysis tools, such as the US Stocks & ETFs Screener, Charts, Market Breadth, Group Relative Strength and more...
Join Today
Disclaimer: For educational purpose only. Not investment advice. Seek professional advice from a financial advisor before making any investing decisions.