
Market Breadth: Percentage of Stocks Above their 50 Day, 150 Day & 200 Day Moving Averages Combined
The full post is available to view by members only. For immediate access:
46.37% (+8.10% 1wk)
Status: Neutral / Positive Environment
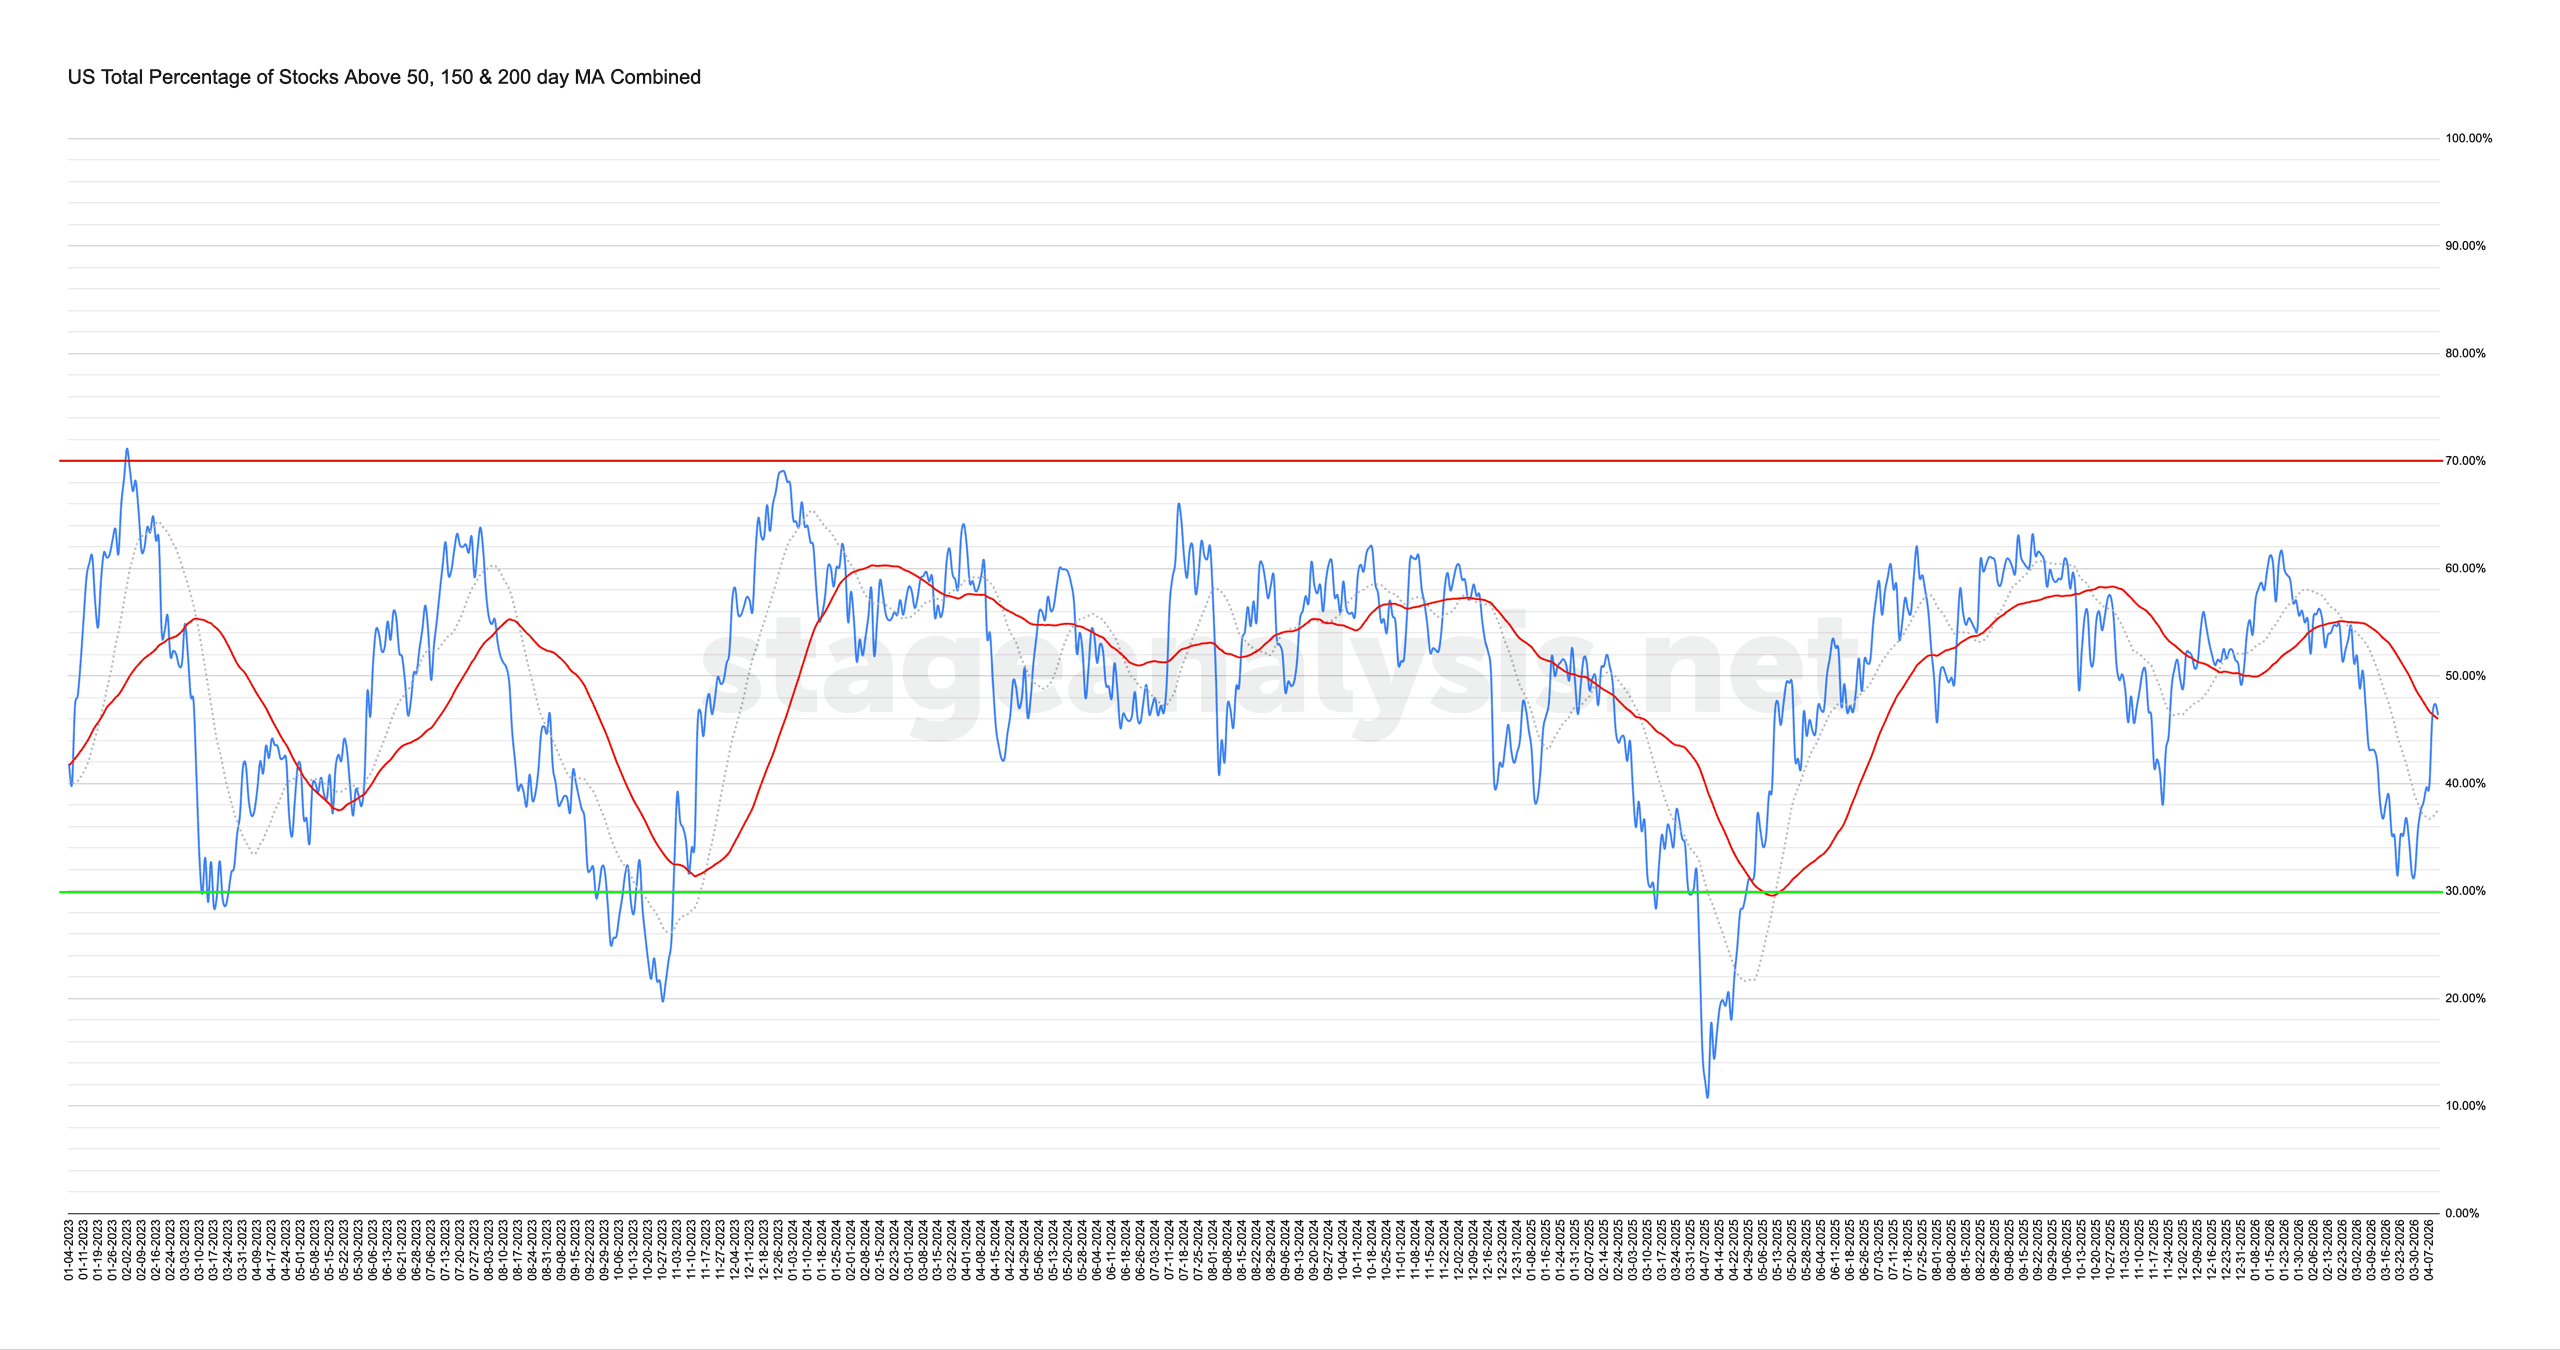
The US Total Percentage of Stocks above their 50 Day, 150 Day & 200 Day Moving Averages (shown above) increased by +8.10% this week.
Therefore, the overall combined average is at 46.37% in the US market (NYSE and Nasdaq markets combined) above their short, medium and long term moving averages.
The combined average continued to rebound strongly for a second week, closing back slightly above its 50 day MA for the first time since early February, and is now +8.82% above its short-term 20 day MA, and +0.36% above its 50 day MA (signal line). Hence the status remains on Neutral Environment status, as it's so close to the MA, but with a slightly positive weighting.
So its moved a long way in a very short time. So it's a change of character from what we've seen in the last few months in the market. But as previously, the geopolitical headwinds continue to cause extreme volatility on a daily basis. Hence caution continues remains prudent.
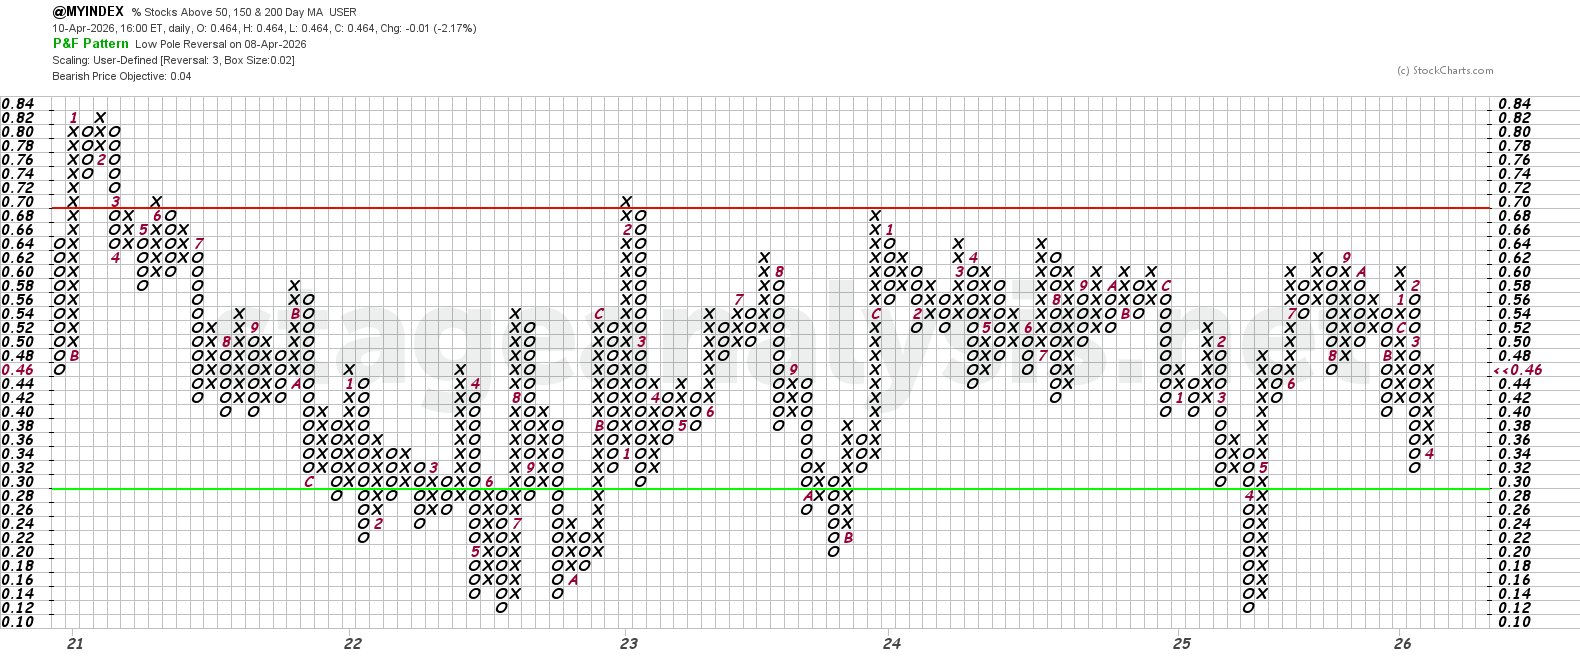
The Point and Figure (P&F) chart (shown above) added a further 4 Xs to the column of Xs this week. So the P&F strategy remains on Offense (as it is in a column of Xs), and the P&F status changes to Low Pole Reversal status in the lower middle of the field.
See the Bullish Percent article for more information on the P&F statuses.
Become a Stage Analysis Member:
To see more like this – US Stocks watchlist posts, detailed videos each weekend, use our unique Stage Analysis tools, such as the US Stocks & ETFs Screener, Charts, Market Breadth, Group Relative Strength and more...
Join Today
Disclaimer: For educational purpose only. Not investment advice. Seek professional advice from a financial advisor before making any investing decisions.