
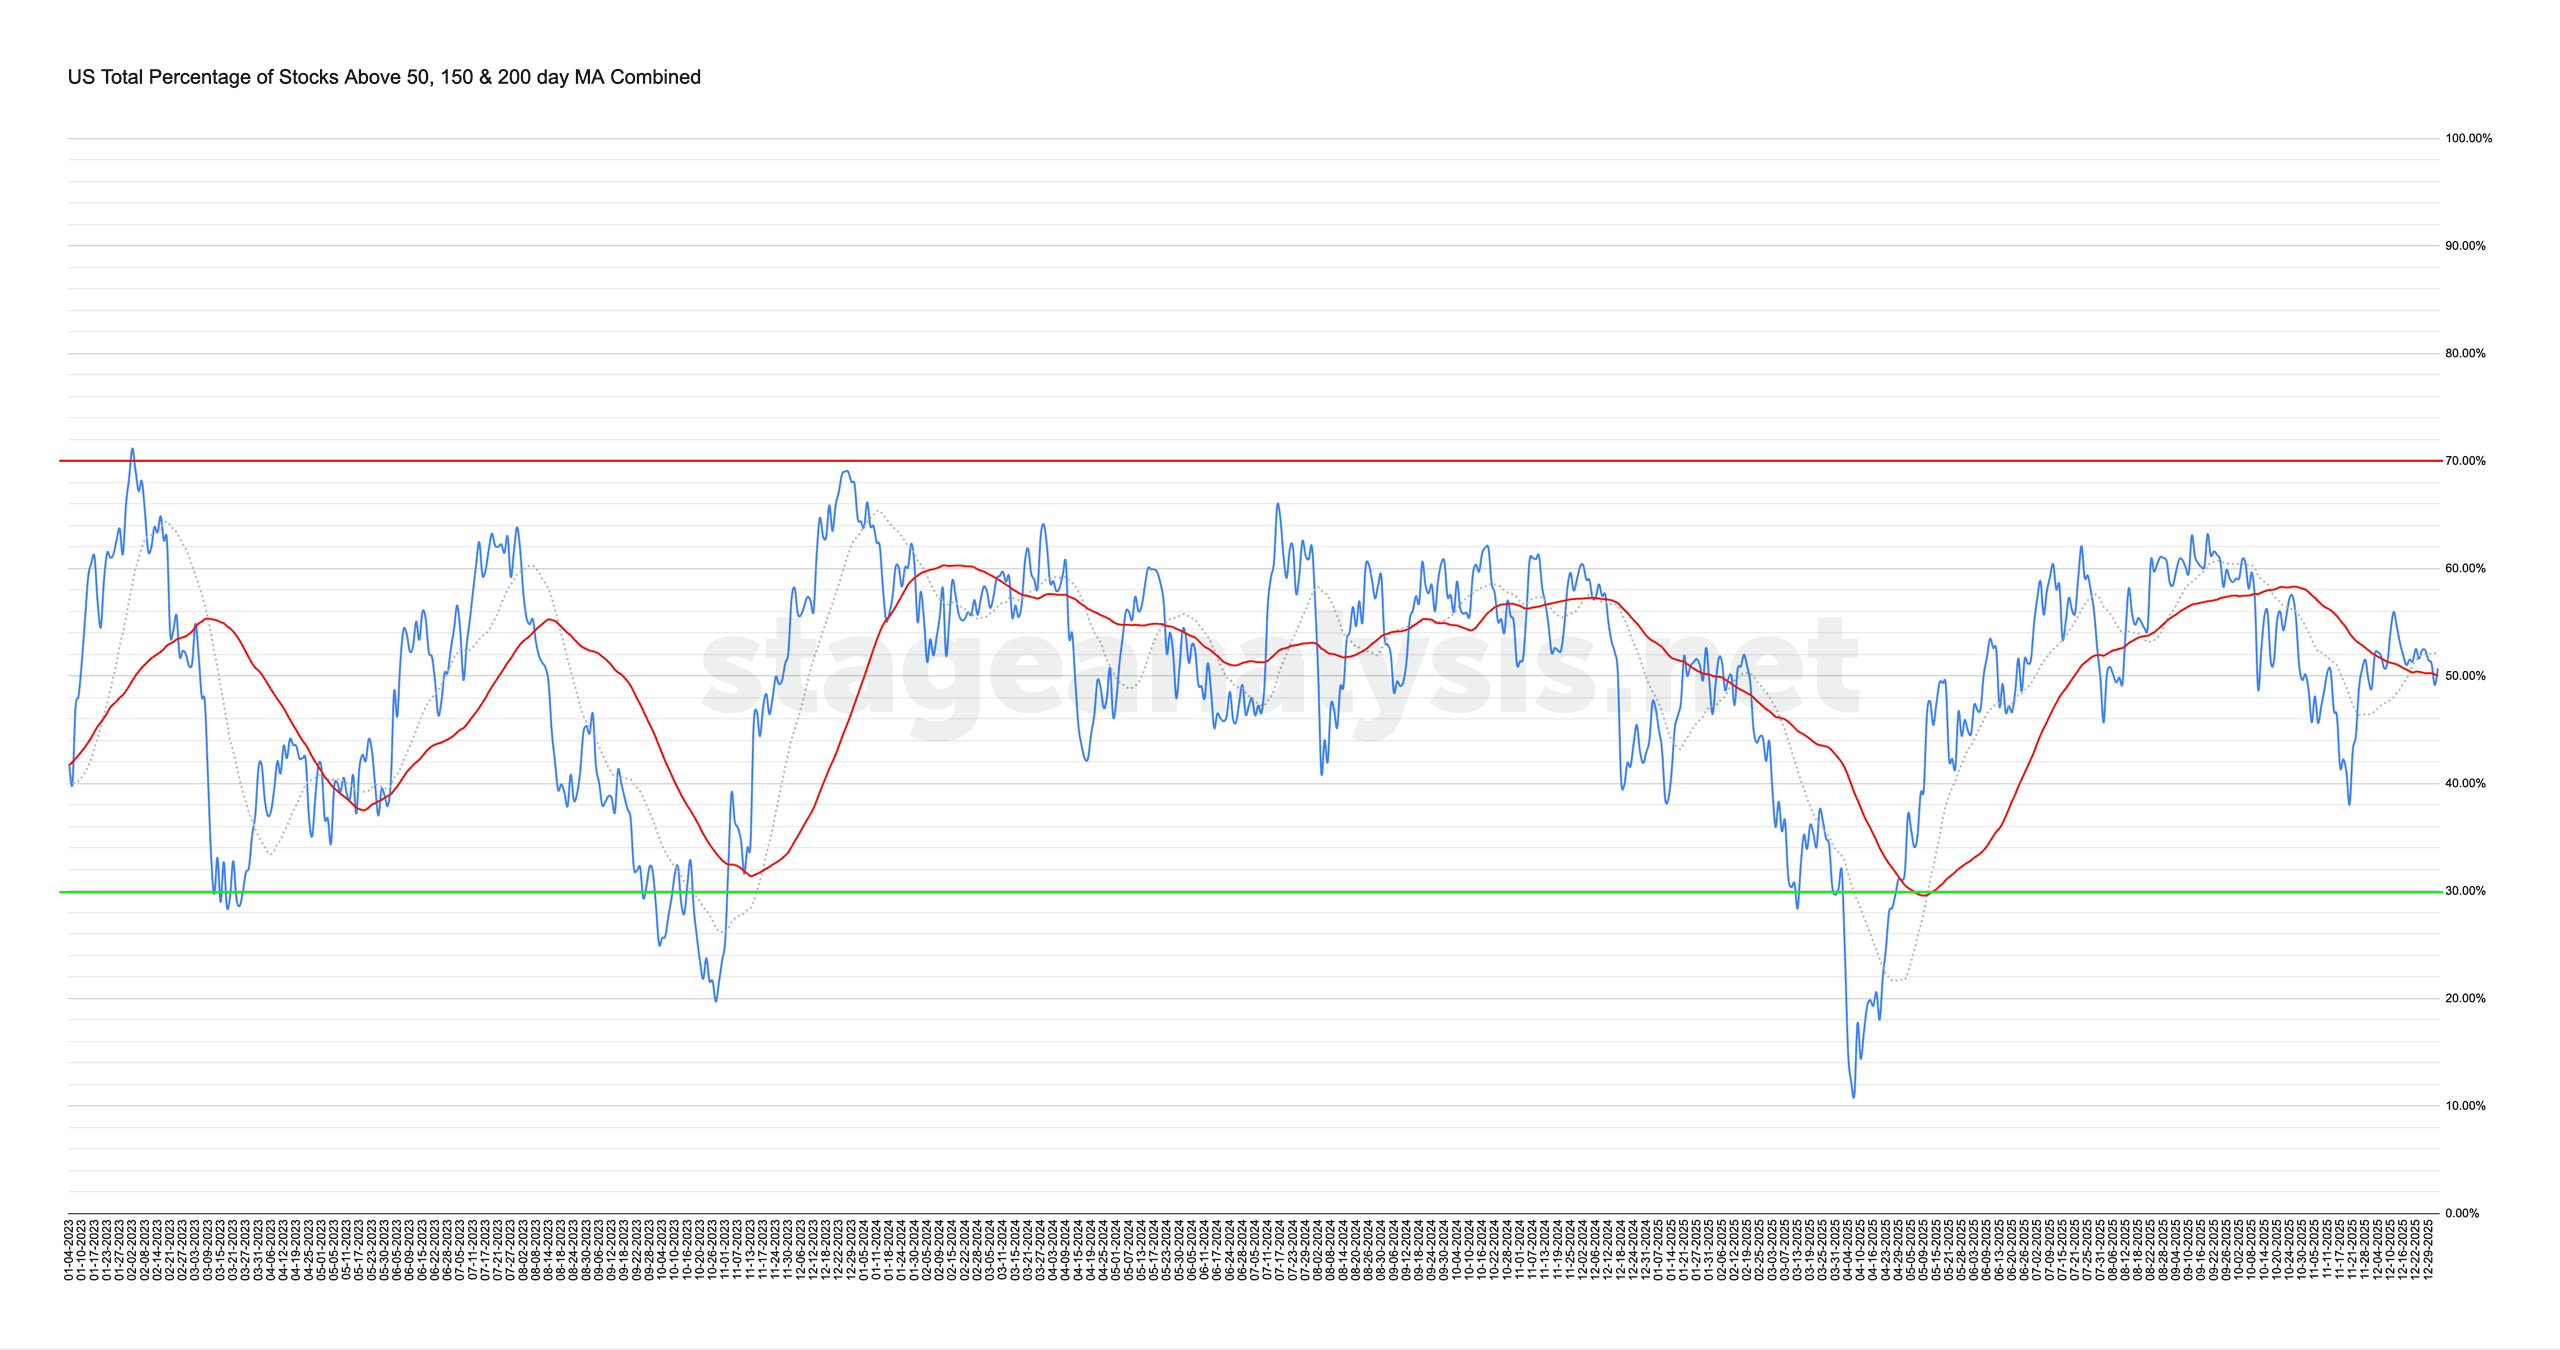
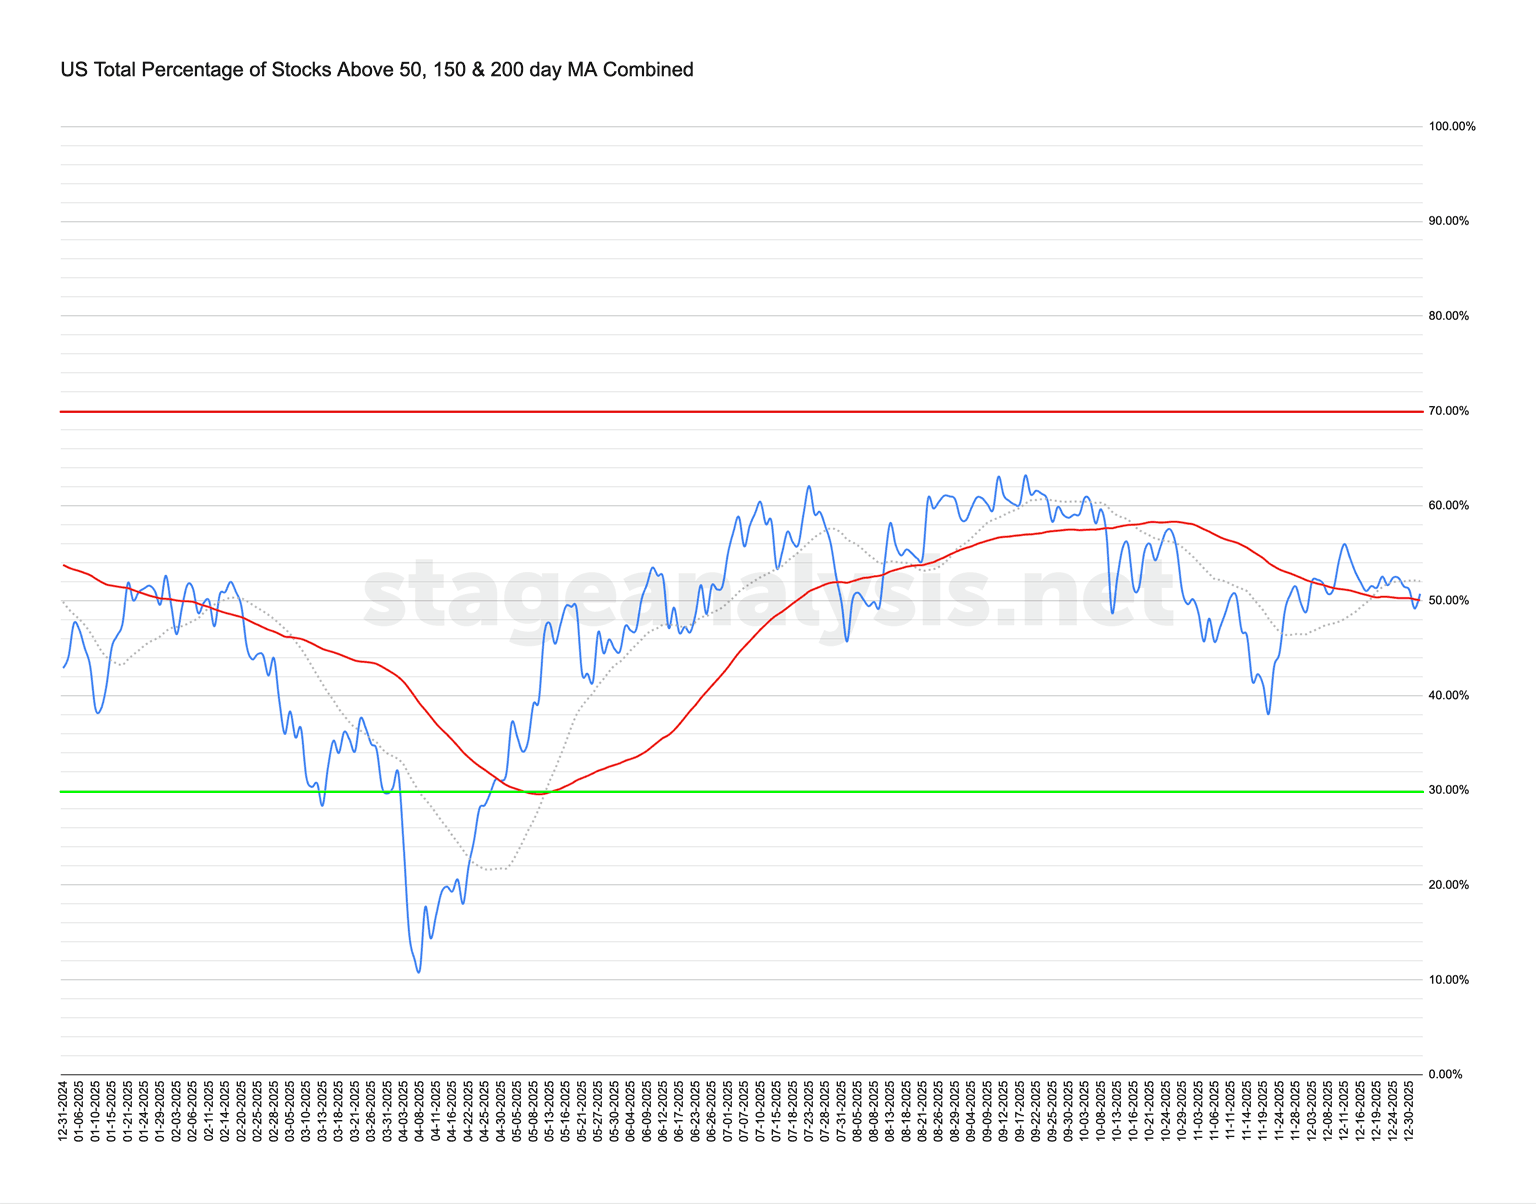
Market Breadth: Percentage of Stocks Above their 50 Day, 150 Day & 200 Day Moving Averages Combined
The full post is available to view by members only. For immediate access:
50.72% (-1.67% 1wk)
Status: Neutral Environment
The US Total Percentage of Stocks above their 50 Day, 150 Day & 200 Day Moving Averages (shown above) decreased by -1.67% this week.
Therefore, the overall combined average is at 50.72% in the US market (NYSE and Nasdaq markets combined) above their short, medium and long term moving averages.
The combined average pulled back into the end of year, with a slight rebound on Friday as the New Year of trading began. It is currently -1.33% below its short-term 20 day MA, and +0.69% above its 50 day MA (signal line). Hence a very neutral position still, with the status changing to a Neutral Environment as it closes between the two moving averages.
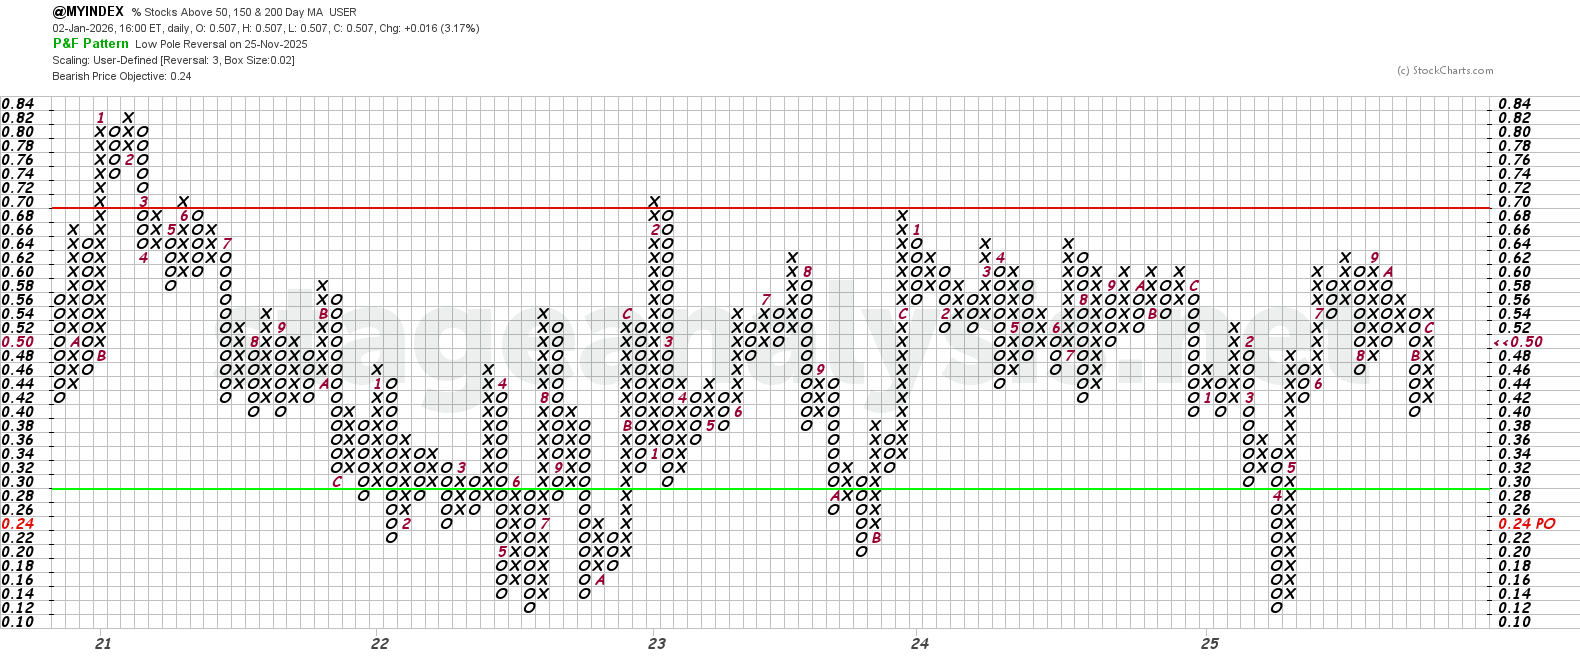
The Point and Figure (P&F) chart (shown above) was unchanged again the current column of Xs. So the P&F strategy remains on Offense (as it is in a column of Xs) and P&F Low Pole Reversal status in the middle of the field.
A close above 58% would be the next double top breakout position, and a close below 48% would be needed for a reversal from the current level.
See the Bullish Percent article for more information on the P&F statuses.
Become a Stage Analysis Member:
To see more like this – US Stocks watchlist posts, detailed videos each weekend, use our unique Stage Analysis tools, such as the US Stocks & ETFs Screener, Charts, Market Breadth, Group Relative Strength and more...
Join Today
Disclaimer: For educational purpose only. Not investment advice. Seek professional advice from a financial advisor before making any investing decisions.