
Market Breadth: Percentage of Stocks Above their 50 Day, 150 Day & 200 Day Moving Averages Combined
The full post is available to view by members only. For immediate access:
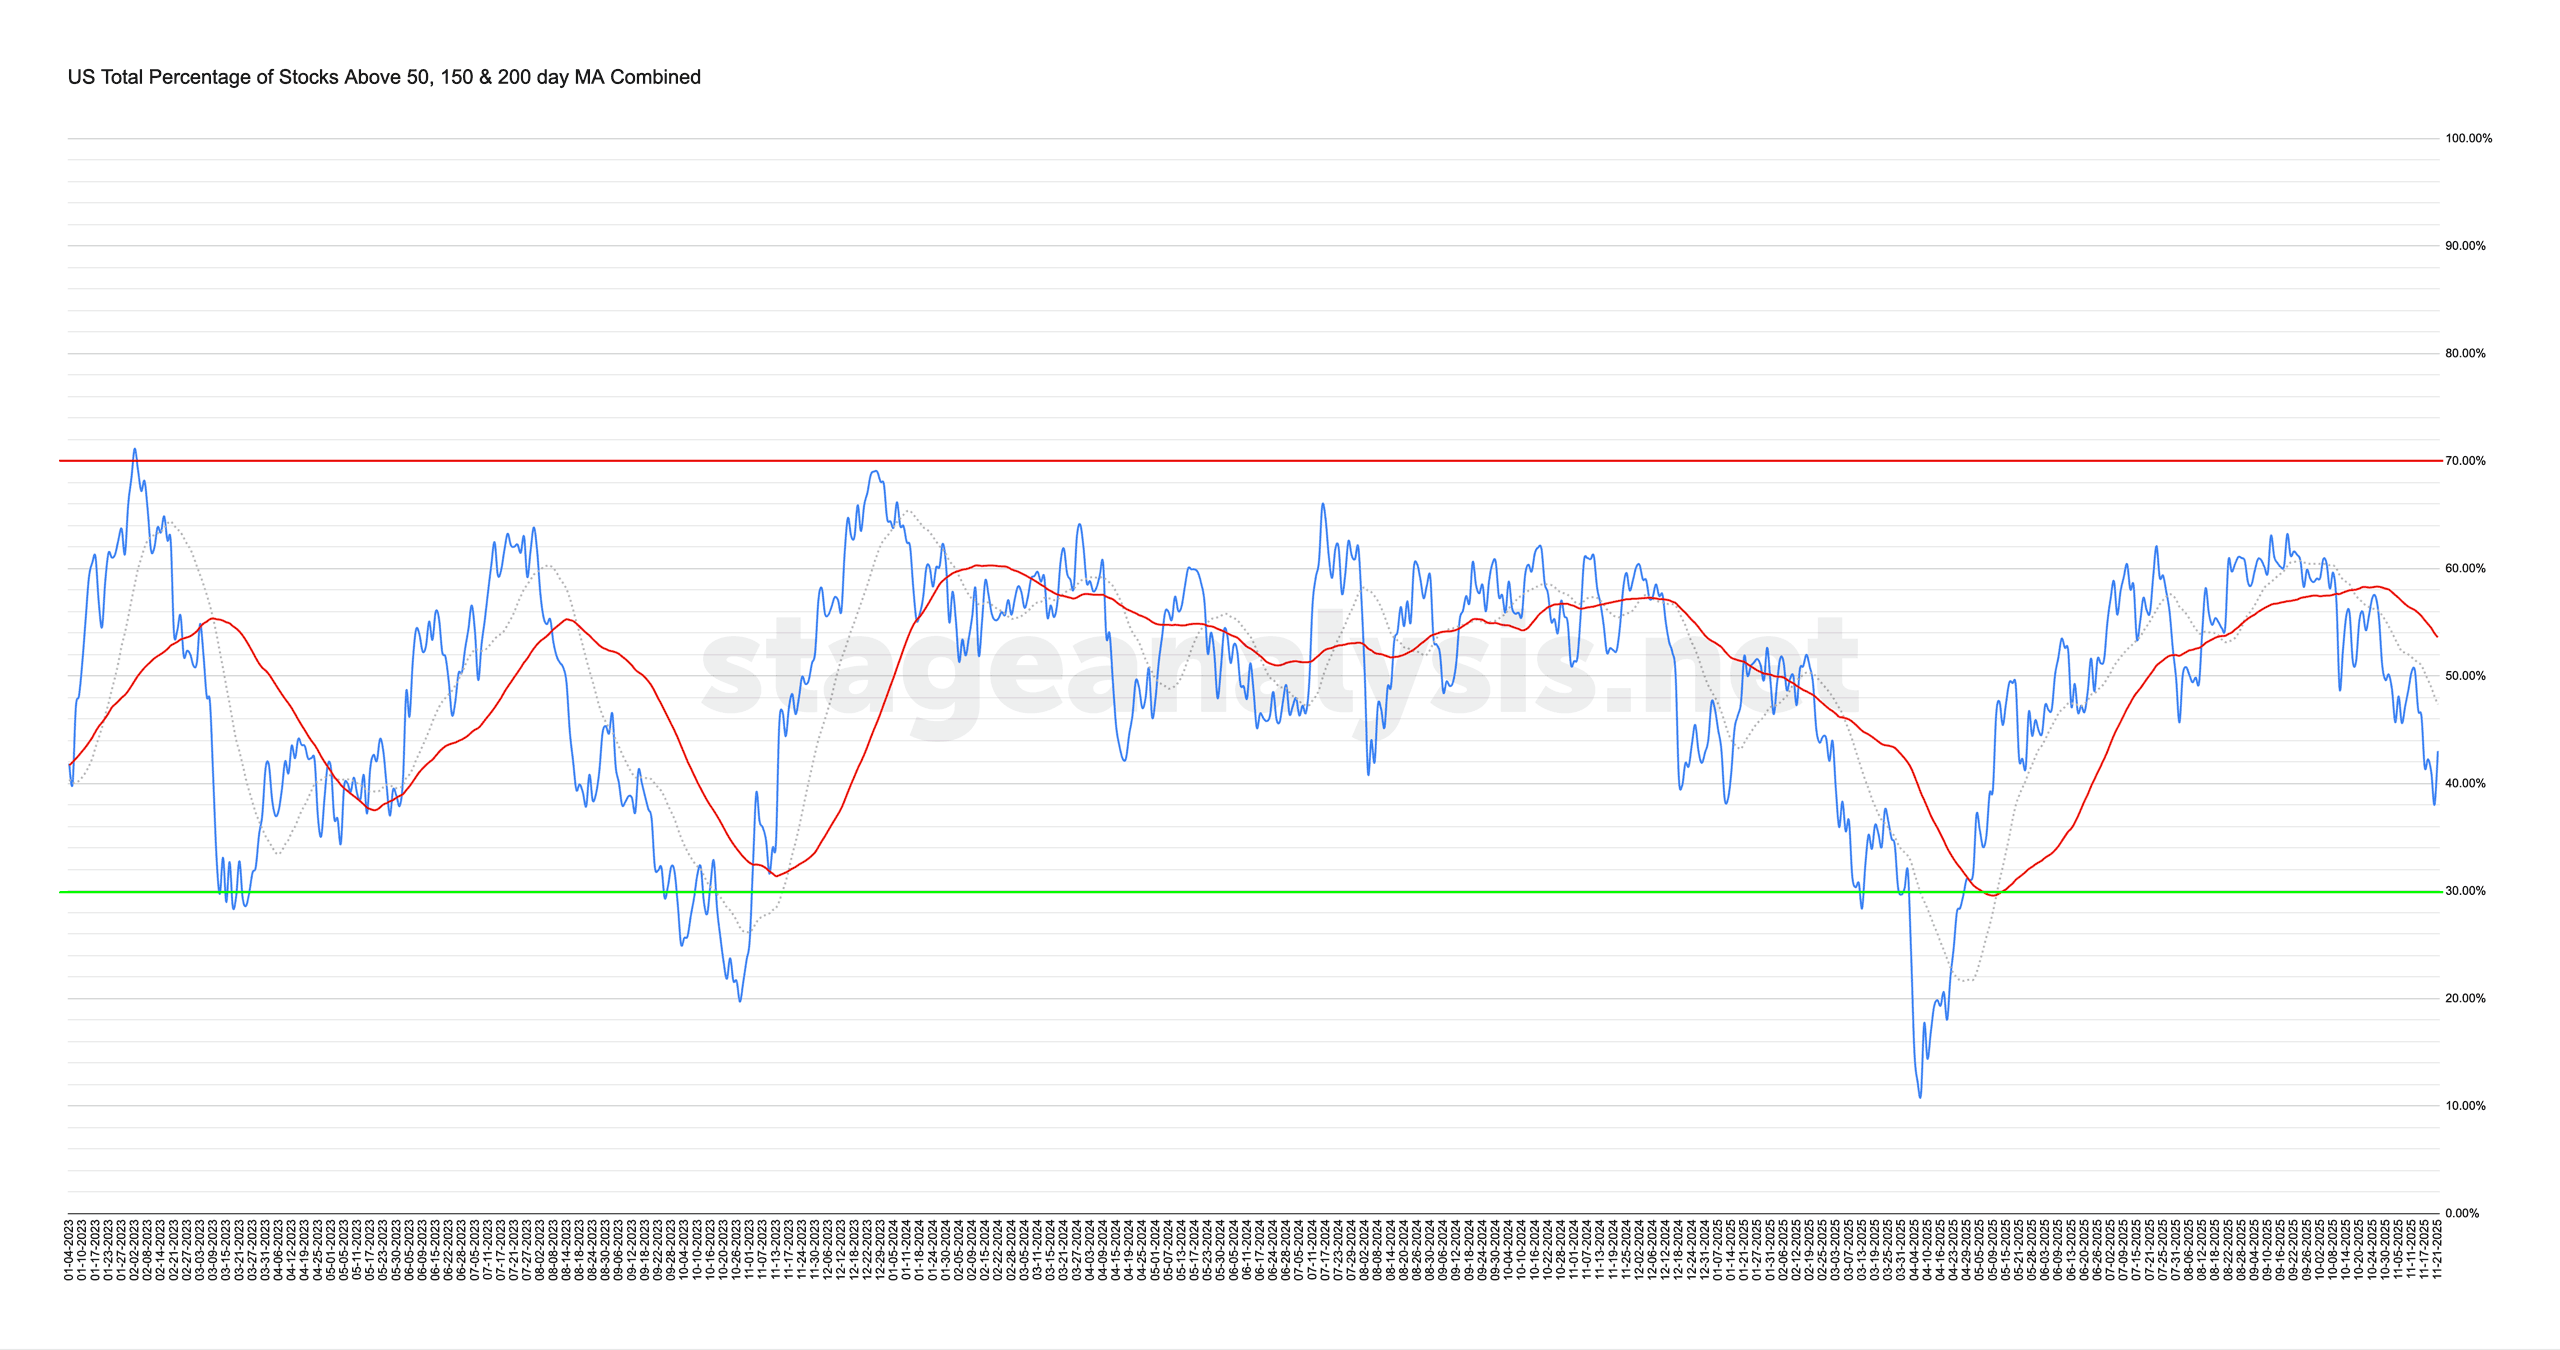
43.02% (-3.21% 1wk)
Status: Difficult Environment
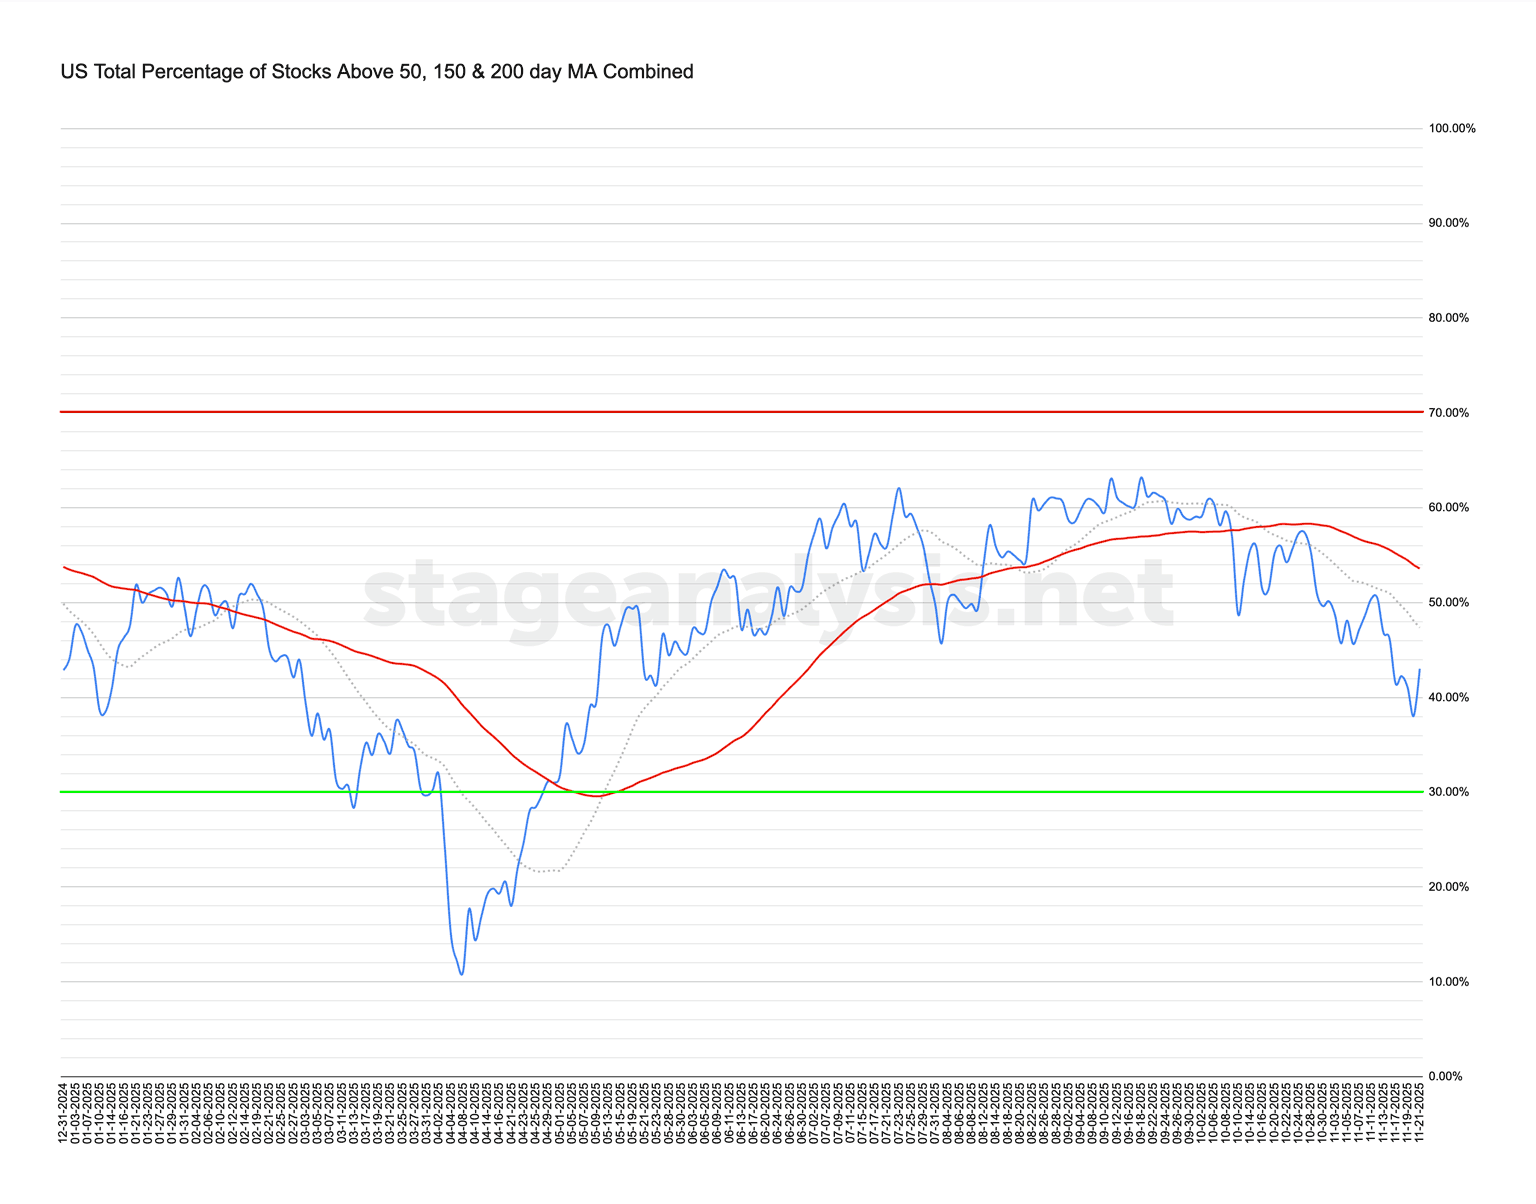
The US Total Percentage of Stocks above their 50 Day, 150 Day & 200 Day Moving Averages (shown above) decreased by -3.21% this week.
Therefore, the overall combined average is at 43.02% in the US market (NYSE and Nasdaq markets combined) above their short, medium and long term moving averages.
The combined average sold off during the week, dropping below the 40% level on Thursday, but rebounded strongly on Friday to recover most of the weeks losses. So it ended the week at -4.34% below its short-term 20 day MA, and -10.58% below its 50 day MA (signal line). Hence the status remains on a Difficult Environment status again to start the new week, but with a rebound attempt underway.
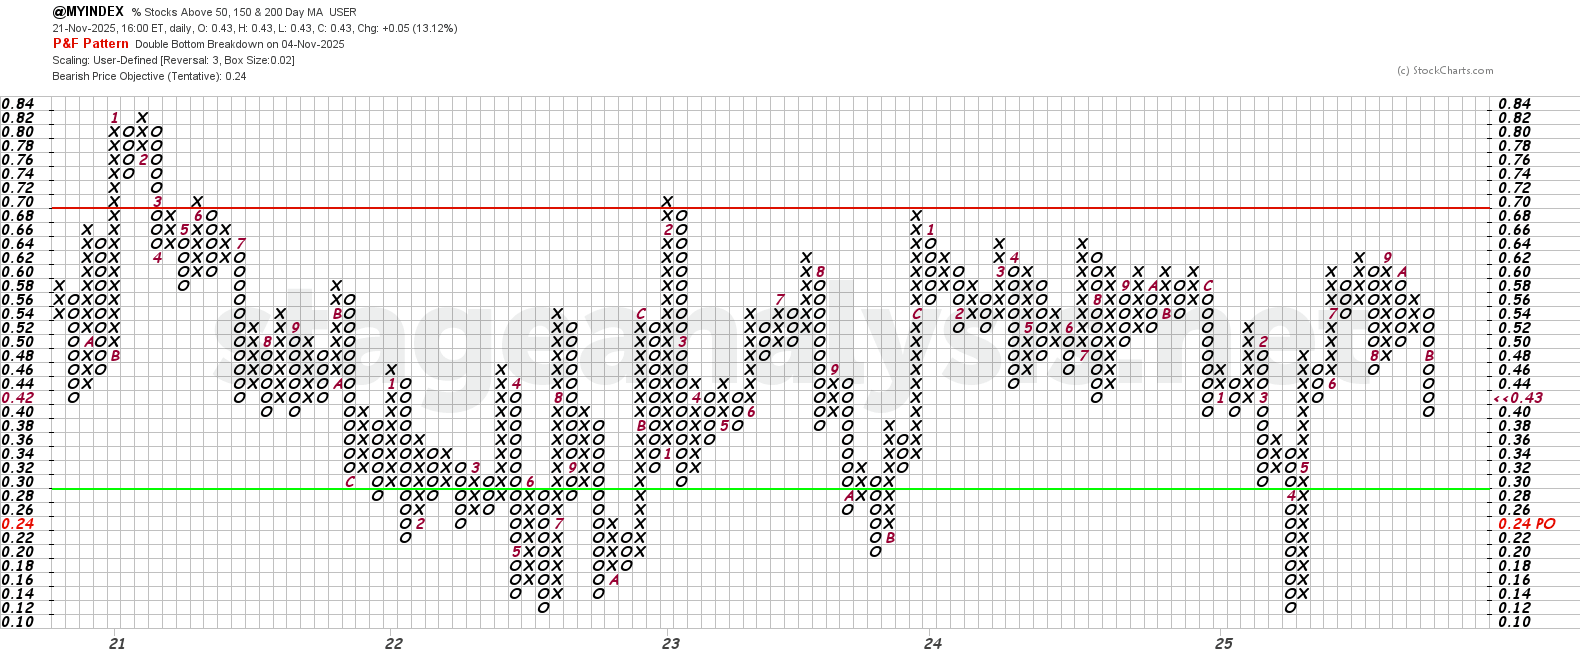
The Point and Figure (P&F) chart (shown above) declined by a further three Os. So the P&F strategy remains on Defense (as it is in a column of Os) and P&F Bear Confirmed status in the lower-middle of the field.
To reverse to a column of Xs and offense, it needs to close above the 46% level currently.
See the Bullish Percent article for more information on the P&F statuses.
Become a Stage Analysis Member:
To see more like this – US Stocks watchlist posts, detailed videos each weekend, use our unique Stage Analysis tools, such as the US Stocks & ETFs Screener, Charts, Market Breadth, Group Relative Strength and more...
Join Today
Disclaimer: For educational purpose only. Not investment advice. Seek professional advice from a financial advisor before making any investing decisions.