
Market Breadth: Percentage of Stocks Above their 50 Day, 150 Day & 200 Day Moving Averages Combined
The full post is available to view by members only. For immediate access:
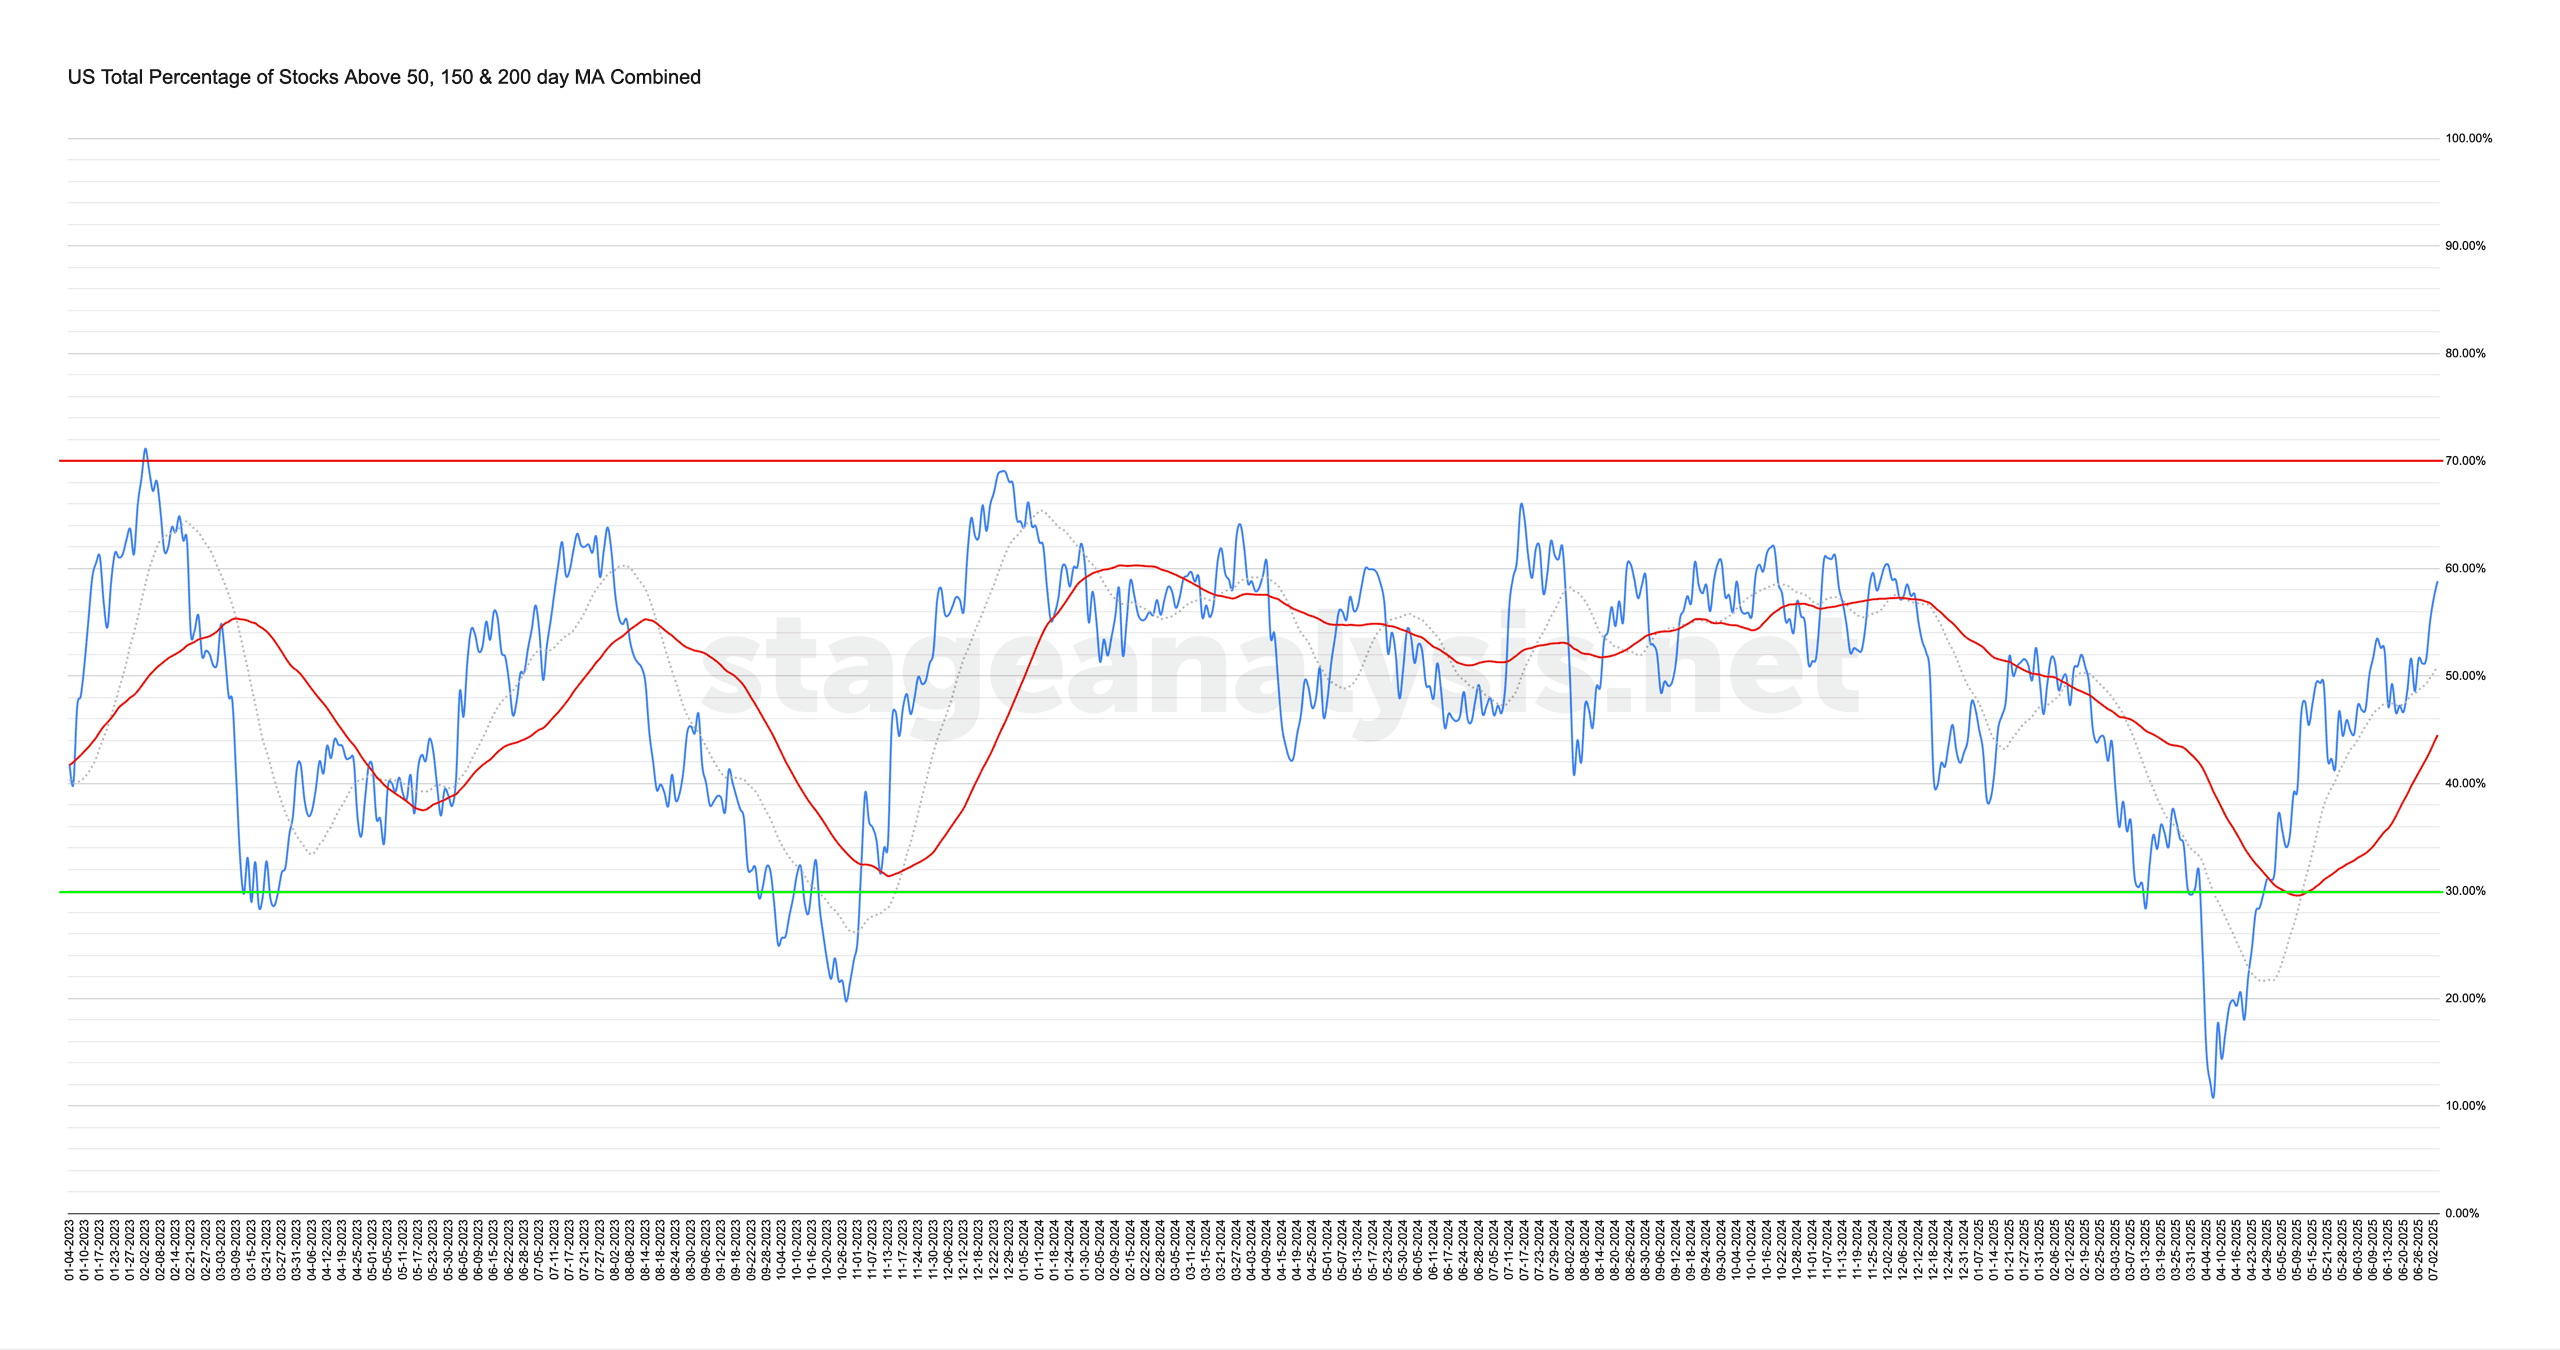
58.83% (+7.66% 1wk)
Status: Positive Environment
The US Total Percentage of Stocks above their 50 Day, 150 Day & 200 Day Moving Averages (shown above) increased by +7.66% this week.
Therefore, the overall combined average is at 58.83% in the US market (NYSE and Nasdaq markets combined) above their short, medium and long term moving averages.
The combined average has strengthened by +12.18% in the last few weeks, moving strongly above its short-term 20 day MA by +7.91% and +14.33% above its 50 day MA (signal line). So the status is currently on a Positive Environment status, and approaching the Strong range (60%+) for the first time this year.
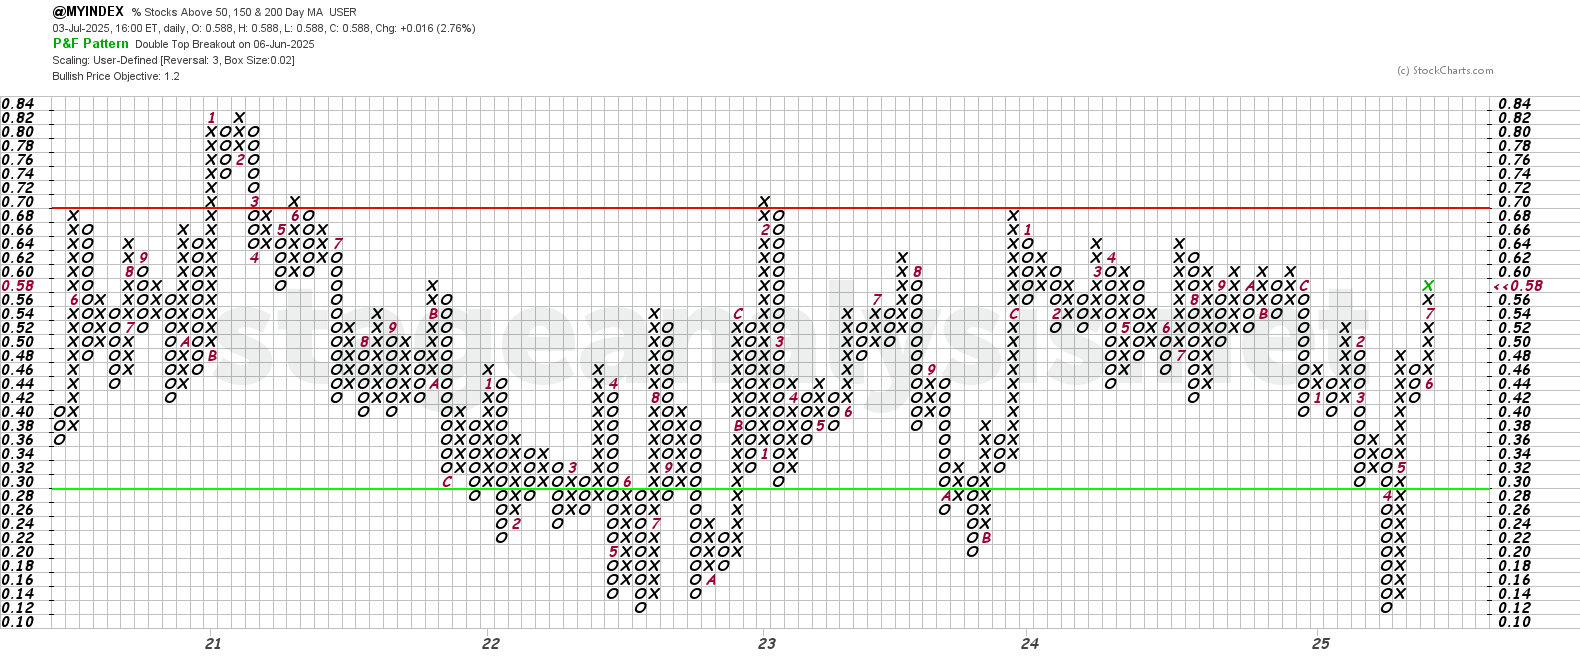
The Point and Figure (P&F) chart (shown above) has improved over the last few weeks, adding a further 3Xs to the current column of Xs. So the P&F strategy remains on Offense (as it is in a column of Xs), and P&F Bull Confirmed status in the upper-middle of the field.
See the Bullish Percent article for more information on the P&F statuses.
Become a Stage Analysis Member:
To see more like this – US Stocks watchlist posts, detailed videos each weekend, use our unique Stage Analysis tools, such as the US Stocks & ETFs Screener, Charts, Market Breadth, Group Relative Strength and more...
Join Today
Disclaimer: For educational purpose only. Not investment advice. Seek professional advice from a financial advisor before making any investing decisions.