
Market Breadth: Percentage of Stocks Above their 50 Day, 150 Day & 200 Day Moving Averages Combined
The full post is available to view by members only. For immediate access:
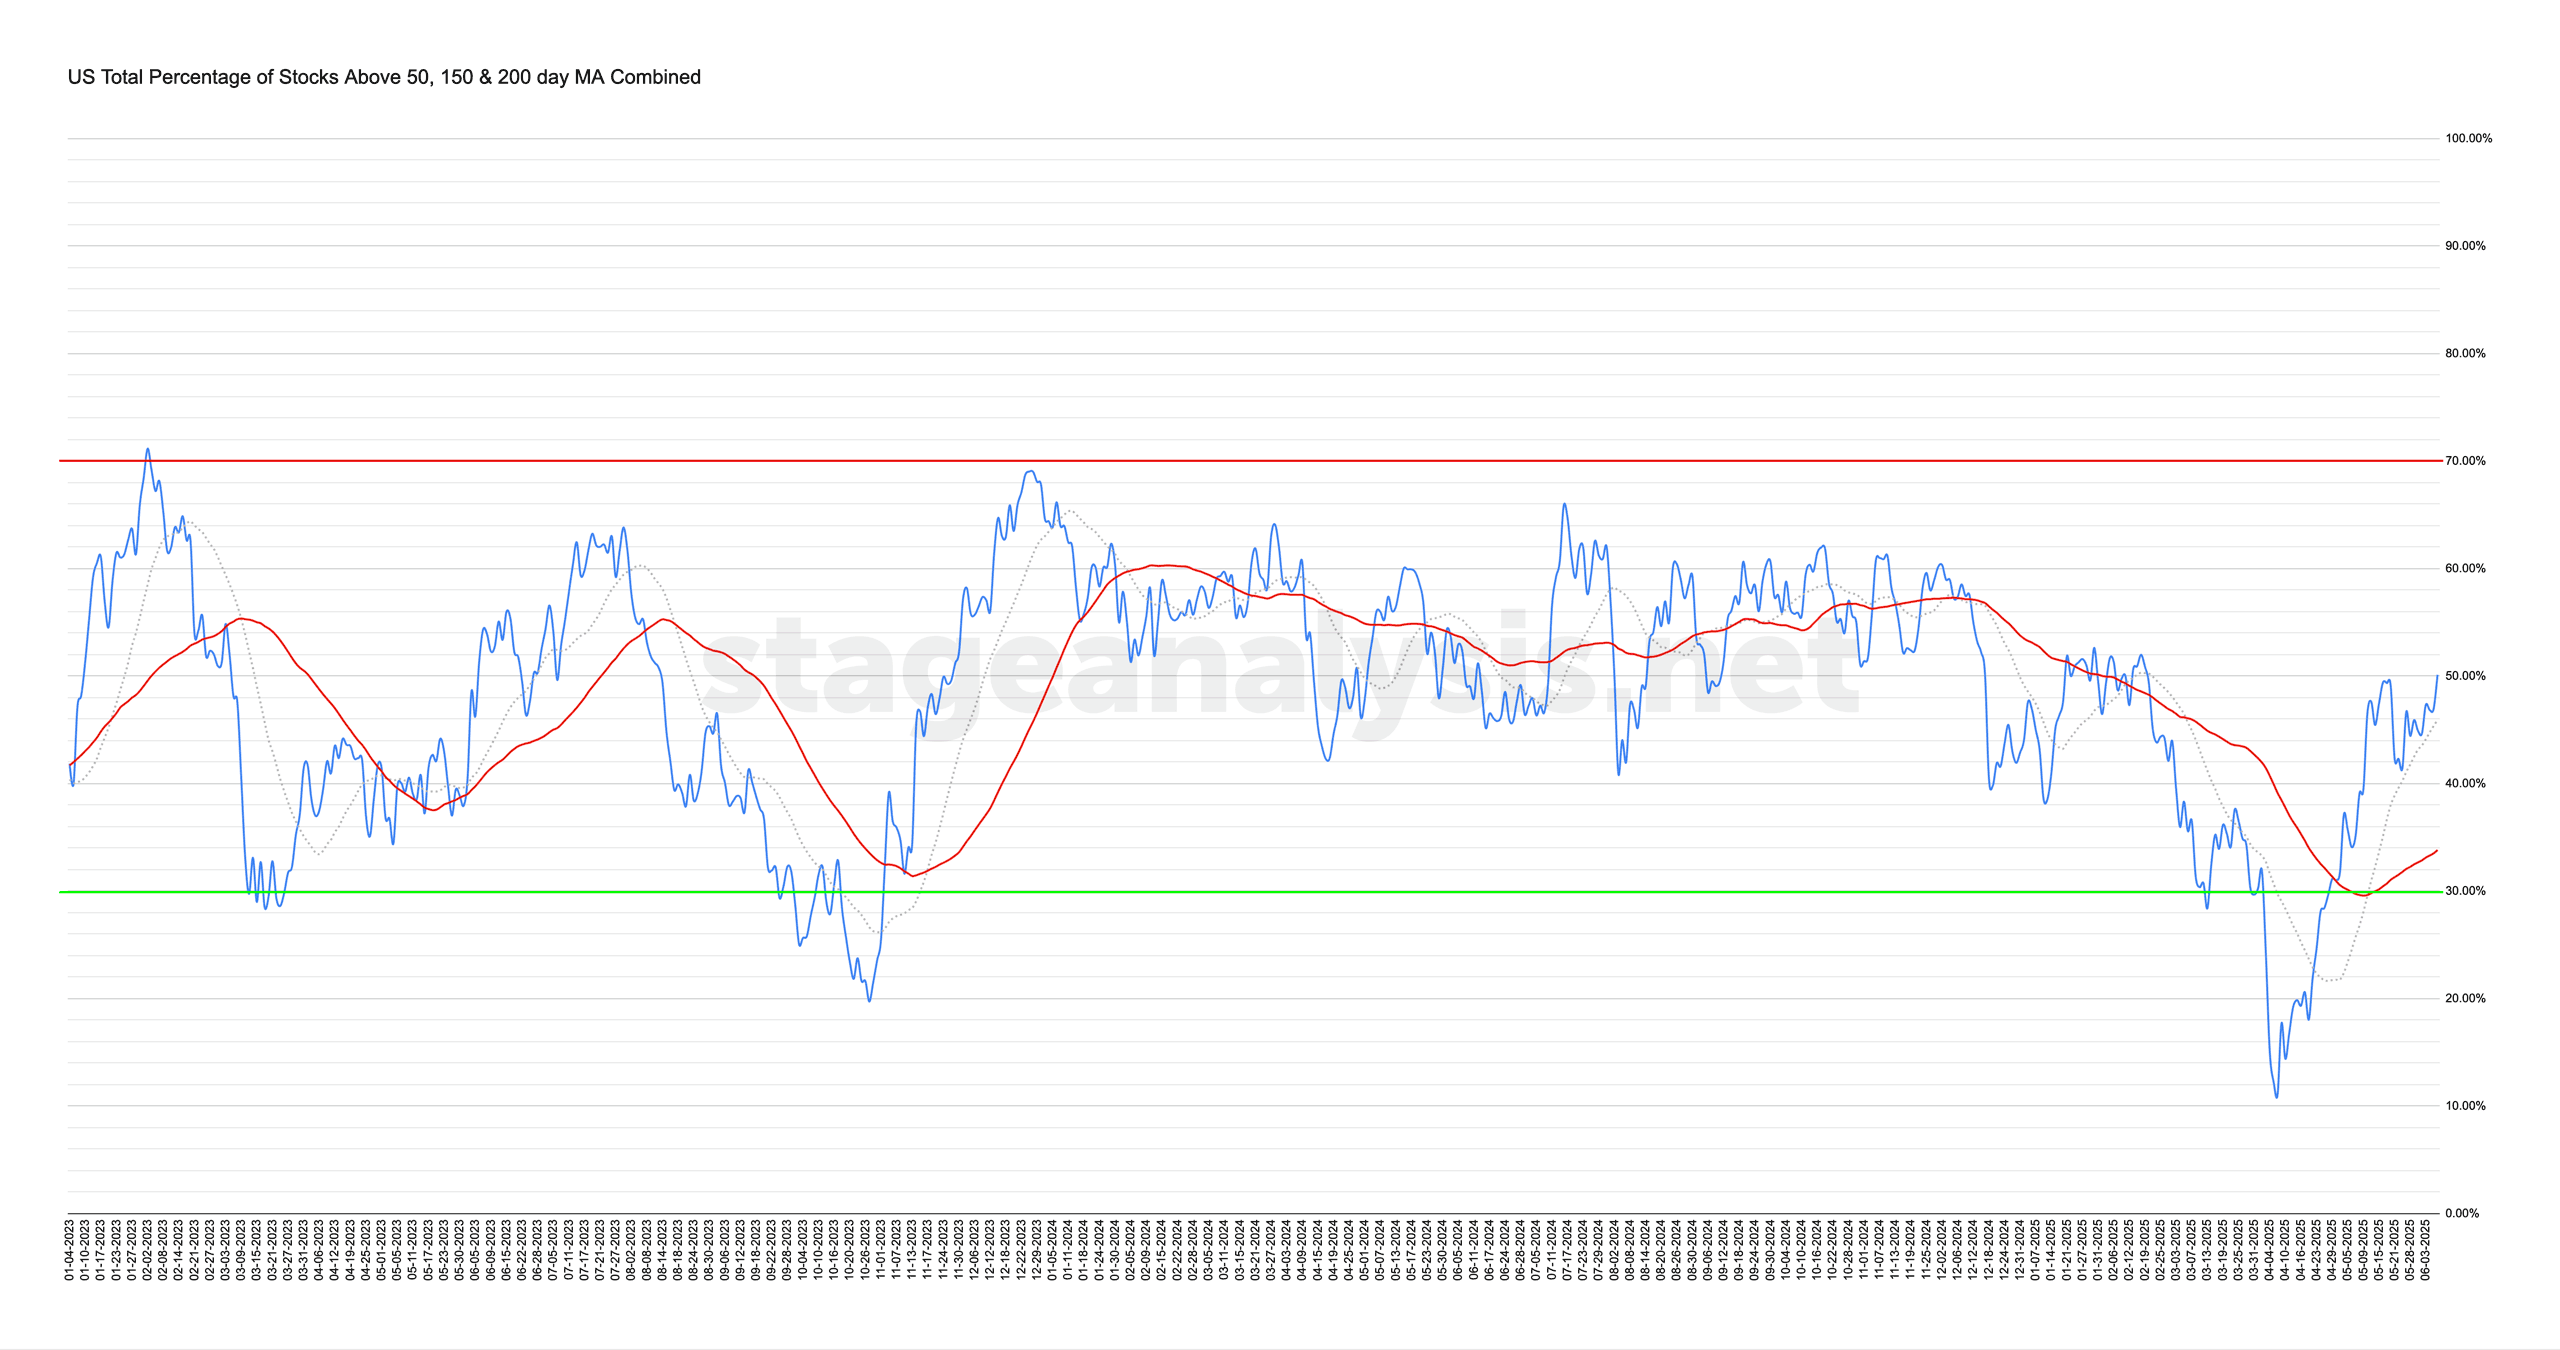
50.12% (+5.21% 1wk)
Status: Positive Environment
The US Total Percentage of Stocks above their 50 Day, 150 Day & 200 Day Moving Averages (shown above) increased by +5.21% this week.
Therefore, the overall combined average is at 50.12% in the US market (NYSE and Nasdaq markets combined) above their short, medium and long term moving averages.
The combined average broke out above the top of the recent range at the end of the week and closed +4.22% above its short-term 20 day MA, and +16.31% above its 50 day MA (signal line). And so it remains on Positive Environment status to start the new week, with the Nasdaq 100 and S&P 500 both making new Stage 2 breakout attempts.
So a healthy overall field position for the moving average breadth and the major indexes attempting to move into early Stage 2, which are also just a few percent or so below their all time highs.
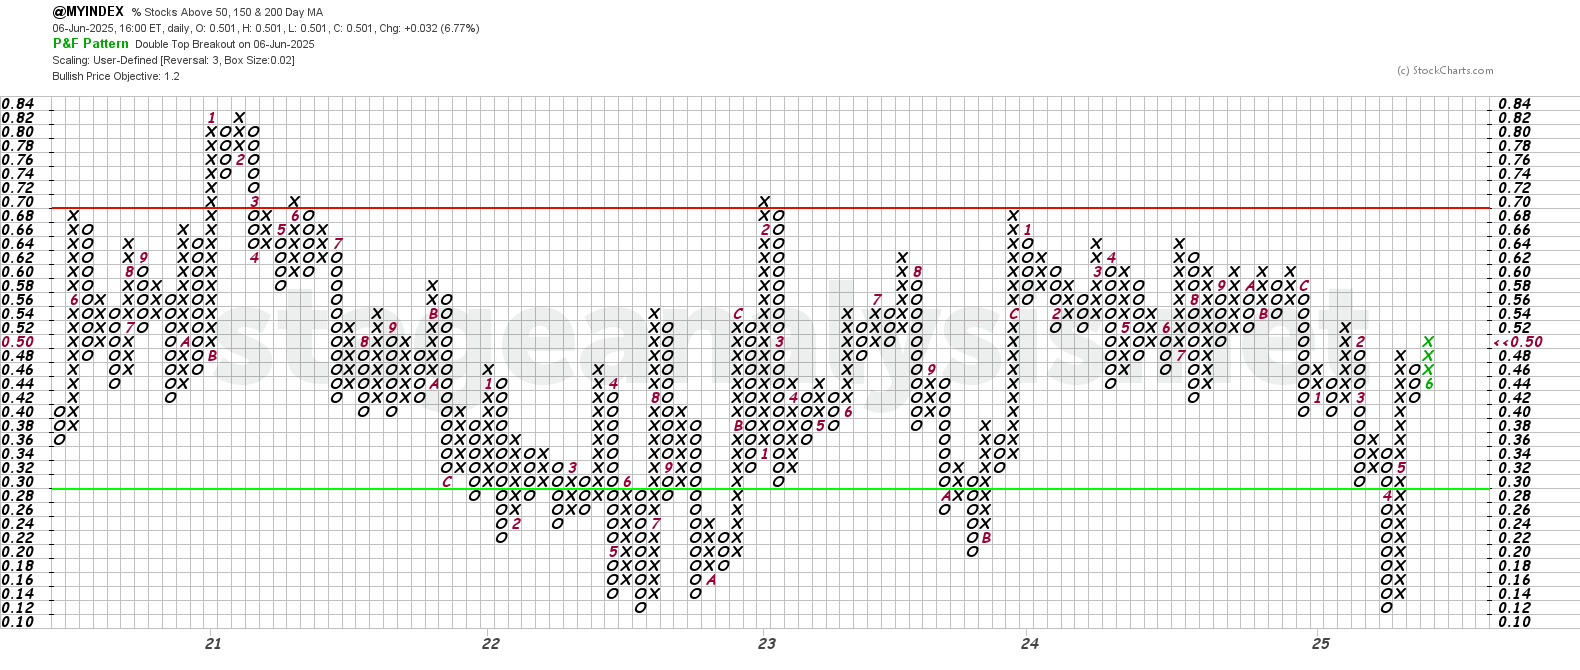
The Point and Figure (P&F) chart (shown above) reversed higher on Friday into a column of Xs, making a further double top breakout. So the P&F strategy changes back to Offense (as it is in a column of Xs), and to P&F Bull Confirmed status in the middle of the field. Which is a very neutral overall field position.
See the Bullish Percent article for more information on the P&F statuses.
Become a Stage Analysis Member:
To see more like this – US Stocks watchlist posts, detailed videos each weekend, use our unique Stage Analysis tools, such as the US Stocks & ETFs Screener, Charts, Market Breadth, Group Relative Strength and more...
Join Today
Disclaimer: For educational purpose only. Not investment advice. Seek professional advice from a financial advisor before making any investing decisions.