
Market Breadth: Percentage of Stocks Above their 50 Day, 150 Day & 200 Day Moving Averages Combined
The full post is available to view by members only. For immediate access:
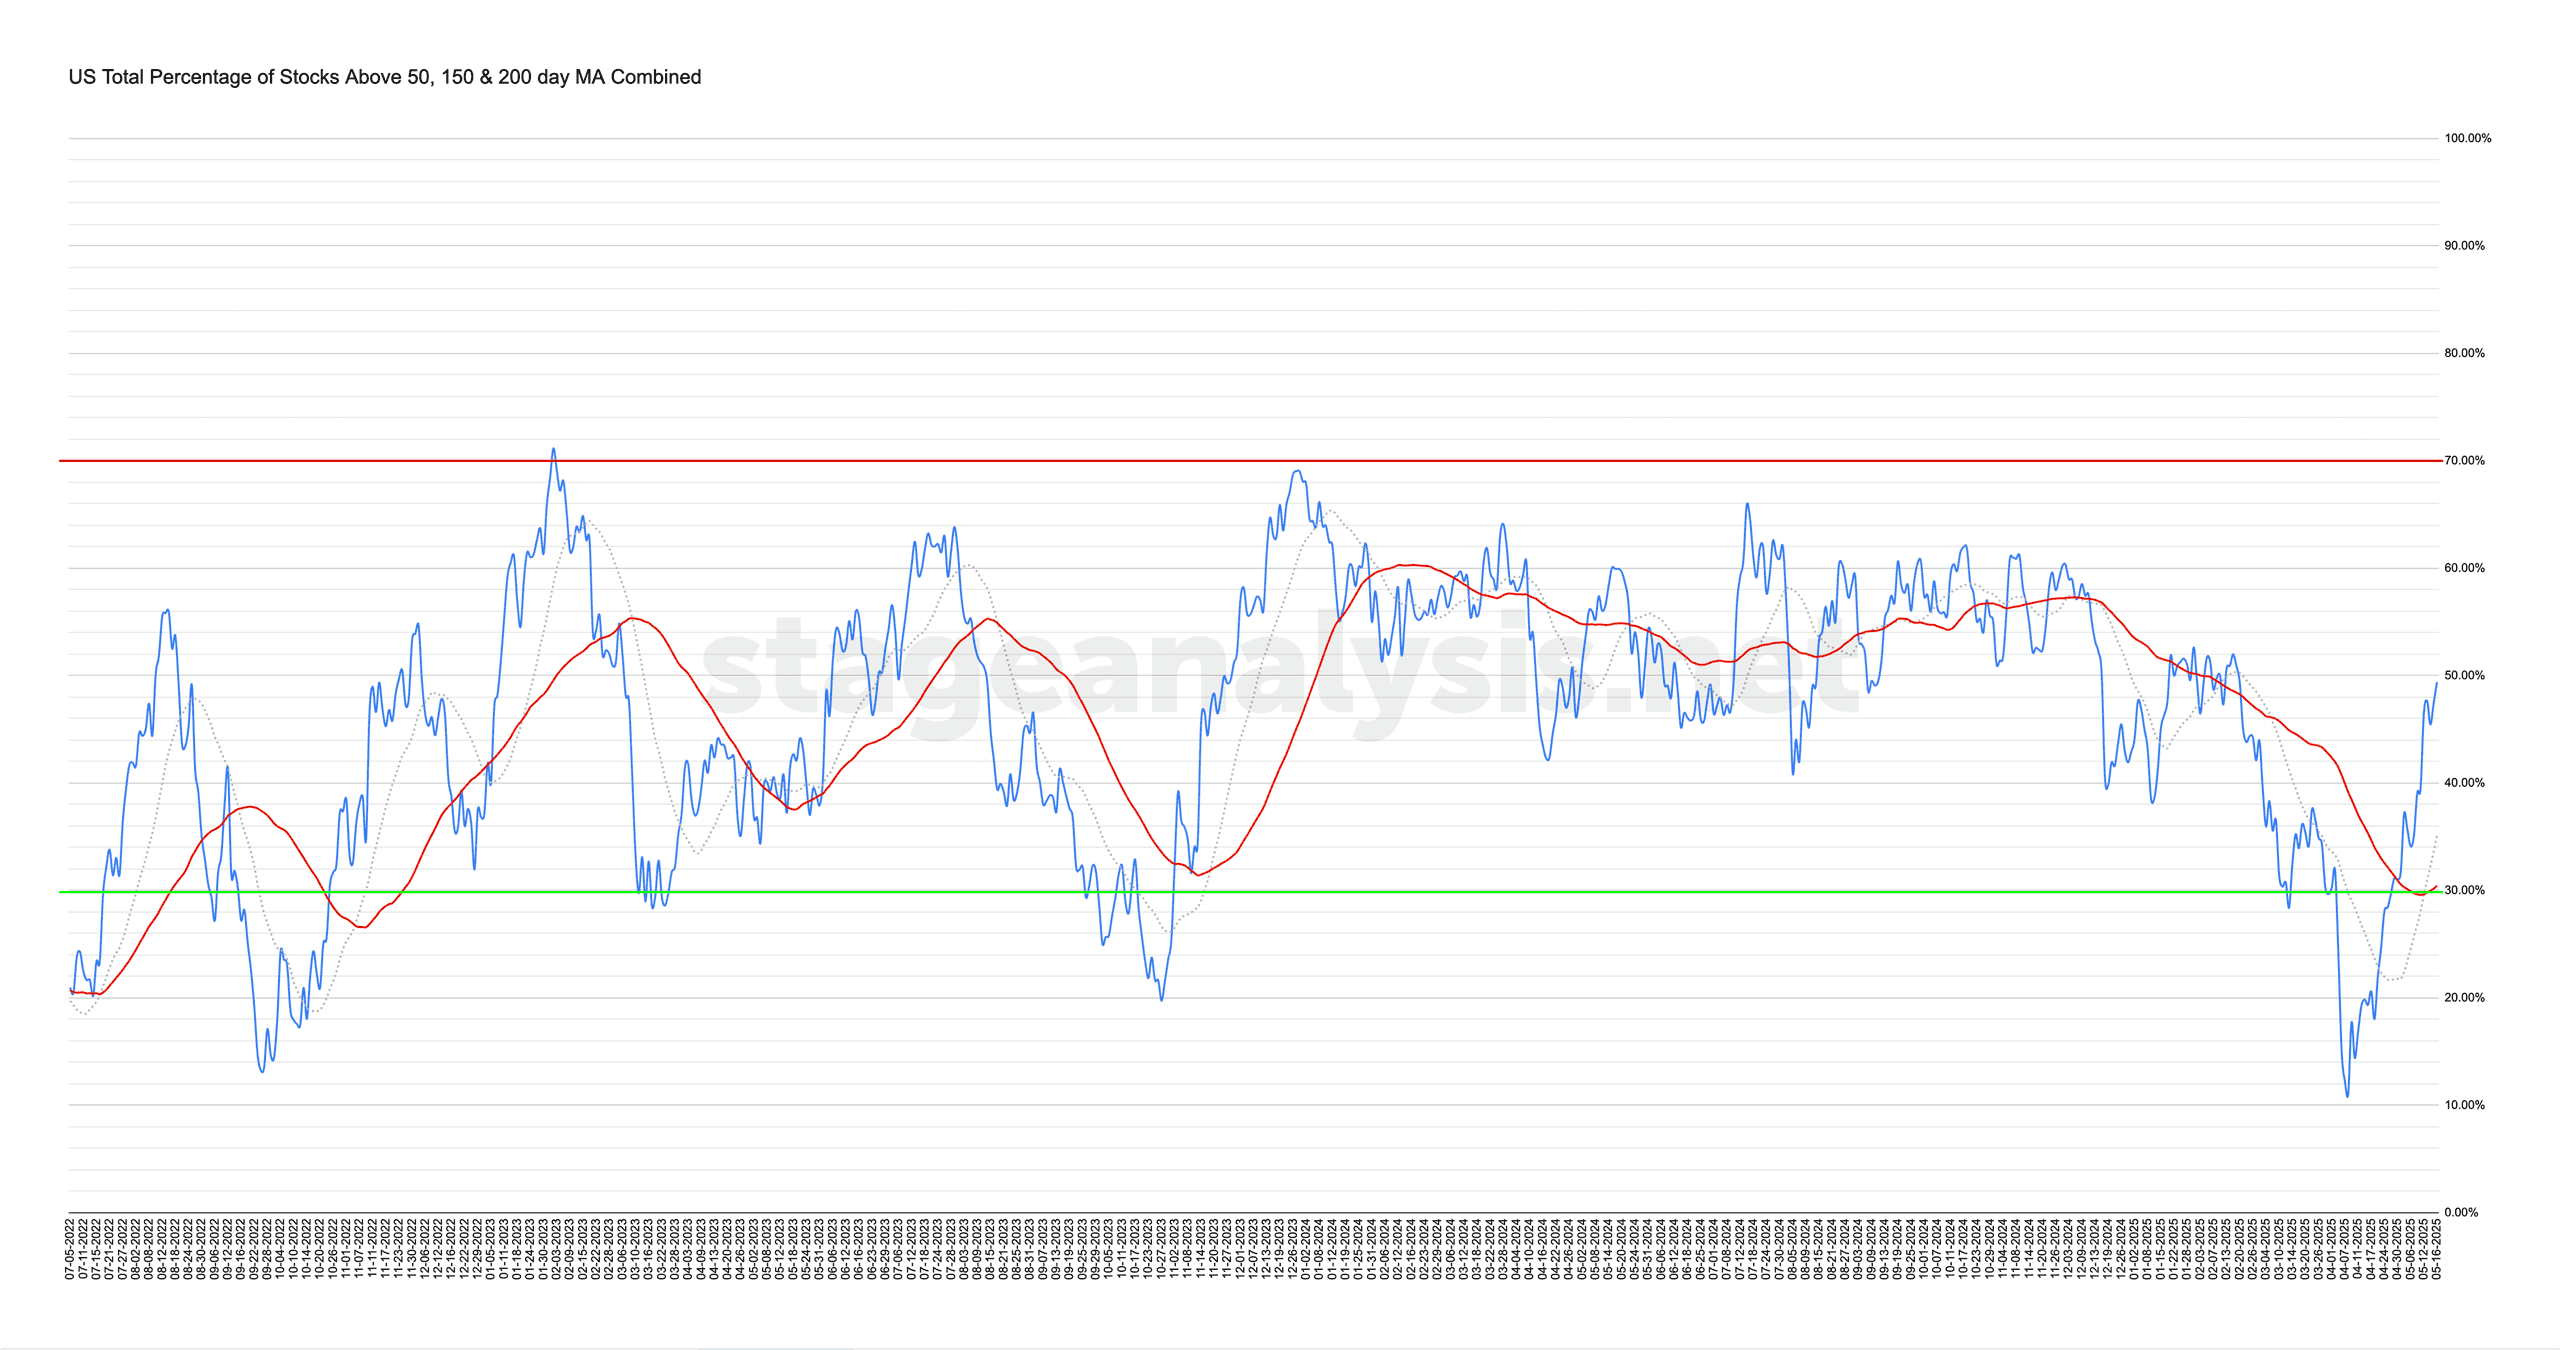
49.39% (+9.92% 1wk)
Status: Positive Environment
The US Total Percentage of Stocks above their 50 Day, 150 Day & 200 Day Moving Averages (shown above) increased by +9.92% this week.
Therefore, the overall combined average is at 49.39% in the US market (NYSE and Nasdaq markets combined) above their short, medium and long term moving averages.
The combined average gapped higher on Monday and held up during the week closing just under the 50% level and +14.31% above its shorter-term 20 day MA, and also improved to +18.95% above its 50 day MA (signal line). Hence, remains on the Positive Environment status currently, but moving into the upper extremes, in terms of distance from its key moving averages.
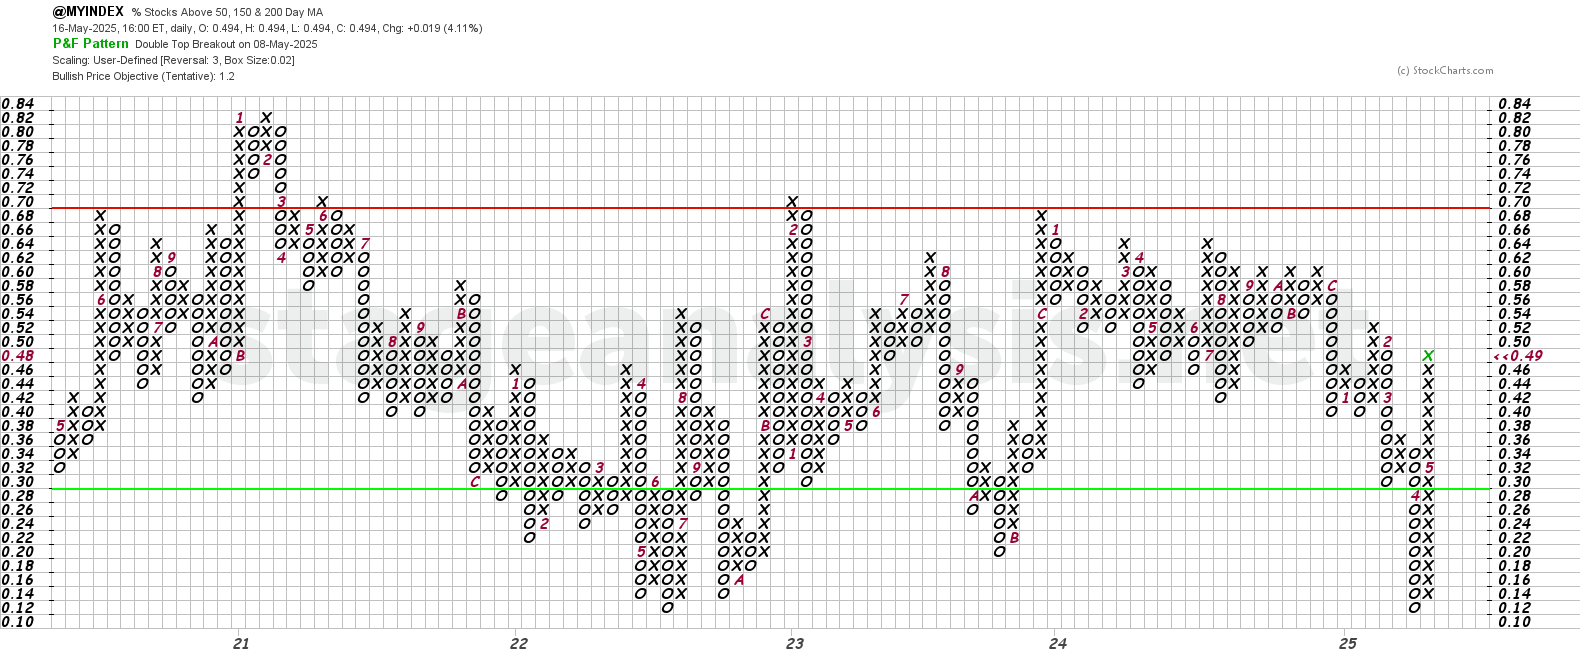
The Point and Figure (P&F) chart (shown above) added a further 5 Xs to its a column of Xs this week. So the P&F strategy remains on Offense (as it is in a column of Xs), and remains on P&F Bull Confirmed status in the middle of the field. So a very neutral overall field position.
See the Bullish Percent article for more information on the P&F statuses.
Become a Stage Analysis Member:
To see more like this – US Stocks watchlist posts, detailed videos each weekend, use our unique Stage Analysis tools, such as the US Stocks & ETFs Screener, Charts, Market Breadth, Group Relative Strength and more...
Join Today
Disclaimer: For educational purpose only. Not investment advice. Seek professional advice from a financial advisor before making any investing decisions.