
Percentage of Stocks Above their 50 Day, 150 Day & 200 Day Moving Averages Combined
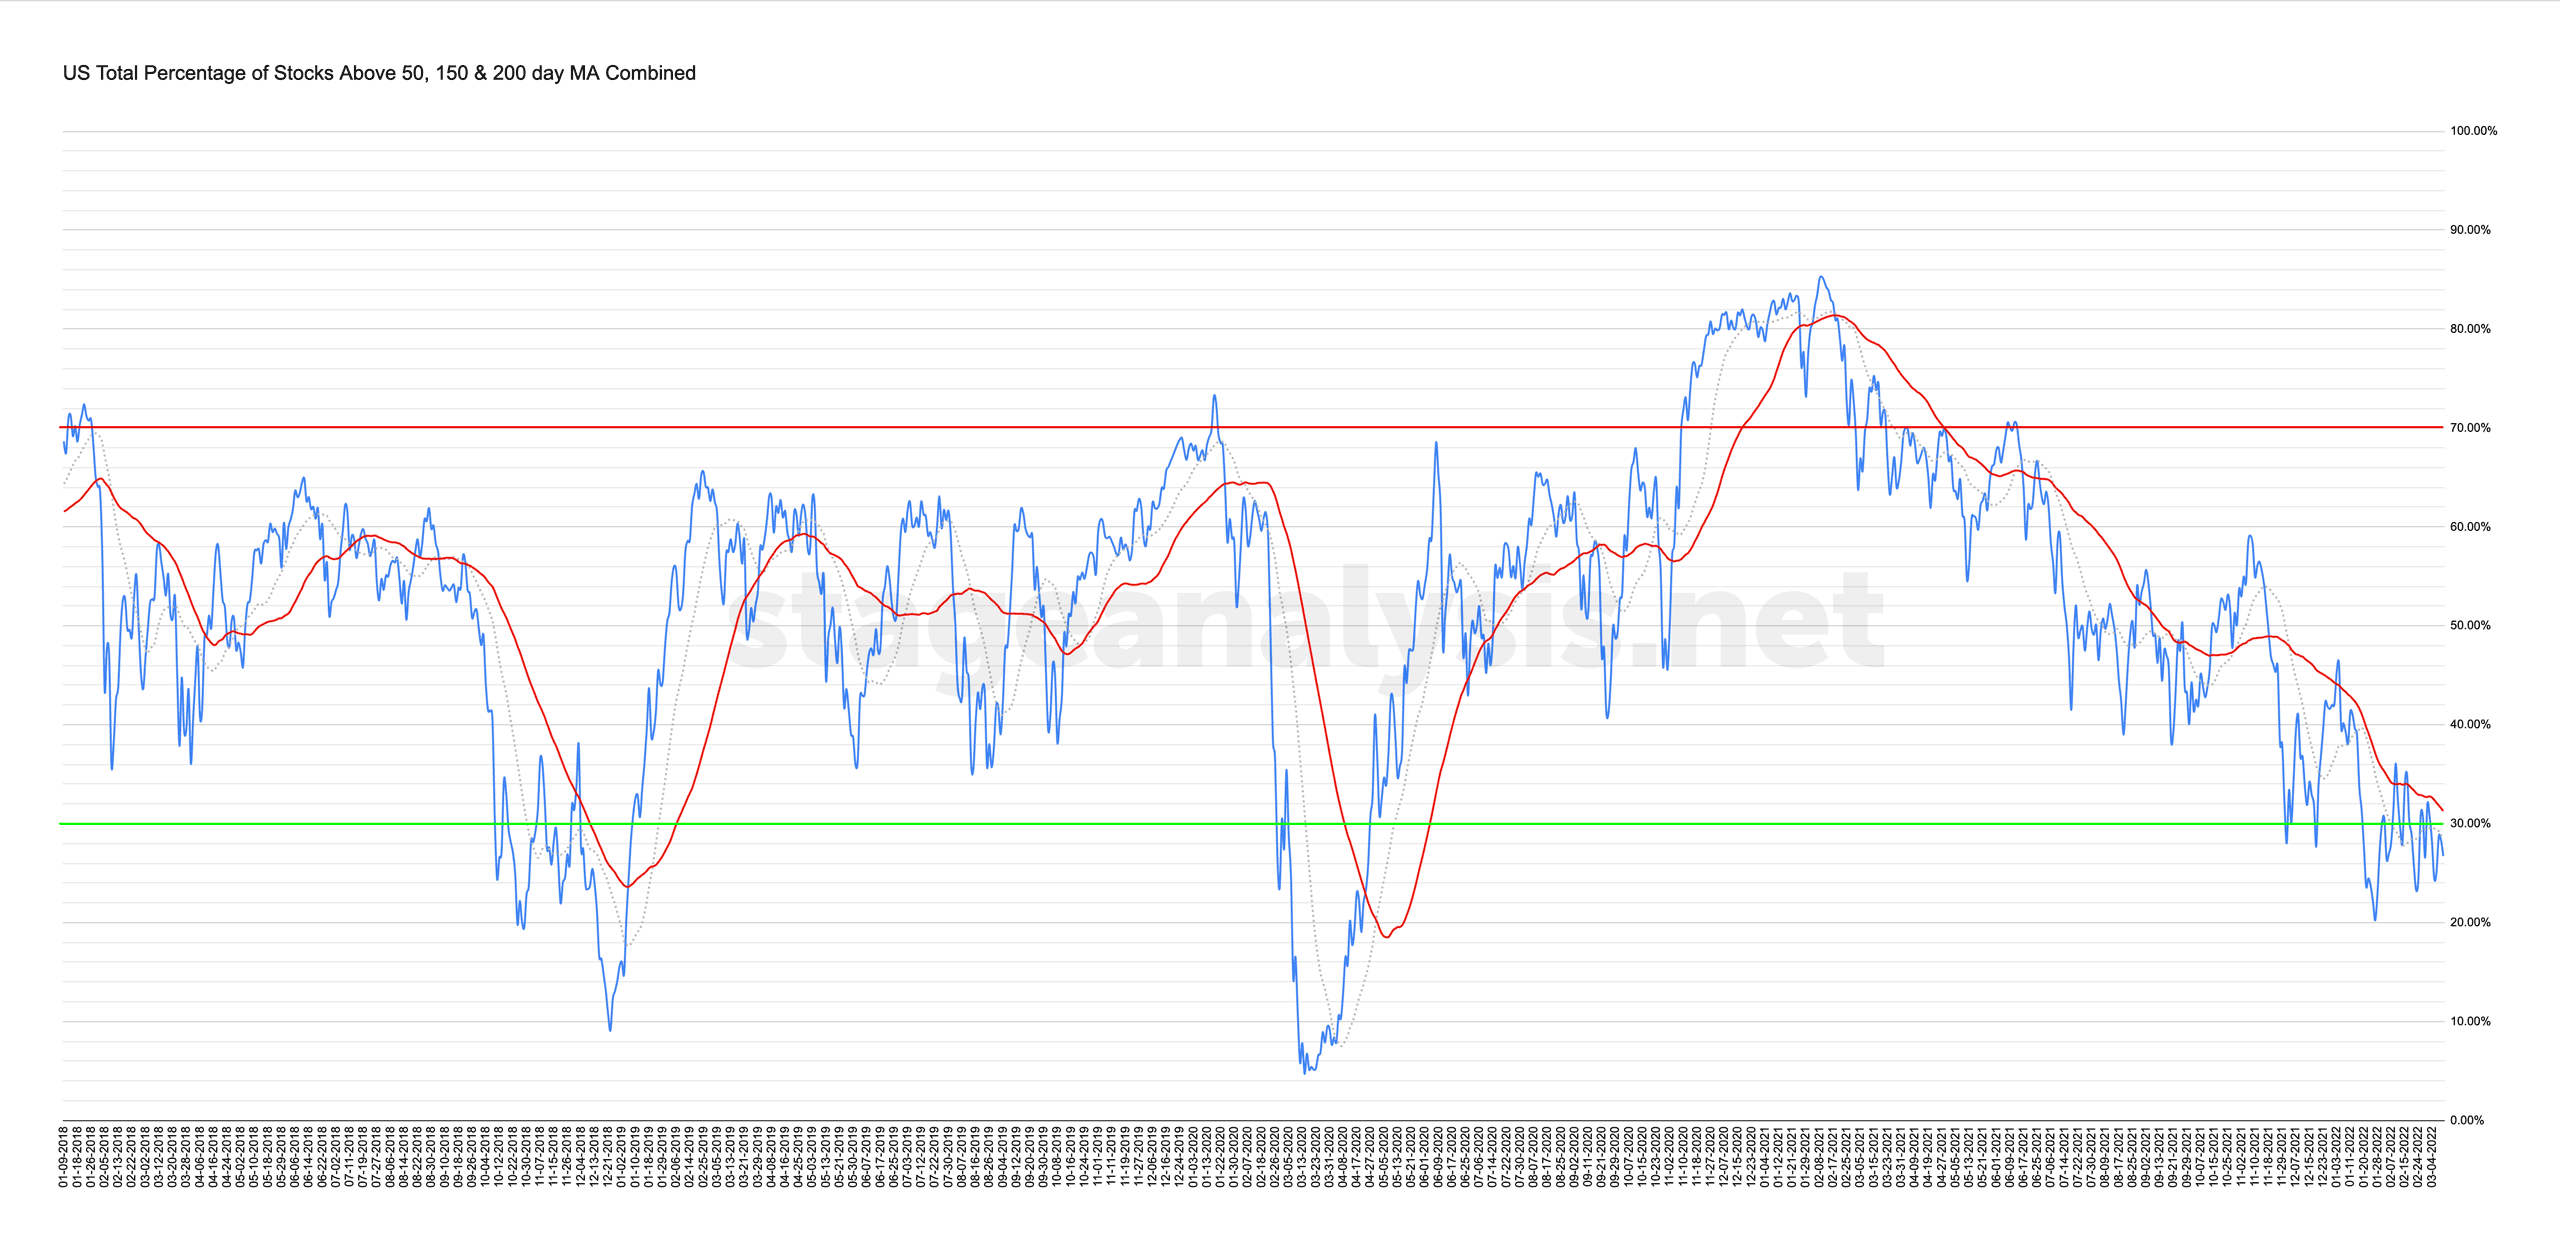
26.72% (-1.51% 1wk)
Status: Difficult Environment
The US Total Percentage of Stocks Above their 50 Day, 150 Day & 200 Day Moving Averages Combined chart continued to consolidate below its own 50 day MA – which is used as the signal line between a positive and difficult environment, and so remains on Difficult Environment status for another week.
Strategy: Defensive on longs / Progressive Exposure / High cash level / Shorting / Focus on Risk.
US Total % Above their 50 Day, 150 Day & 200 Day Moving Averages Combined Point and Figure Chart
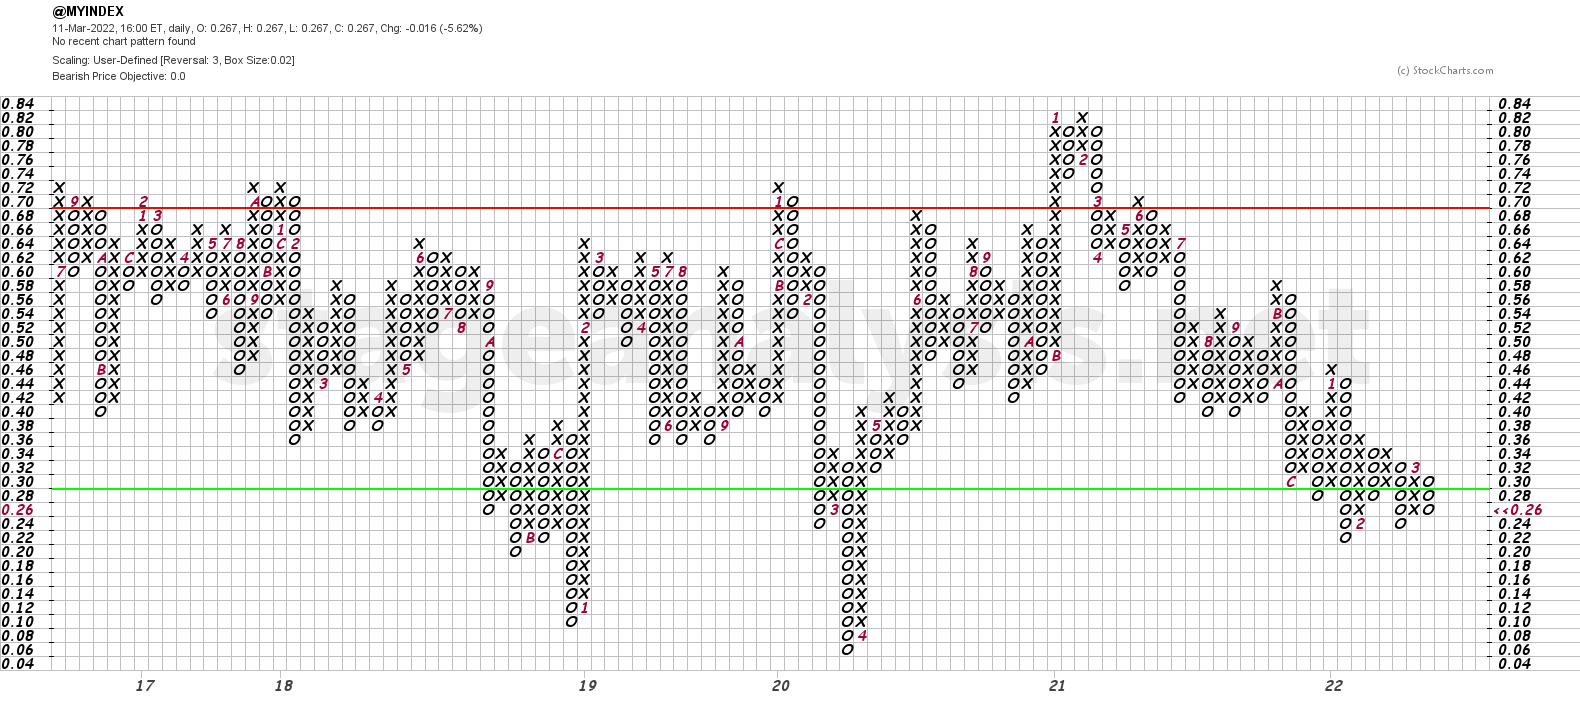
The P&F chart reversed back to a column of Os which suggests defense and the P&F status changes back to Bear Confirmed.
To change to Bull Alert is needs to reverse through the 32% level and would need to breakout above 34% to make a double top breakout and move to Bull Confirmed.
To learn more about the P&F breadth Statuses see the following article on the Bullish Percent Index
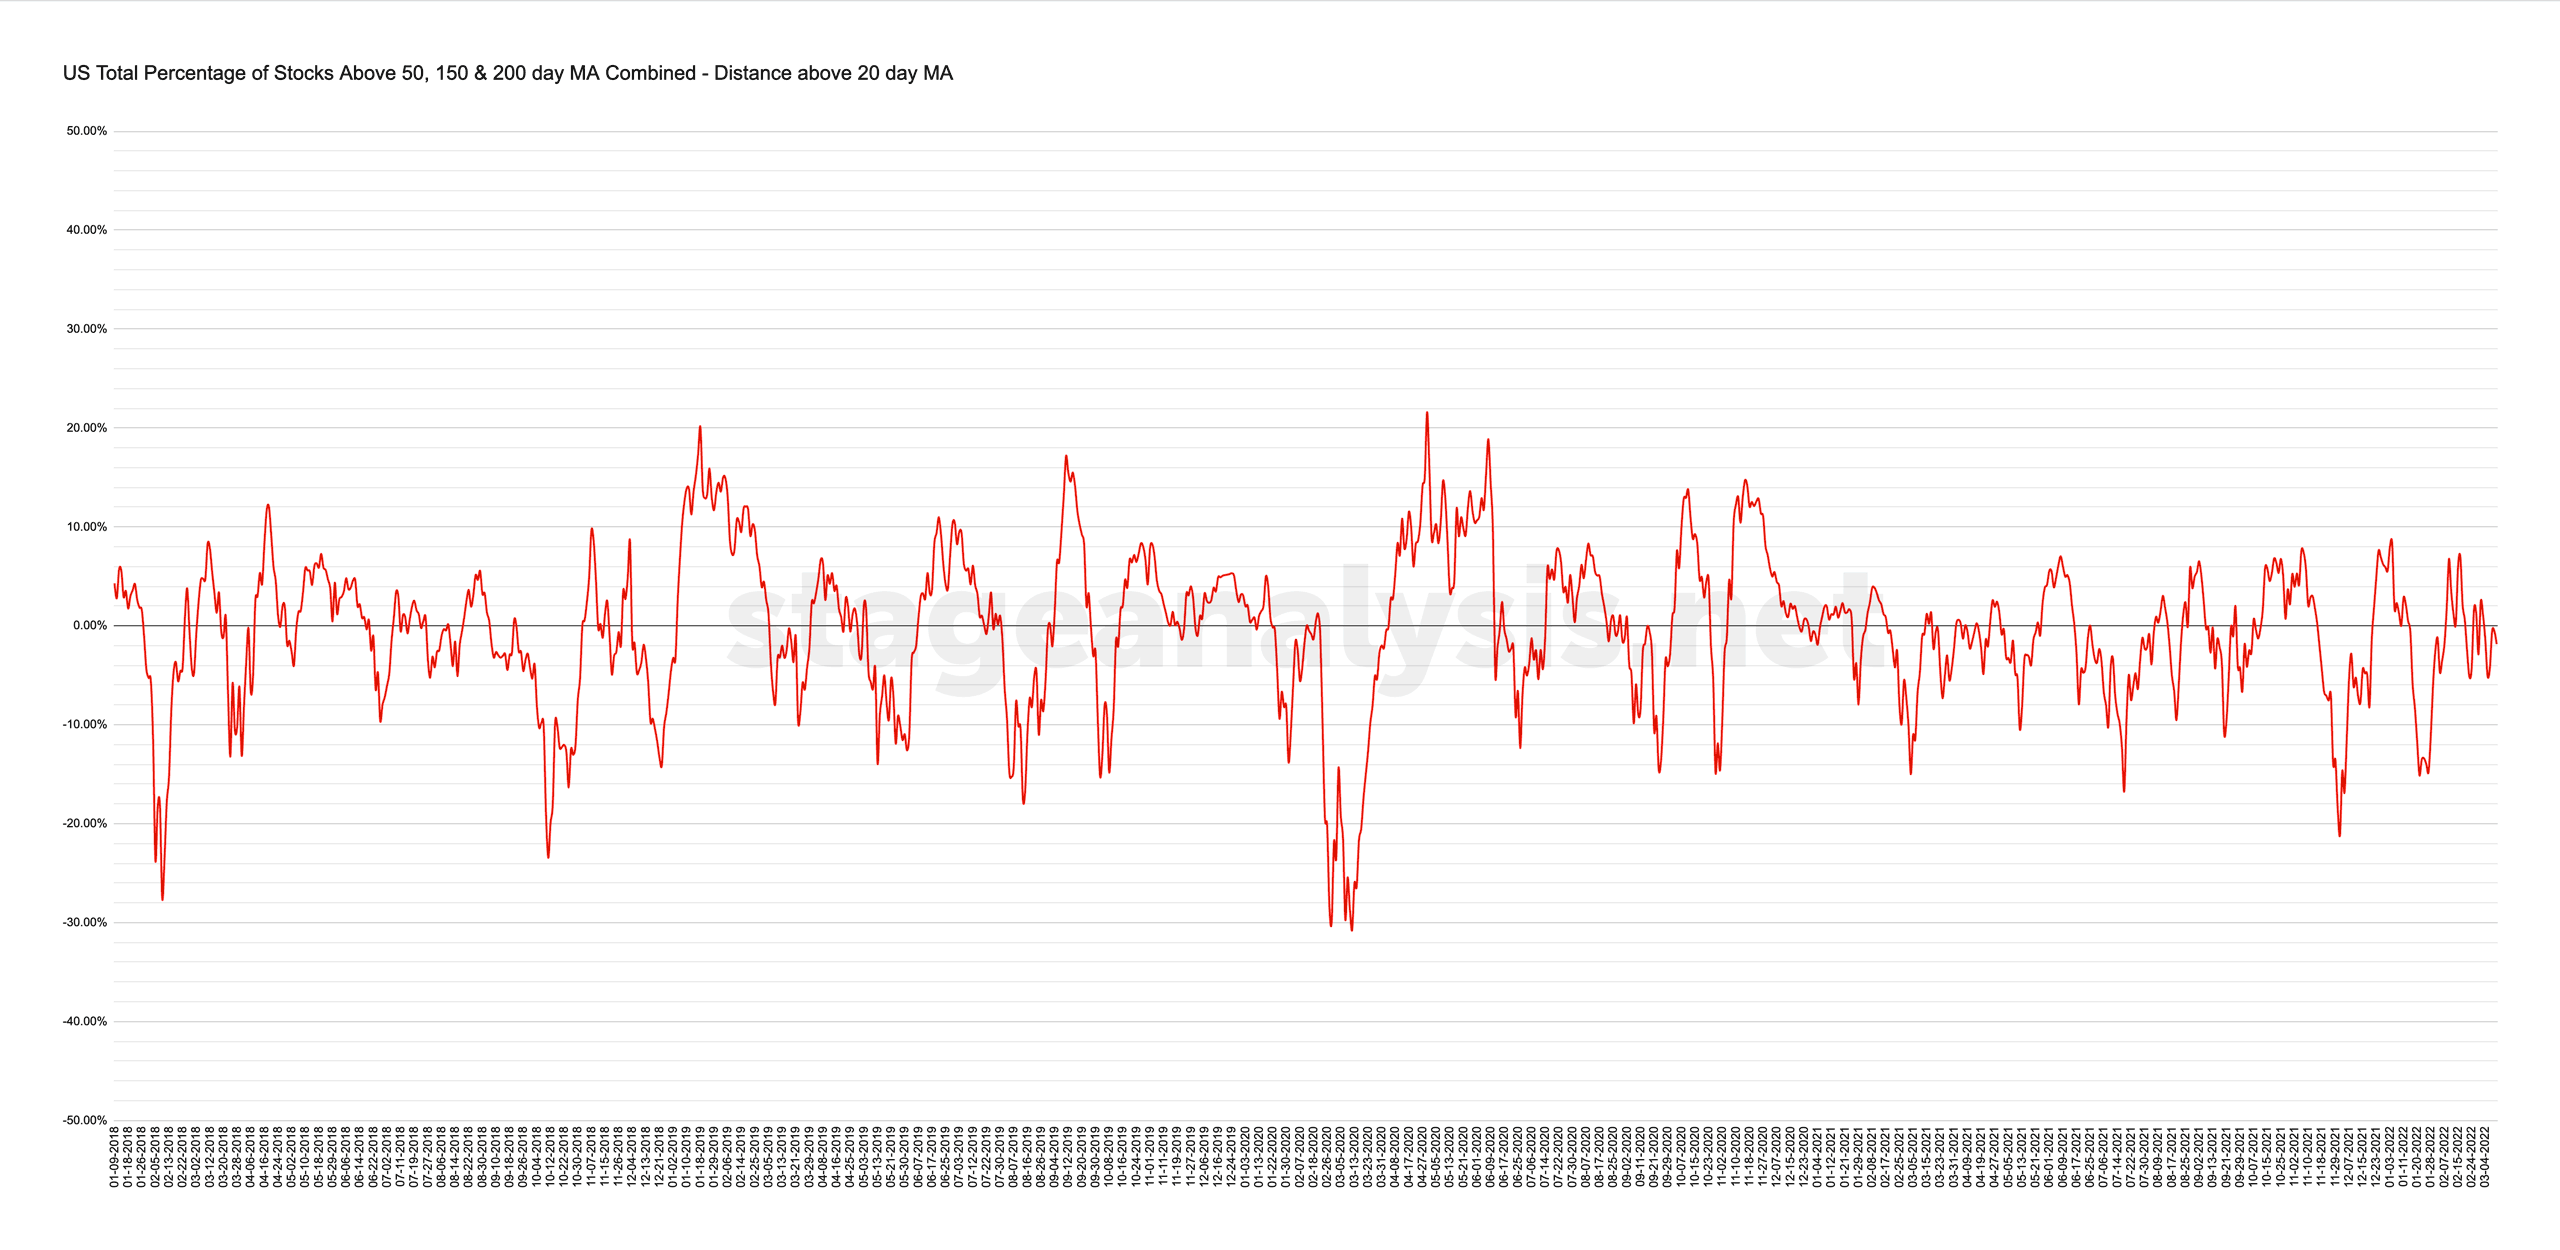
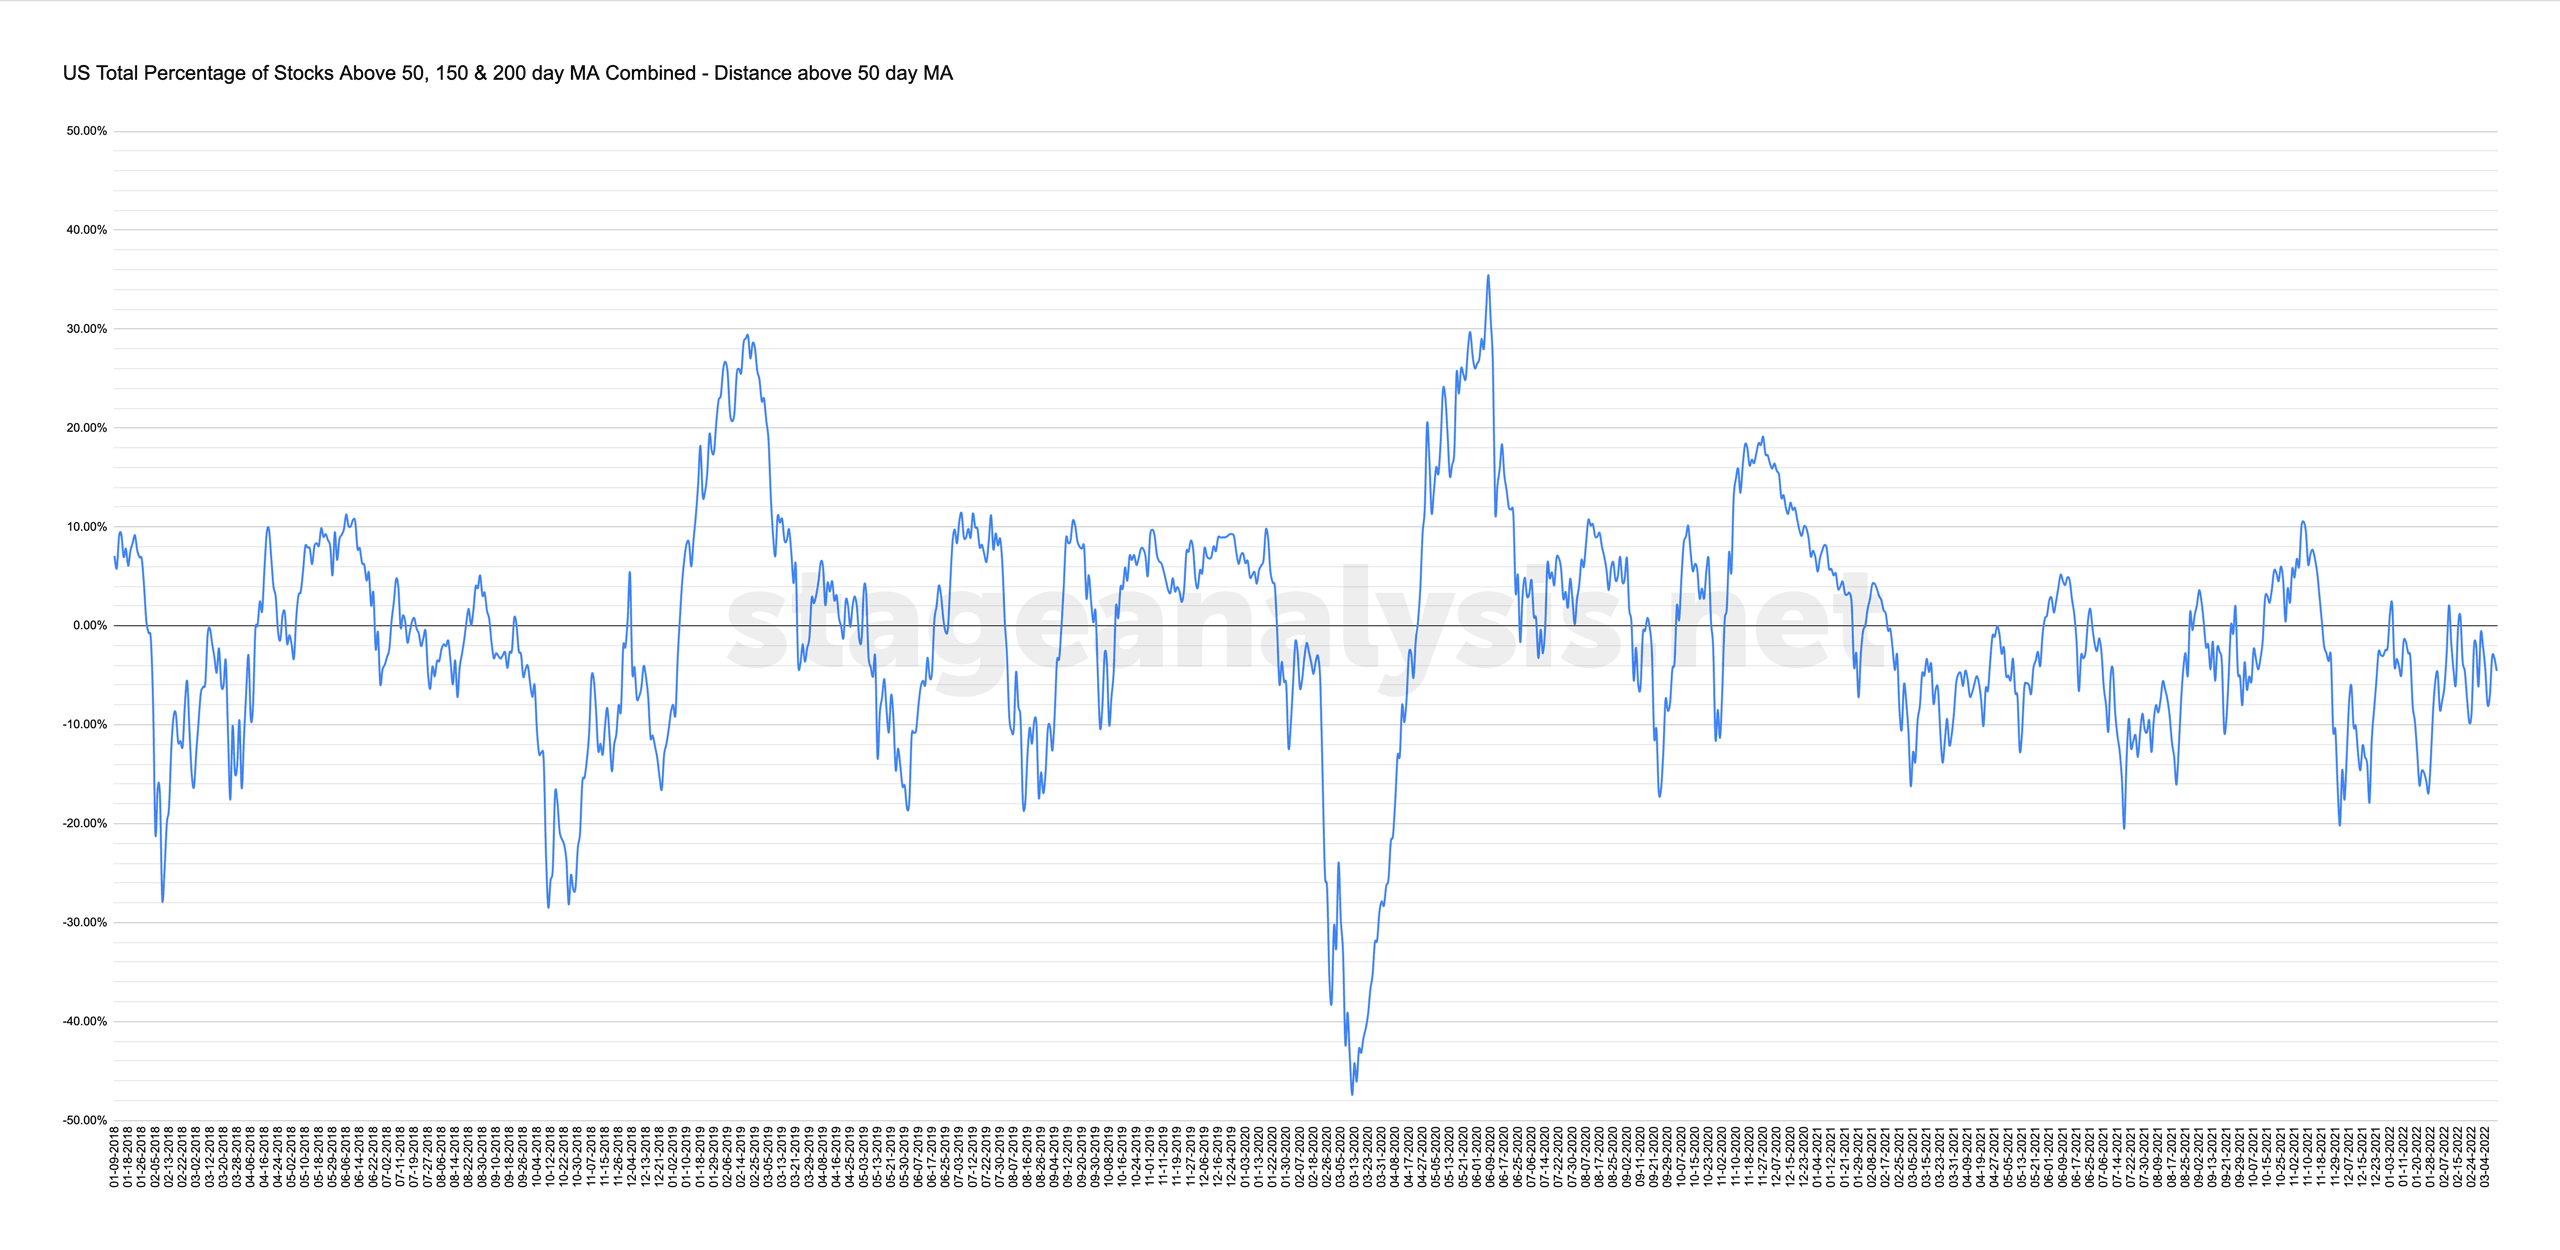
20 and 50 day Oscillator
These show the distance that the combined chart is from the 20 day MA and 50 day MA on the chart. Above the zero is positive environment and below is a difficult / negative environment
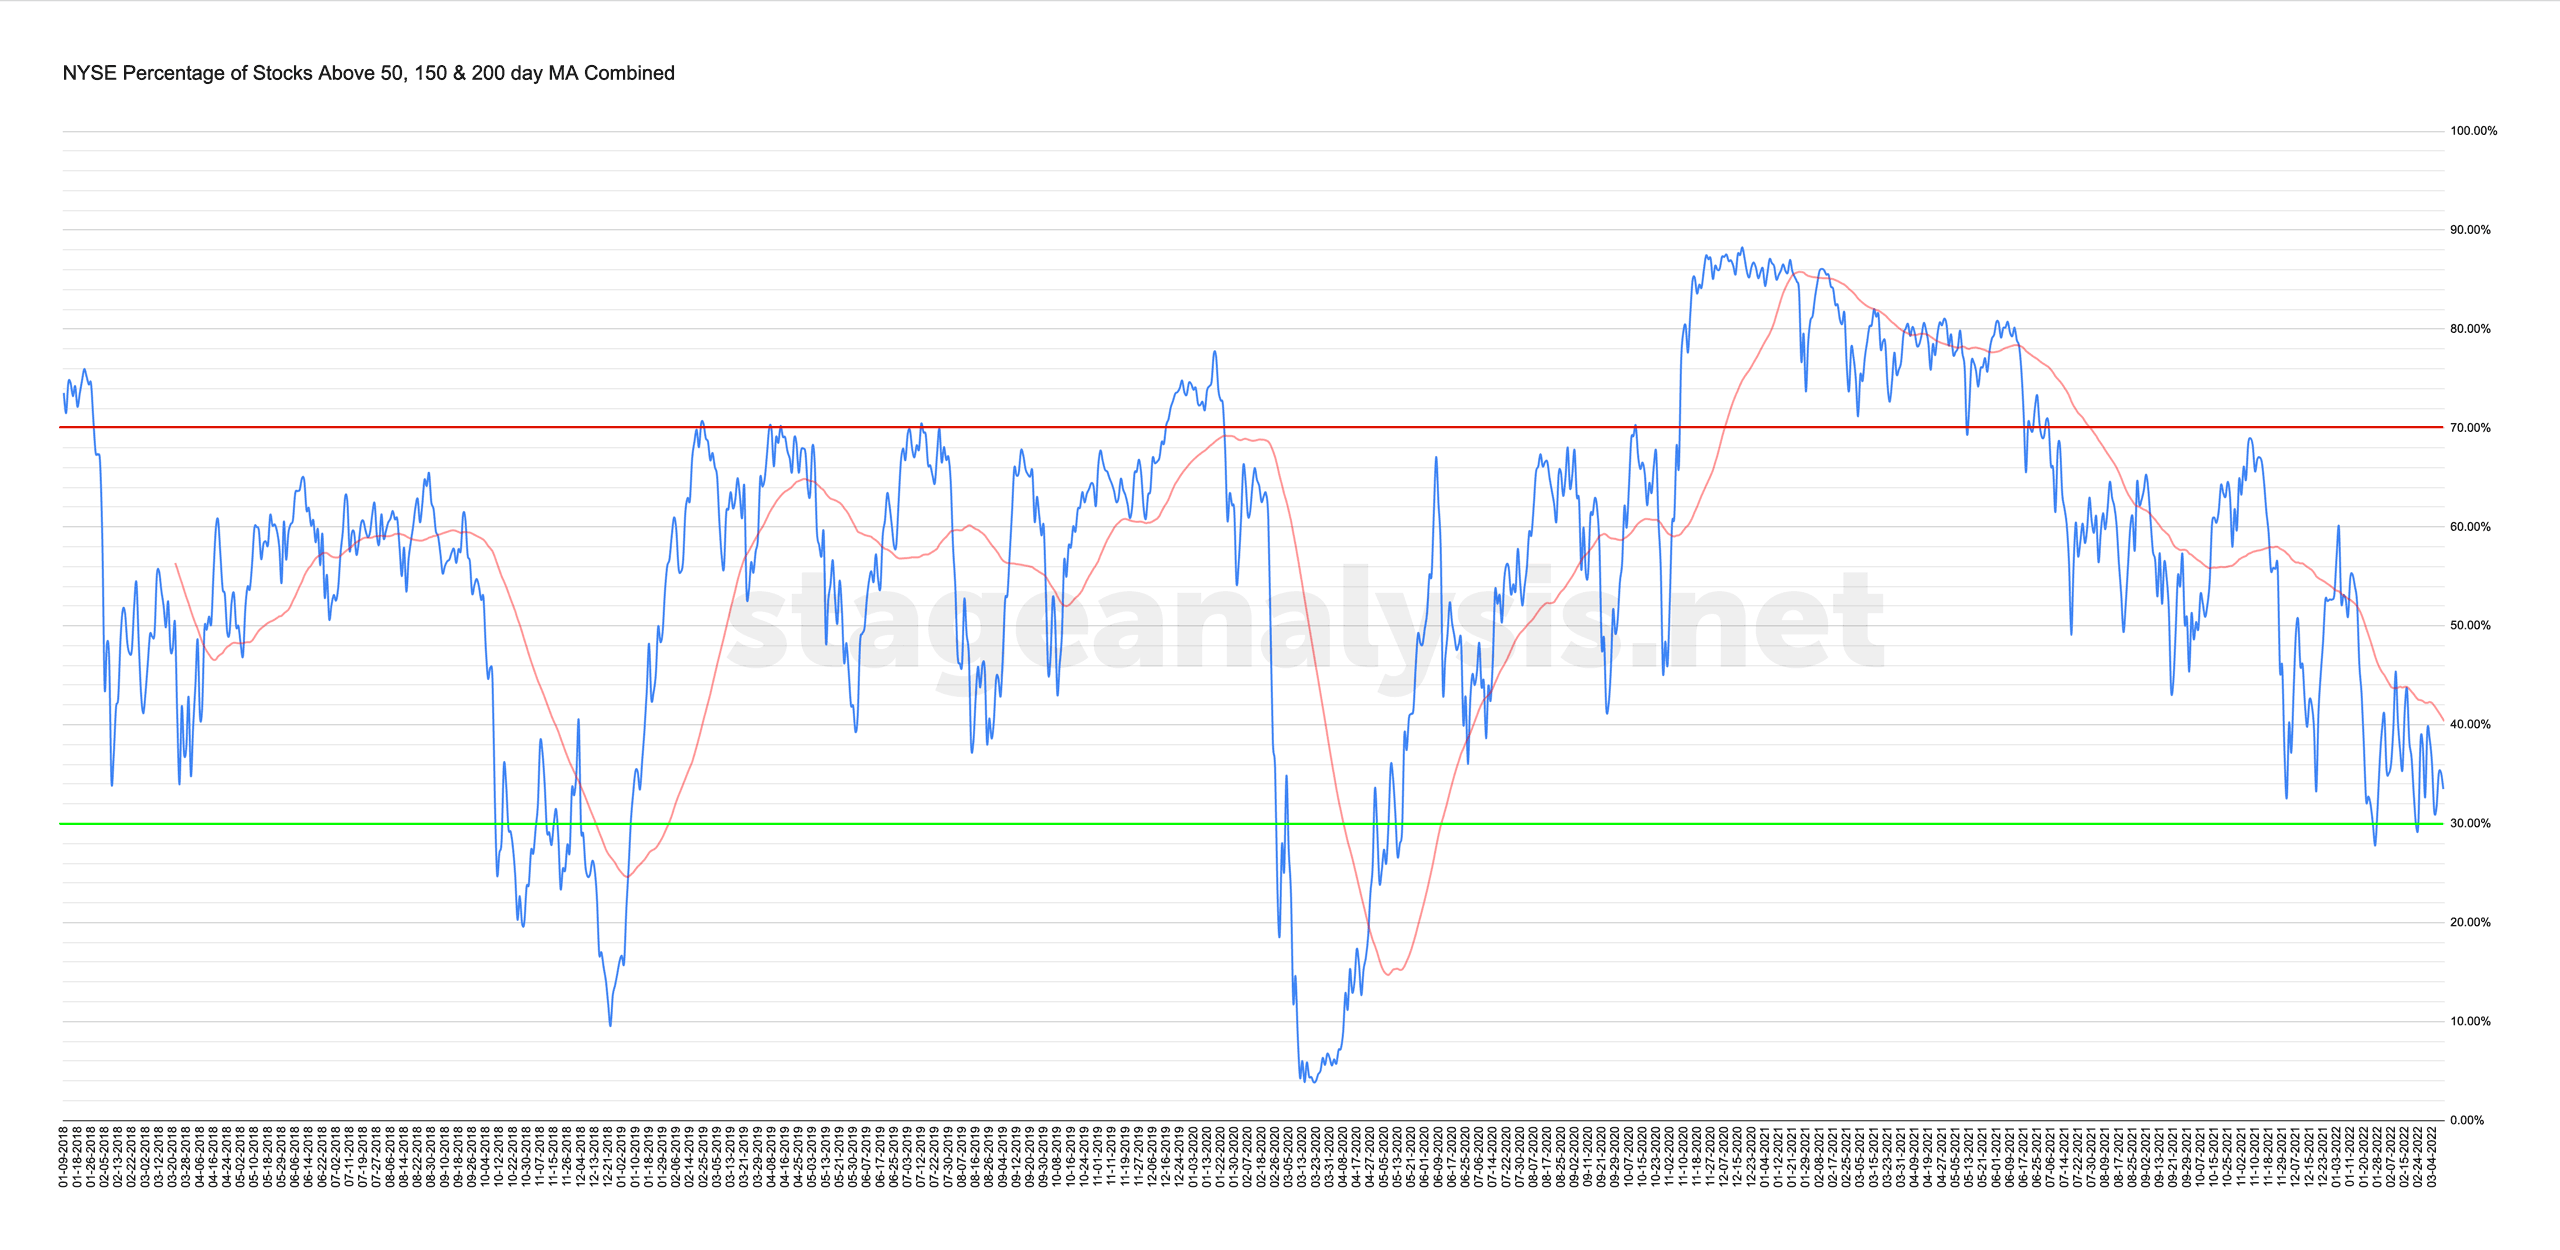
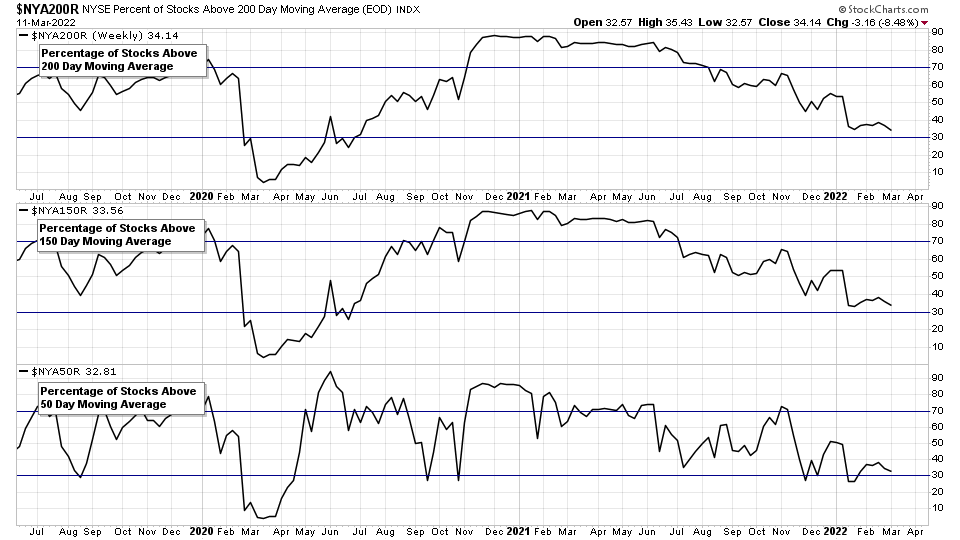
NYSE Total % Stocks Above their 50 Day, 150 Day & 200 Day Moving Averages Combined
33.50% (-2.66% 1wk)
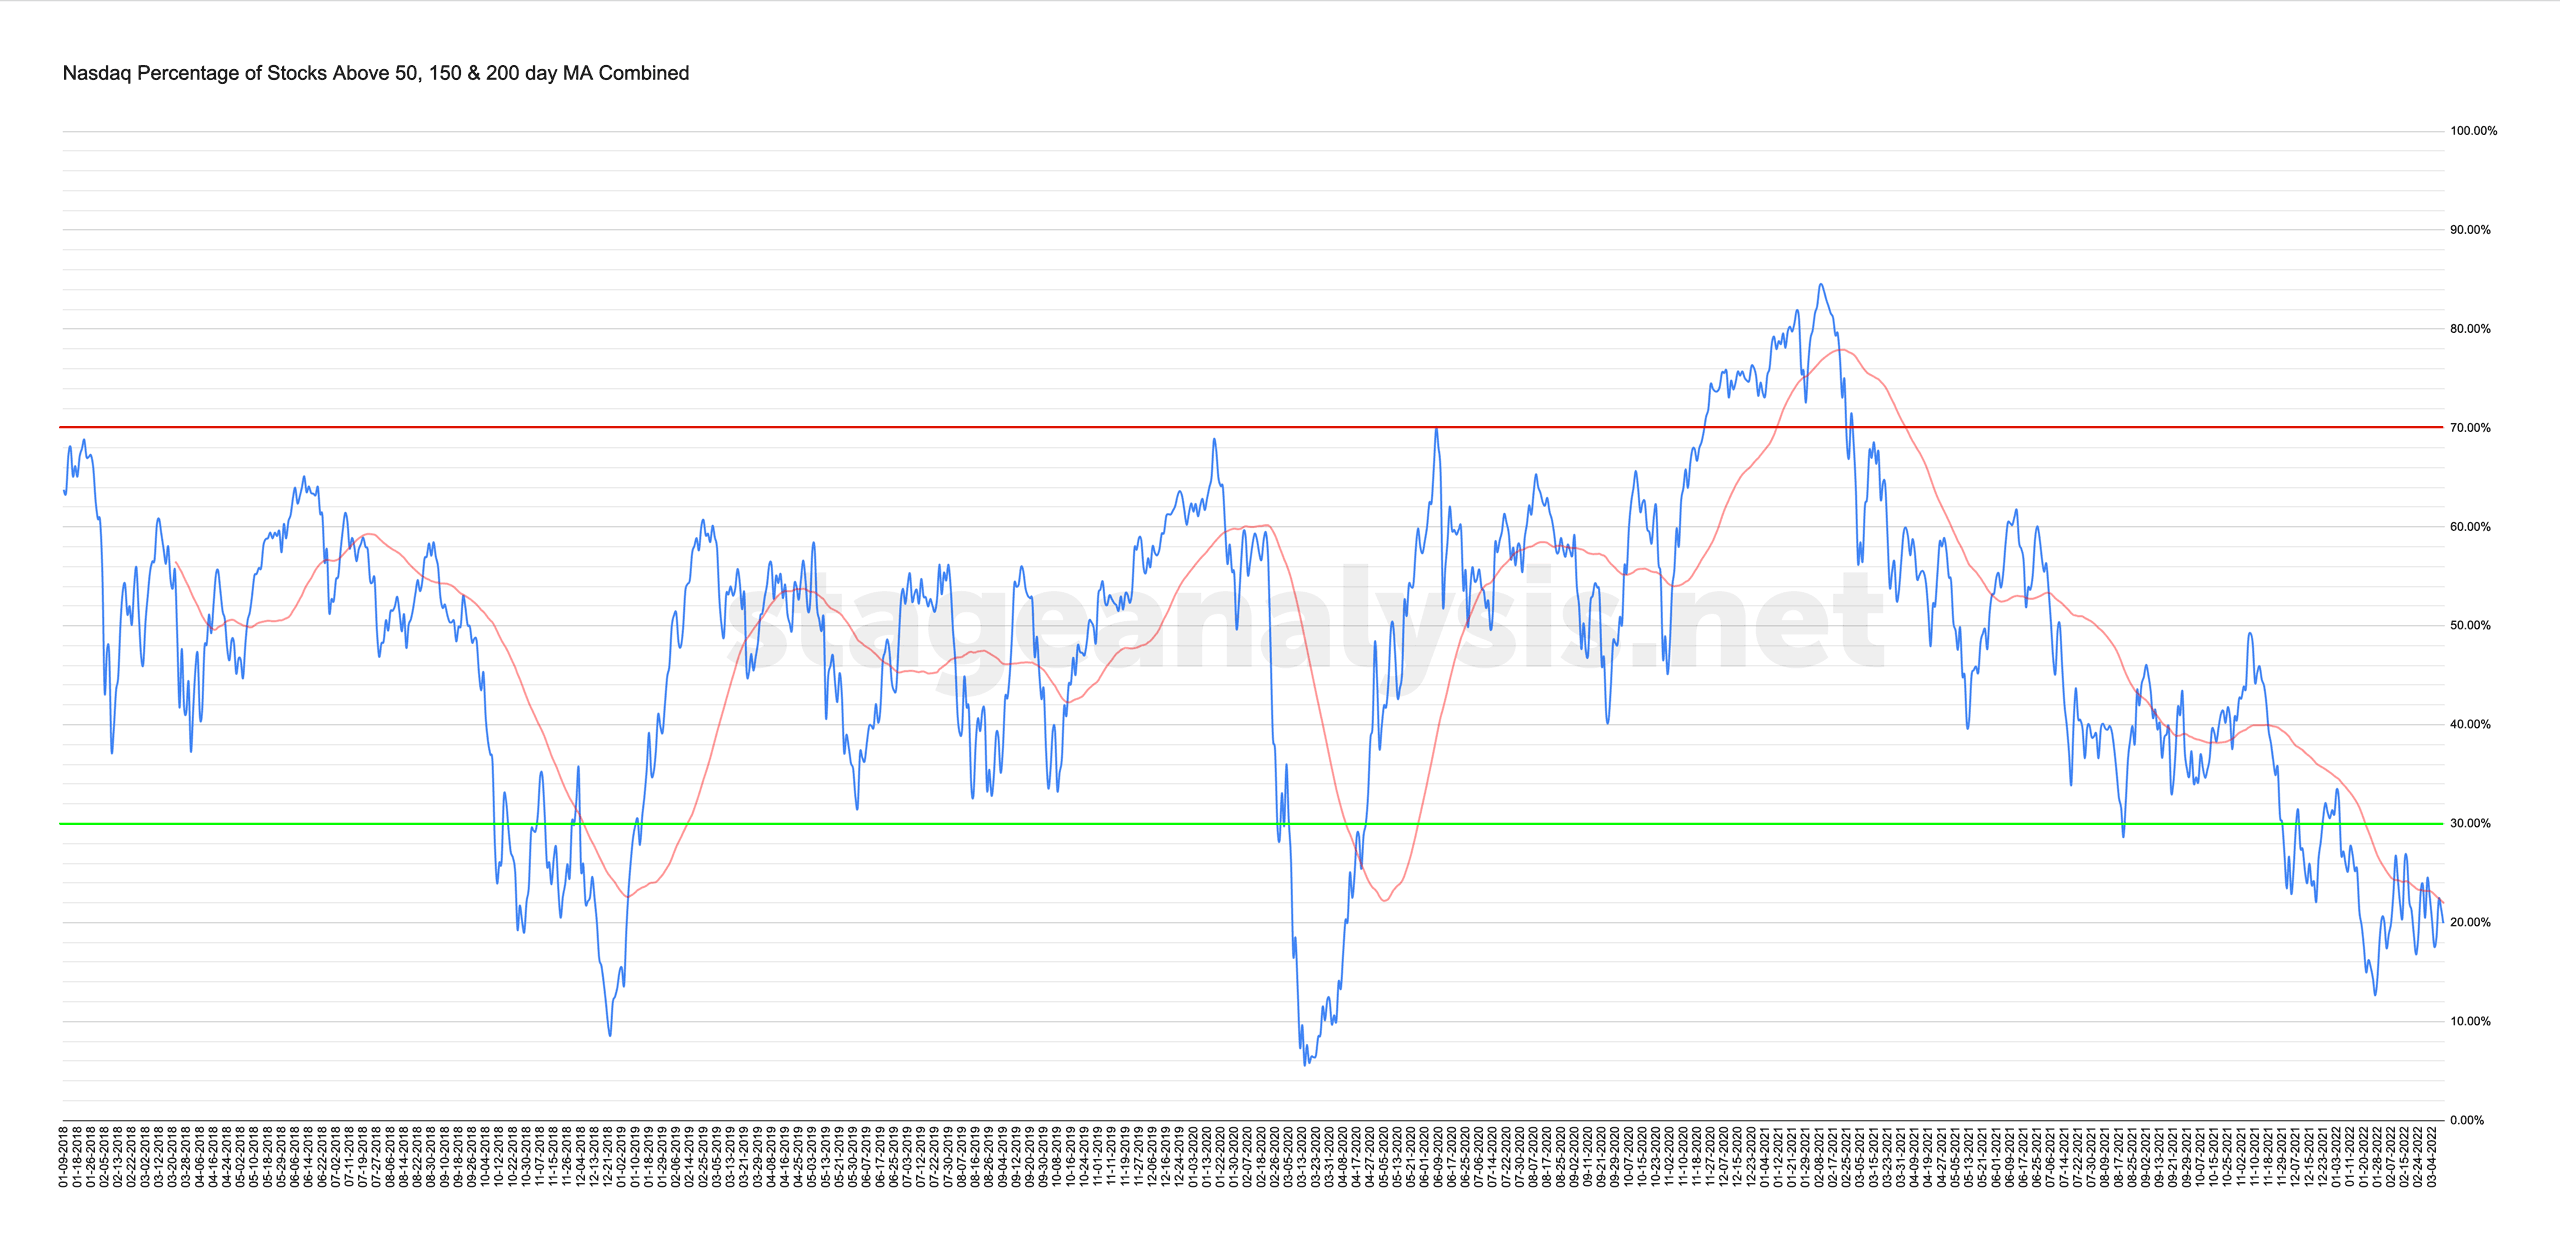
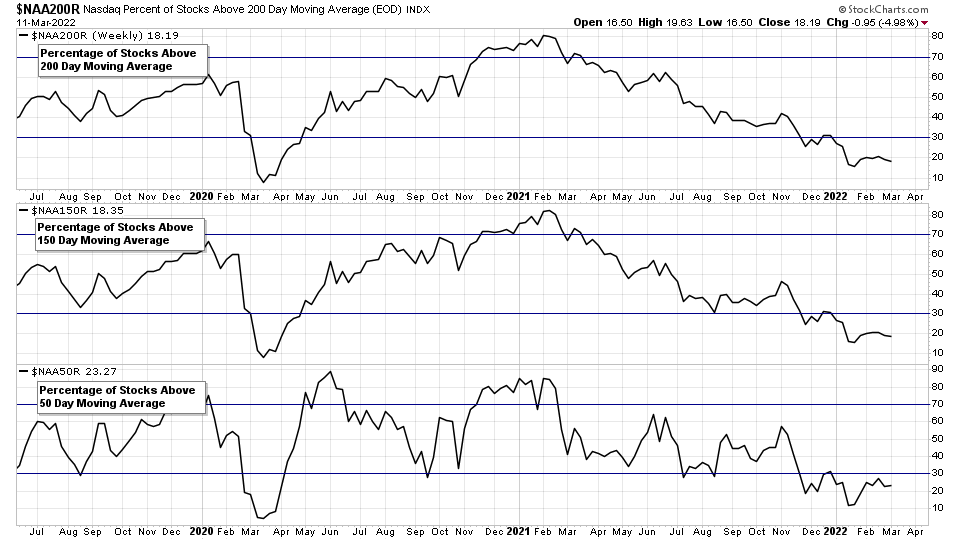
Nasdaq Total % Stocks Above their 50 Day, 150 Day & 200 Day Moving Averages Combined
19.94% (-0.36% 1wk)
Become a Stage Analysis Member:
To see more like this – US Stocks watchlist posts, detailed videos each weekend, use our unique Stage Analysis tools, such as the US Stocks & ETFs Screener, Charts, Market Breadth, Group Relative Strength and more...
Join Today
Disclaimer: For educational purpose only. Not investment advice. Seek professional advice from a financial advisor before making any investing decisions.