
New Feature: Chart Grid Templates – 14 January 2026
14 January, 2026The chart grid view on the Stage Analysis Screener has been upgraded with a number of new features this week to make it easier for users to scan through the chart results
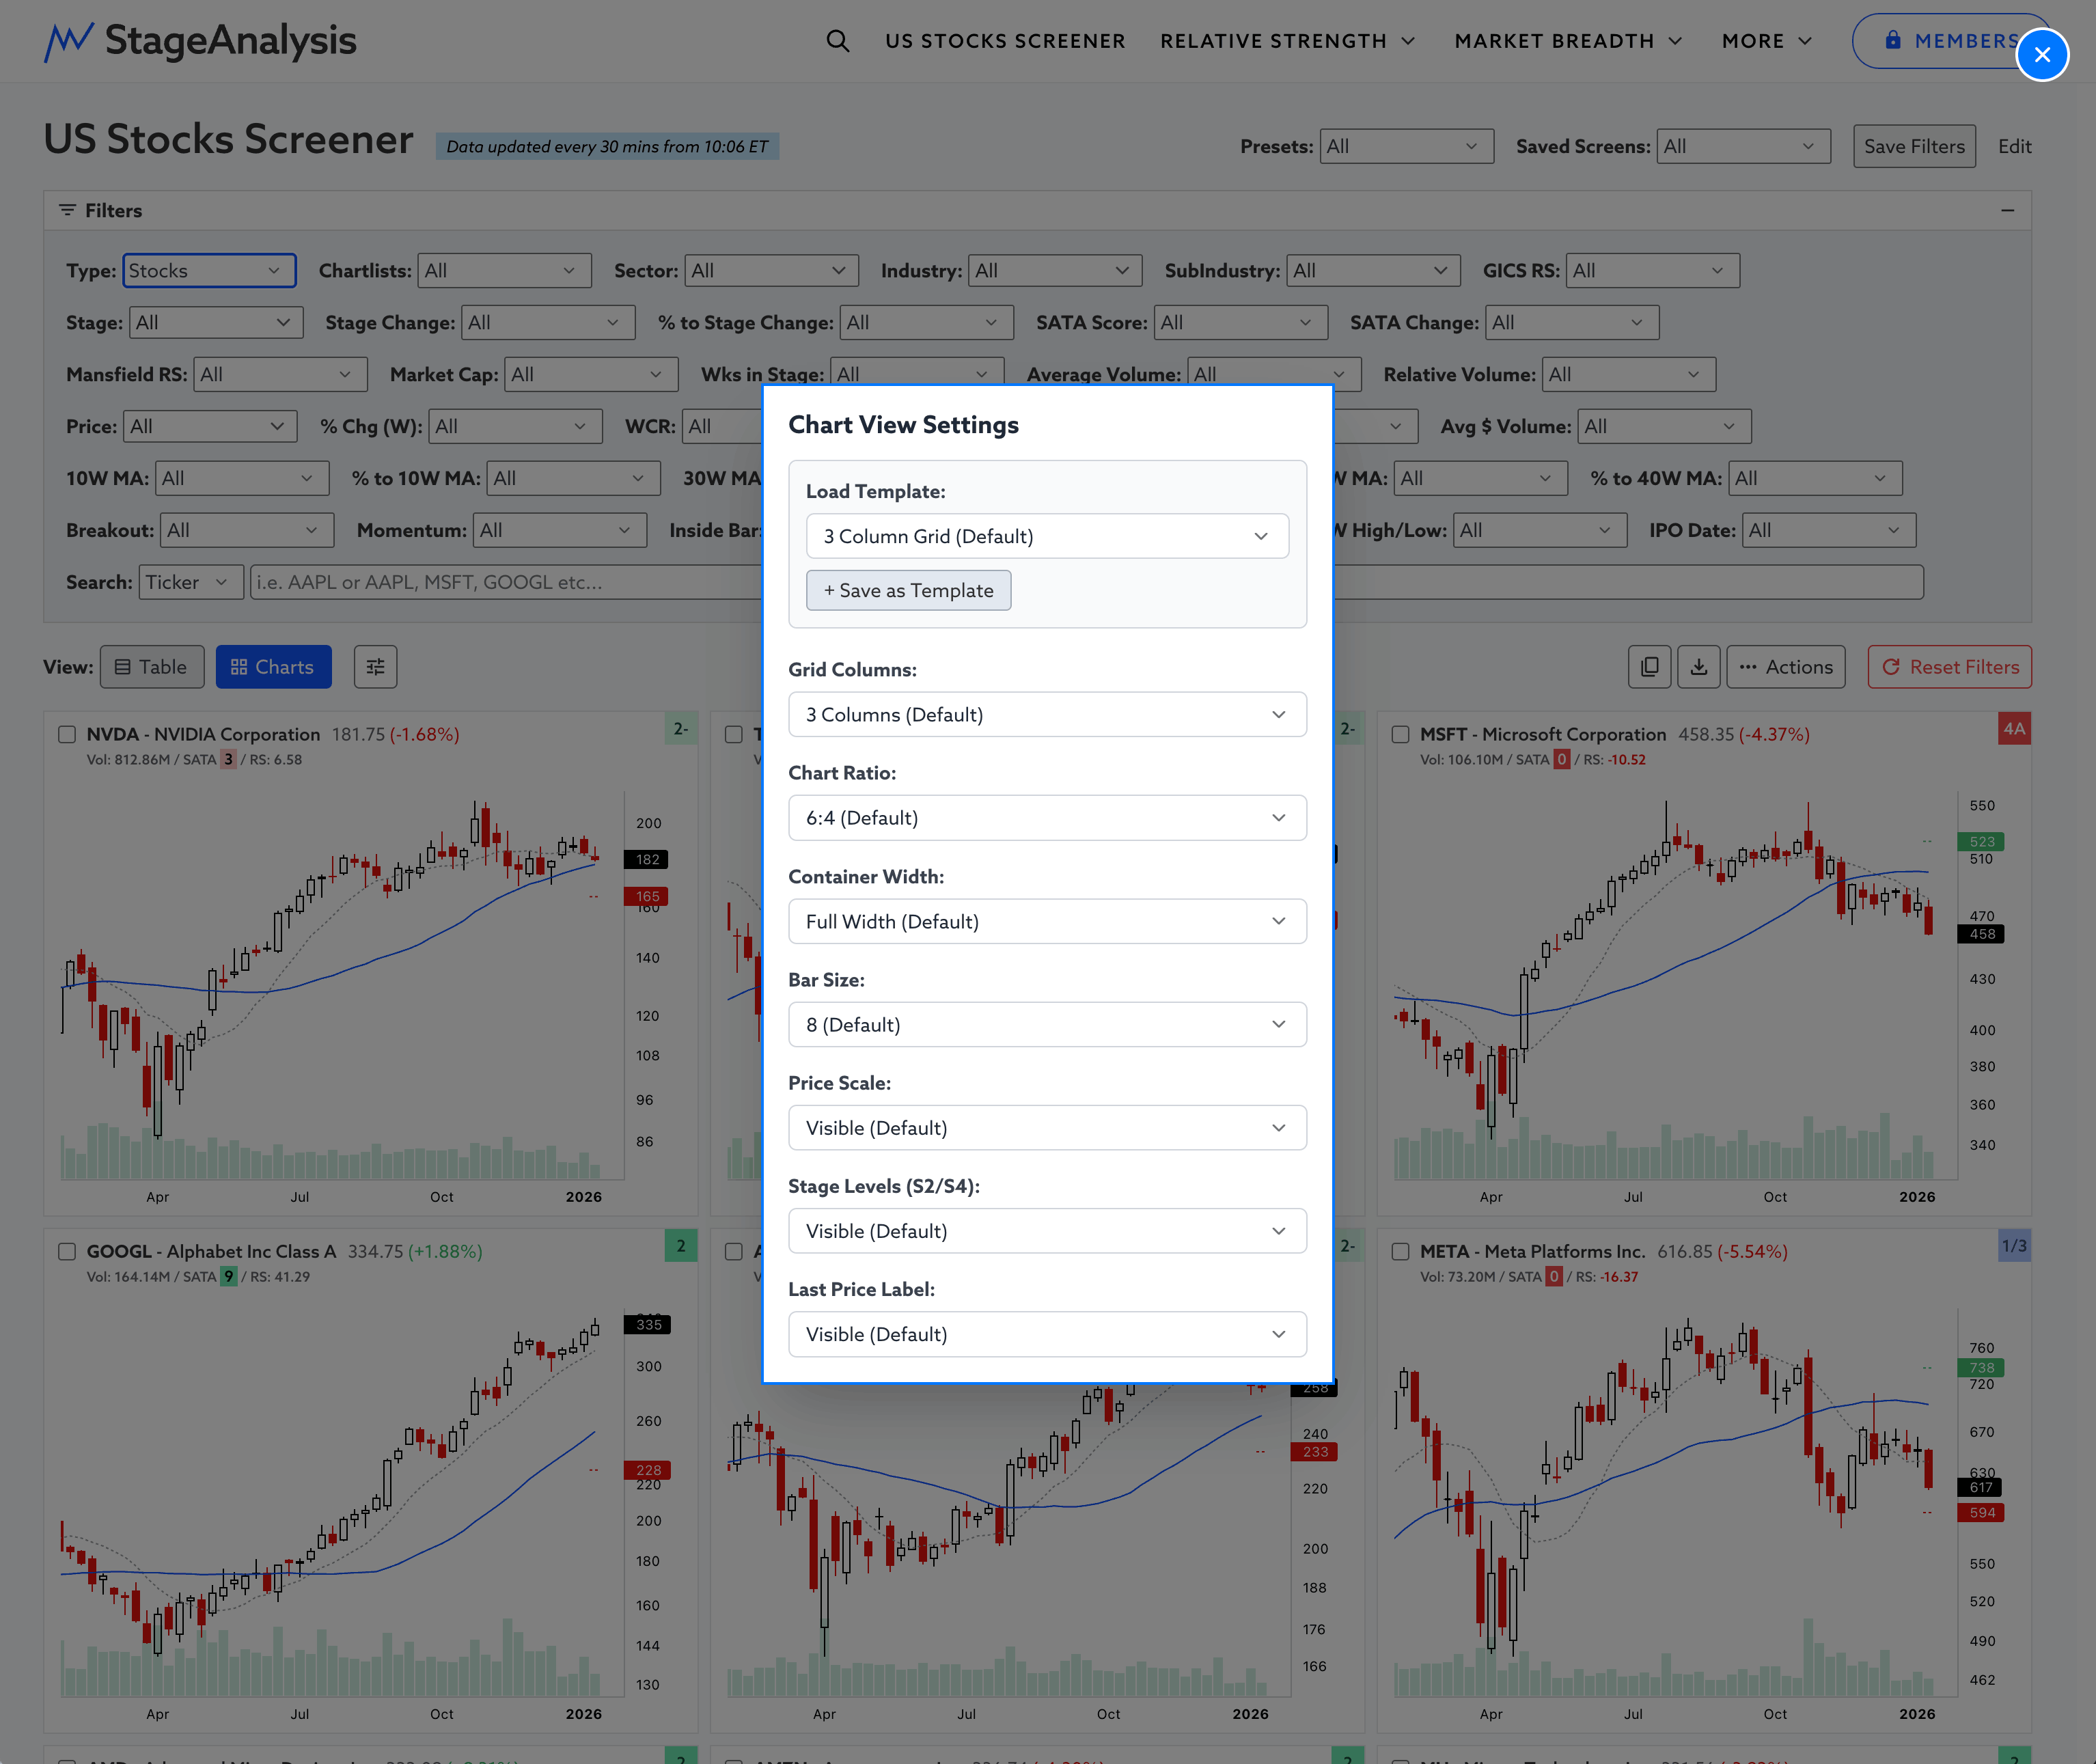
Chart View Settings icon button has been added to the right of the Chart button on the page, but is only visible when the charts are in view. With that you can:
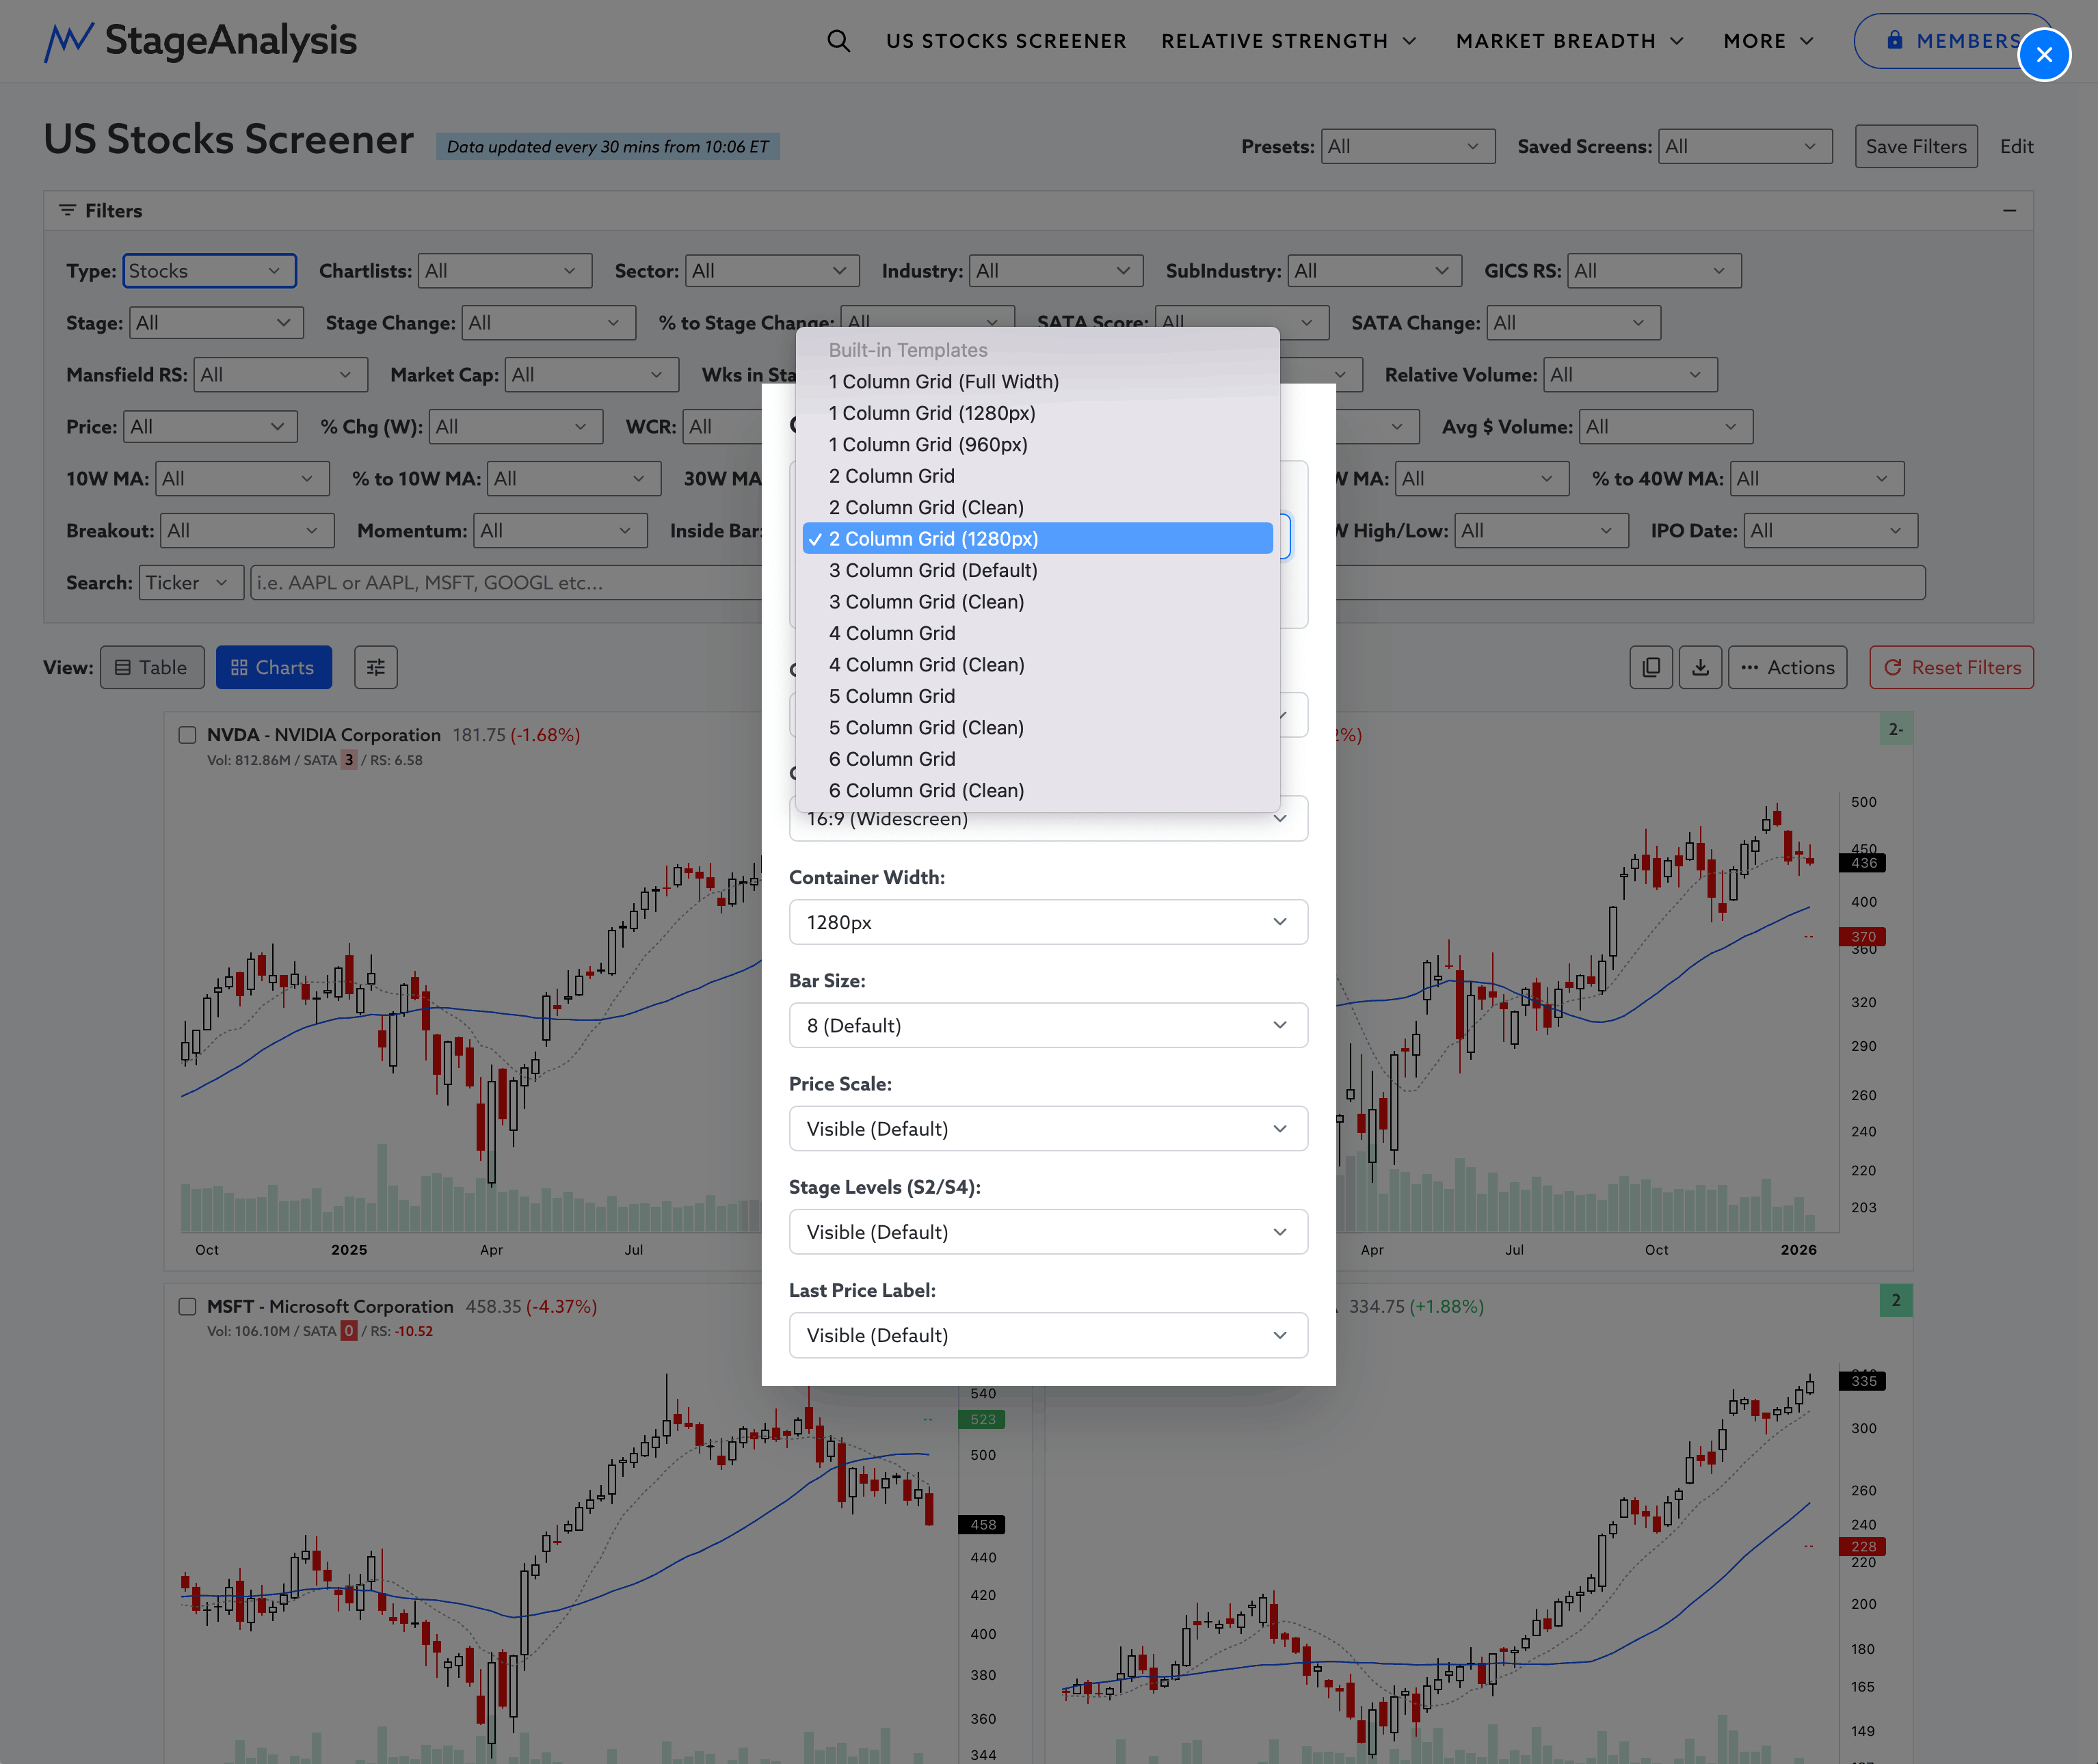
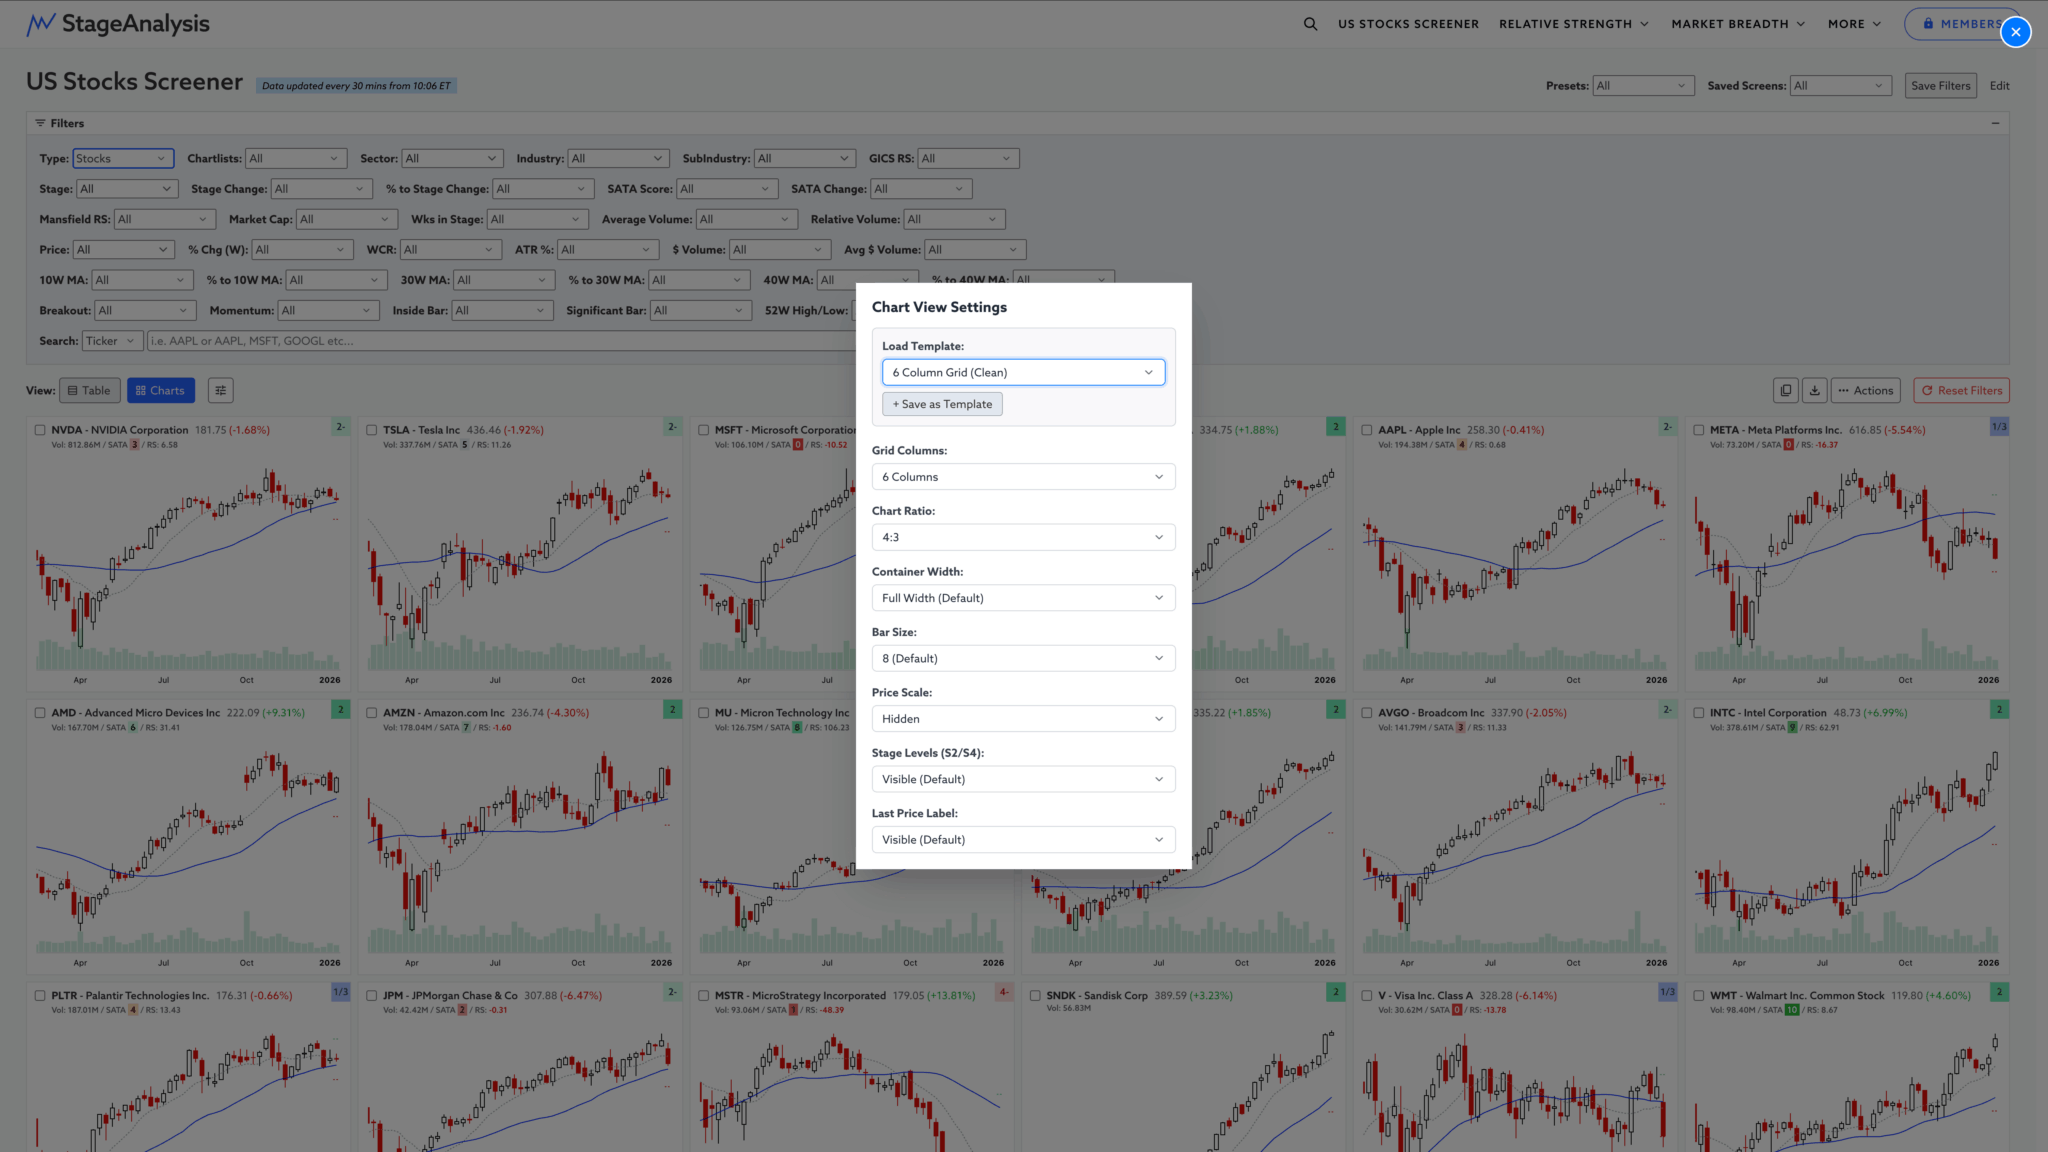
- Load different chart grids and styles using the presets templates i.e. quickly change to 1 column grid view for scrolling through bigger charts, and then switch to clean mini thumbnails with 6 columns in view with one click.
- Save your own custom templates based on your favourite options, tailored to your unique screen size.
- Switch on/off various chart settings – Price scale, Last price, Stage 2 level and Stage 4 level.
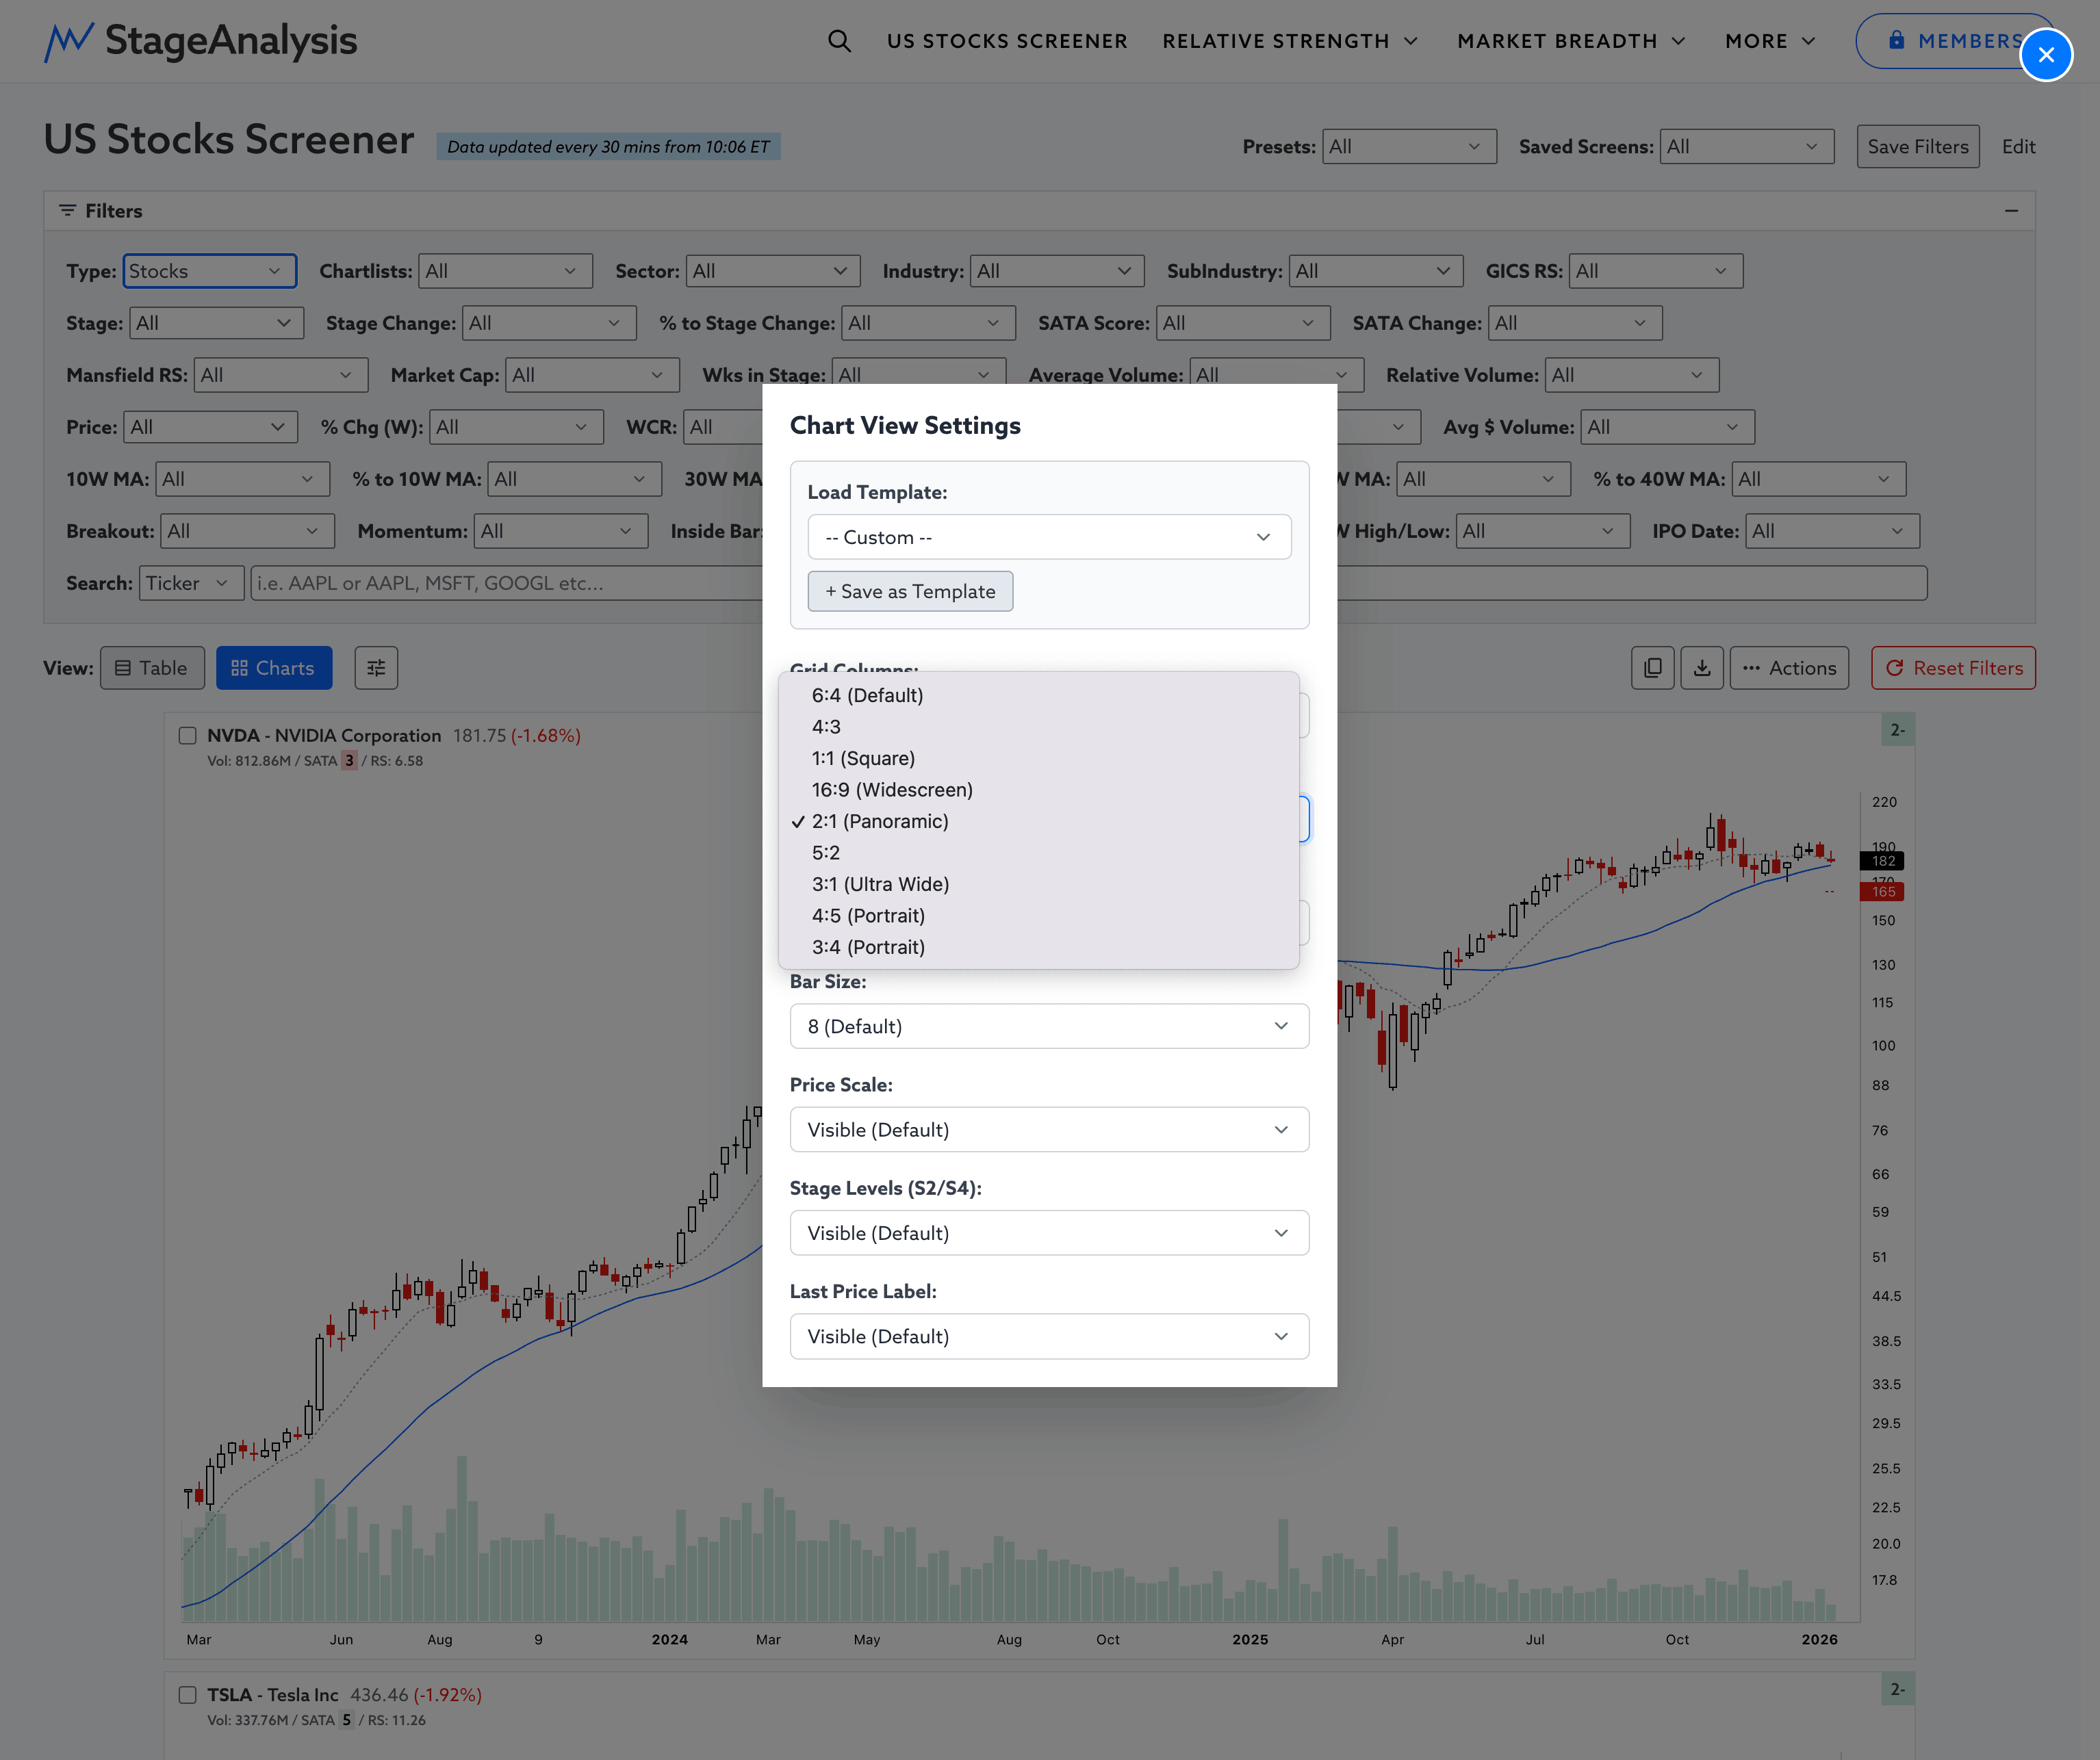
- Adjust the Chart Aspect Ratio i.e. 6:4 (Default), 4:3, 16:9 (Widescreen), 2:1 (Panoramic) and more...
- Change the container width to restrict the screen area that the charts fill to make it easier to visually scan through charts quickly when scrolling.
This is the first iteration of the Chart View Settings and Custom Templates. So it will continue to improve throughout the year, with more options based on feedback from the users.
Become a Stage Analysis Member:
To see more like this – US Stocks watchlist posts, detailed videos each weekend, use our unique Stage Analysis tools, such as the US Stocks & ETFs Screener, Charts, Market Breadth, Group Relative Strength and more...
Join Today
Disclaimer: For educational purpose only. Not investment advice. Seek professional advice from a financial advisor before making any investing decisions.