
Market Breadth: Percentage of Stocks Above their 50 Day, 150 Day & 200 Day Moving Averages Combined
The full post is available to view by members only. For immediate access:
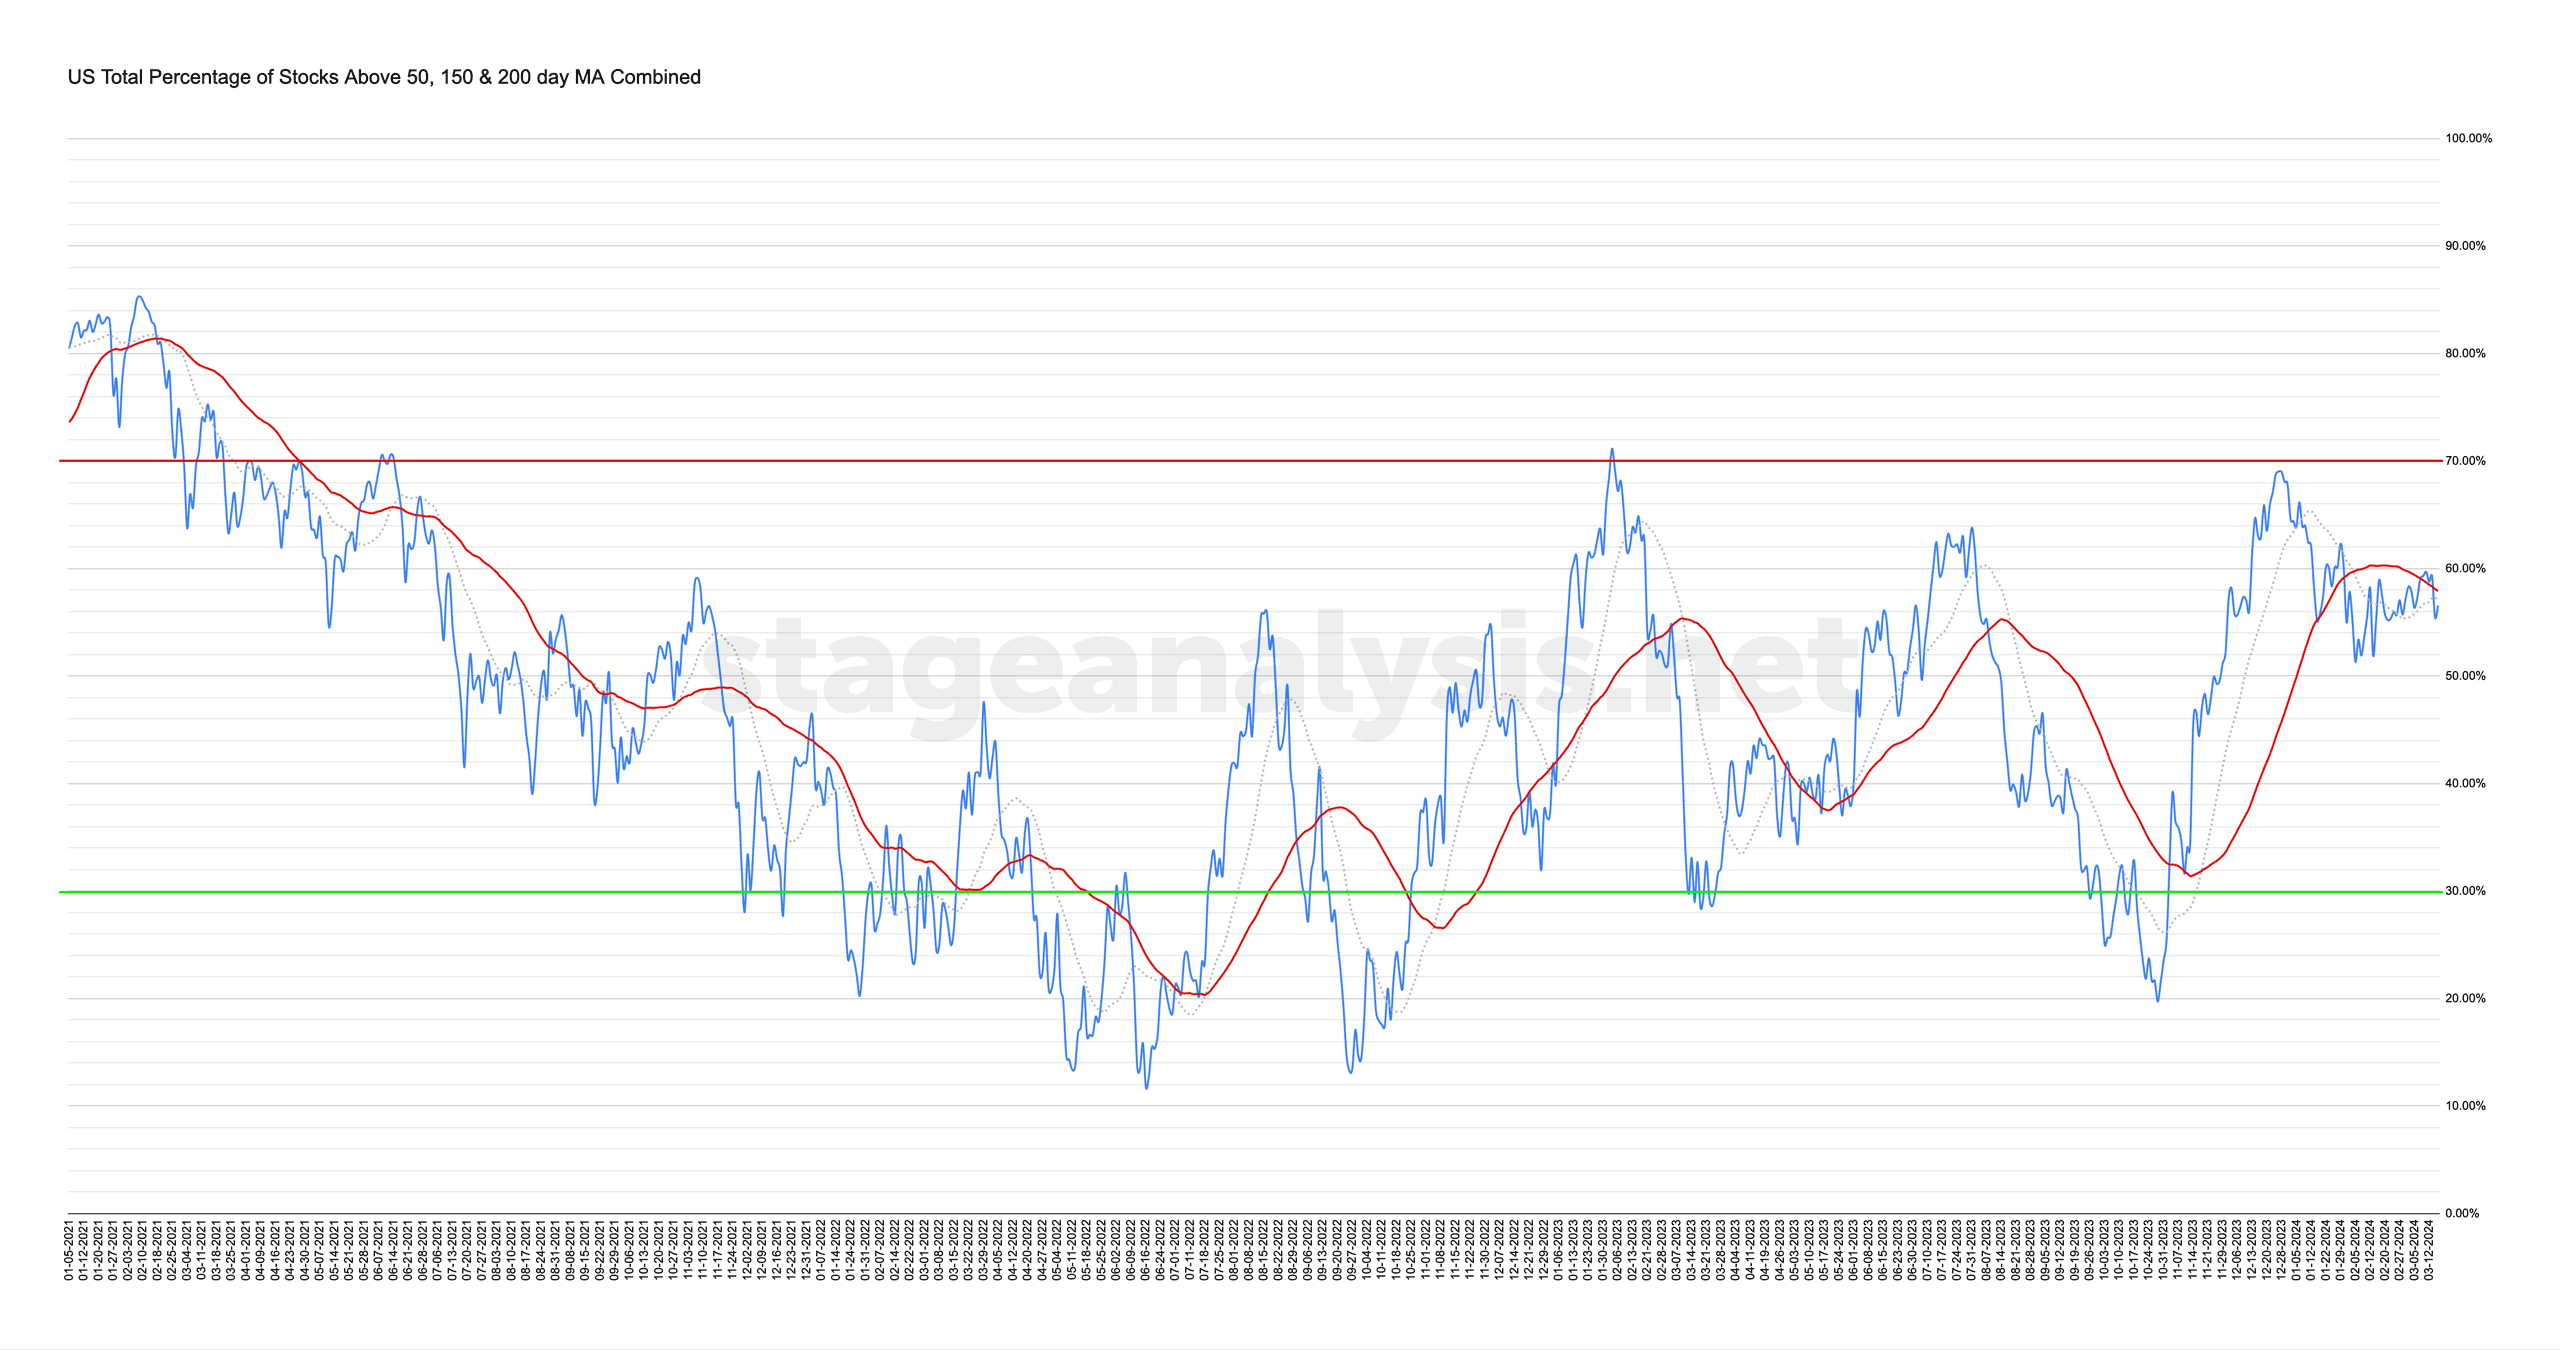
56.57% (-2.74% 1wk)
Status: Neutral / Difficult Environment
The US Total Percentage of Stocks above their 50 Day, 150 Day & 200 Day Moving Averages (shown above) decreased by -2.74% this week.
Therefore, the overall combined average is at 56.57% in the US market (NYSE and Nasdaq markets combined) above their short, medium and long term moving averages.
The combined average declined through the week, with a slight rebound on Friday. But with the decline it's dropped below both of its moving averages and hence technically changes to a Difficult environment status. However, with the proximity to the moving averages still, I'm still keeping Neutral as part of the environment status, as it's still on the borderline currently.
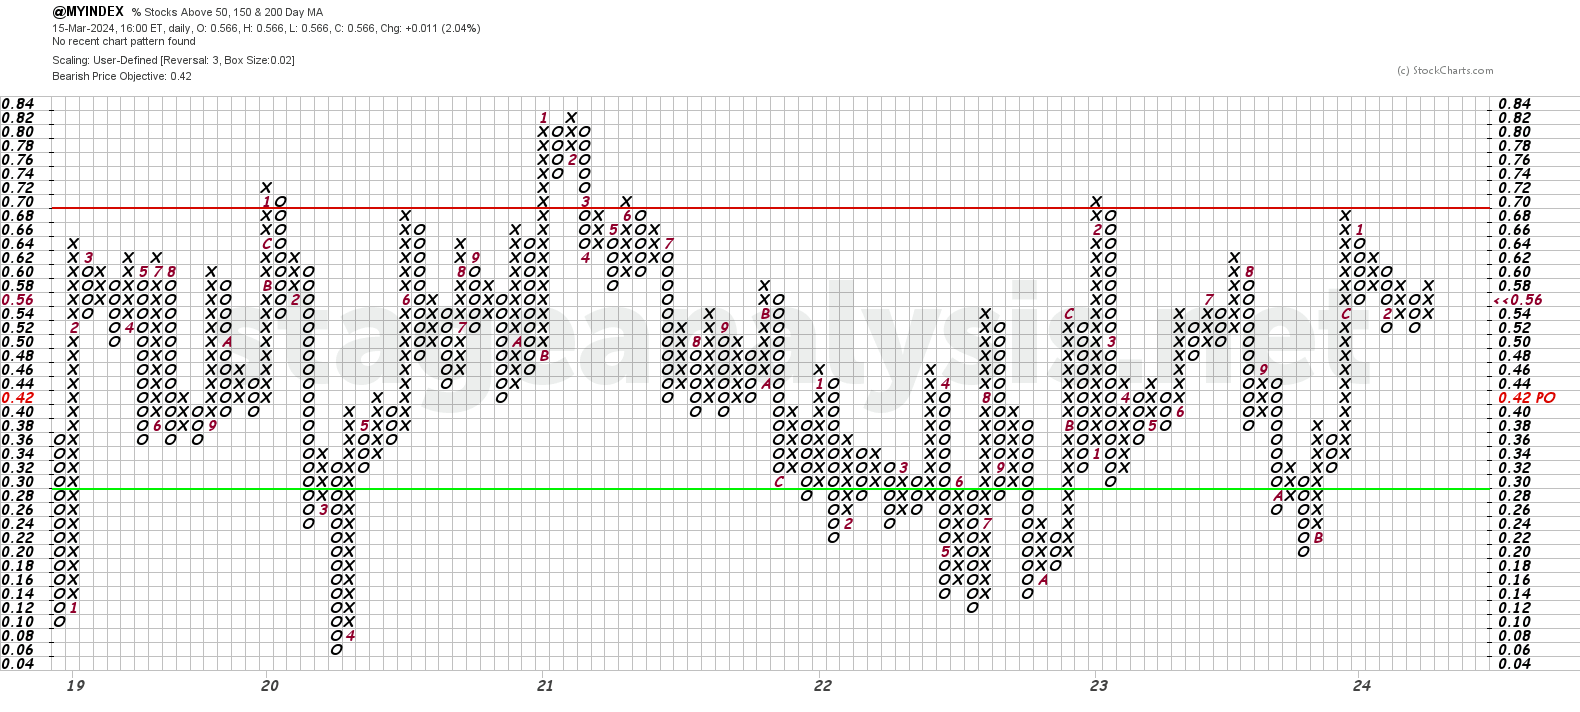
The Point and Figure (P&F) chart (shown above) was once again unchanged this week, remaining in Xs, and so the P&F strategy remains on Offense (as it is in a column of Xs), and the P&F status continues to be on Bear Correction status in the upper-middle range.
So as per the previous few weeks. From its current position, a close above 60% would make a double top breakout, and change to Bull Confirmed, and a close below 52 would change it to Bear Confirmed. So it remains in a very neutral spot currently, with the field position still leaning slightly on positive side at the moment.
See the Bullish Percent article for more information on the P&F statuses.
Become a Stage Analysis Member:
To see more like this – US Stocks watchlist posts, detailed videos each weekend, use our unique Stage Analysis tools, such as the US Stocks & ETFs Screener, Charts, Market Breadth, Group Relative Strength and more...
Join Today
Disclaimer: For educational purpose only. Not investment advice. Seek professional advice from a financial advisor before making any investing decisions.