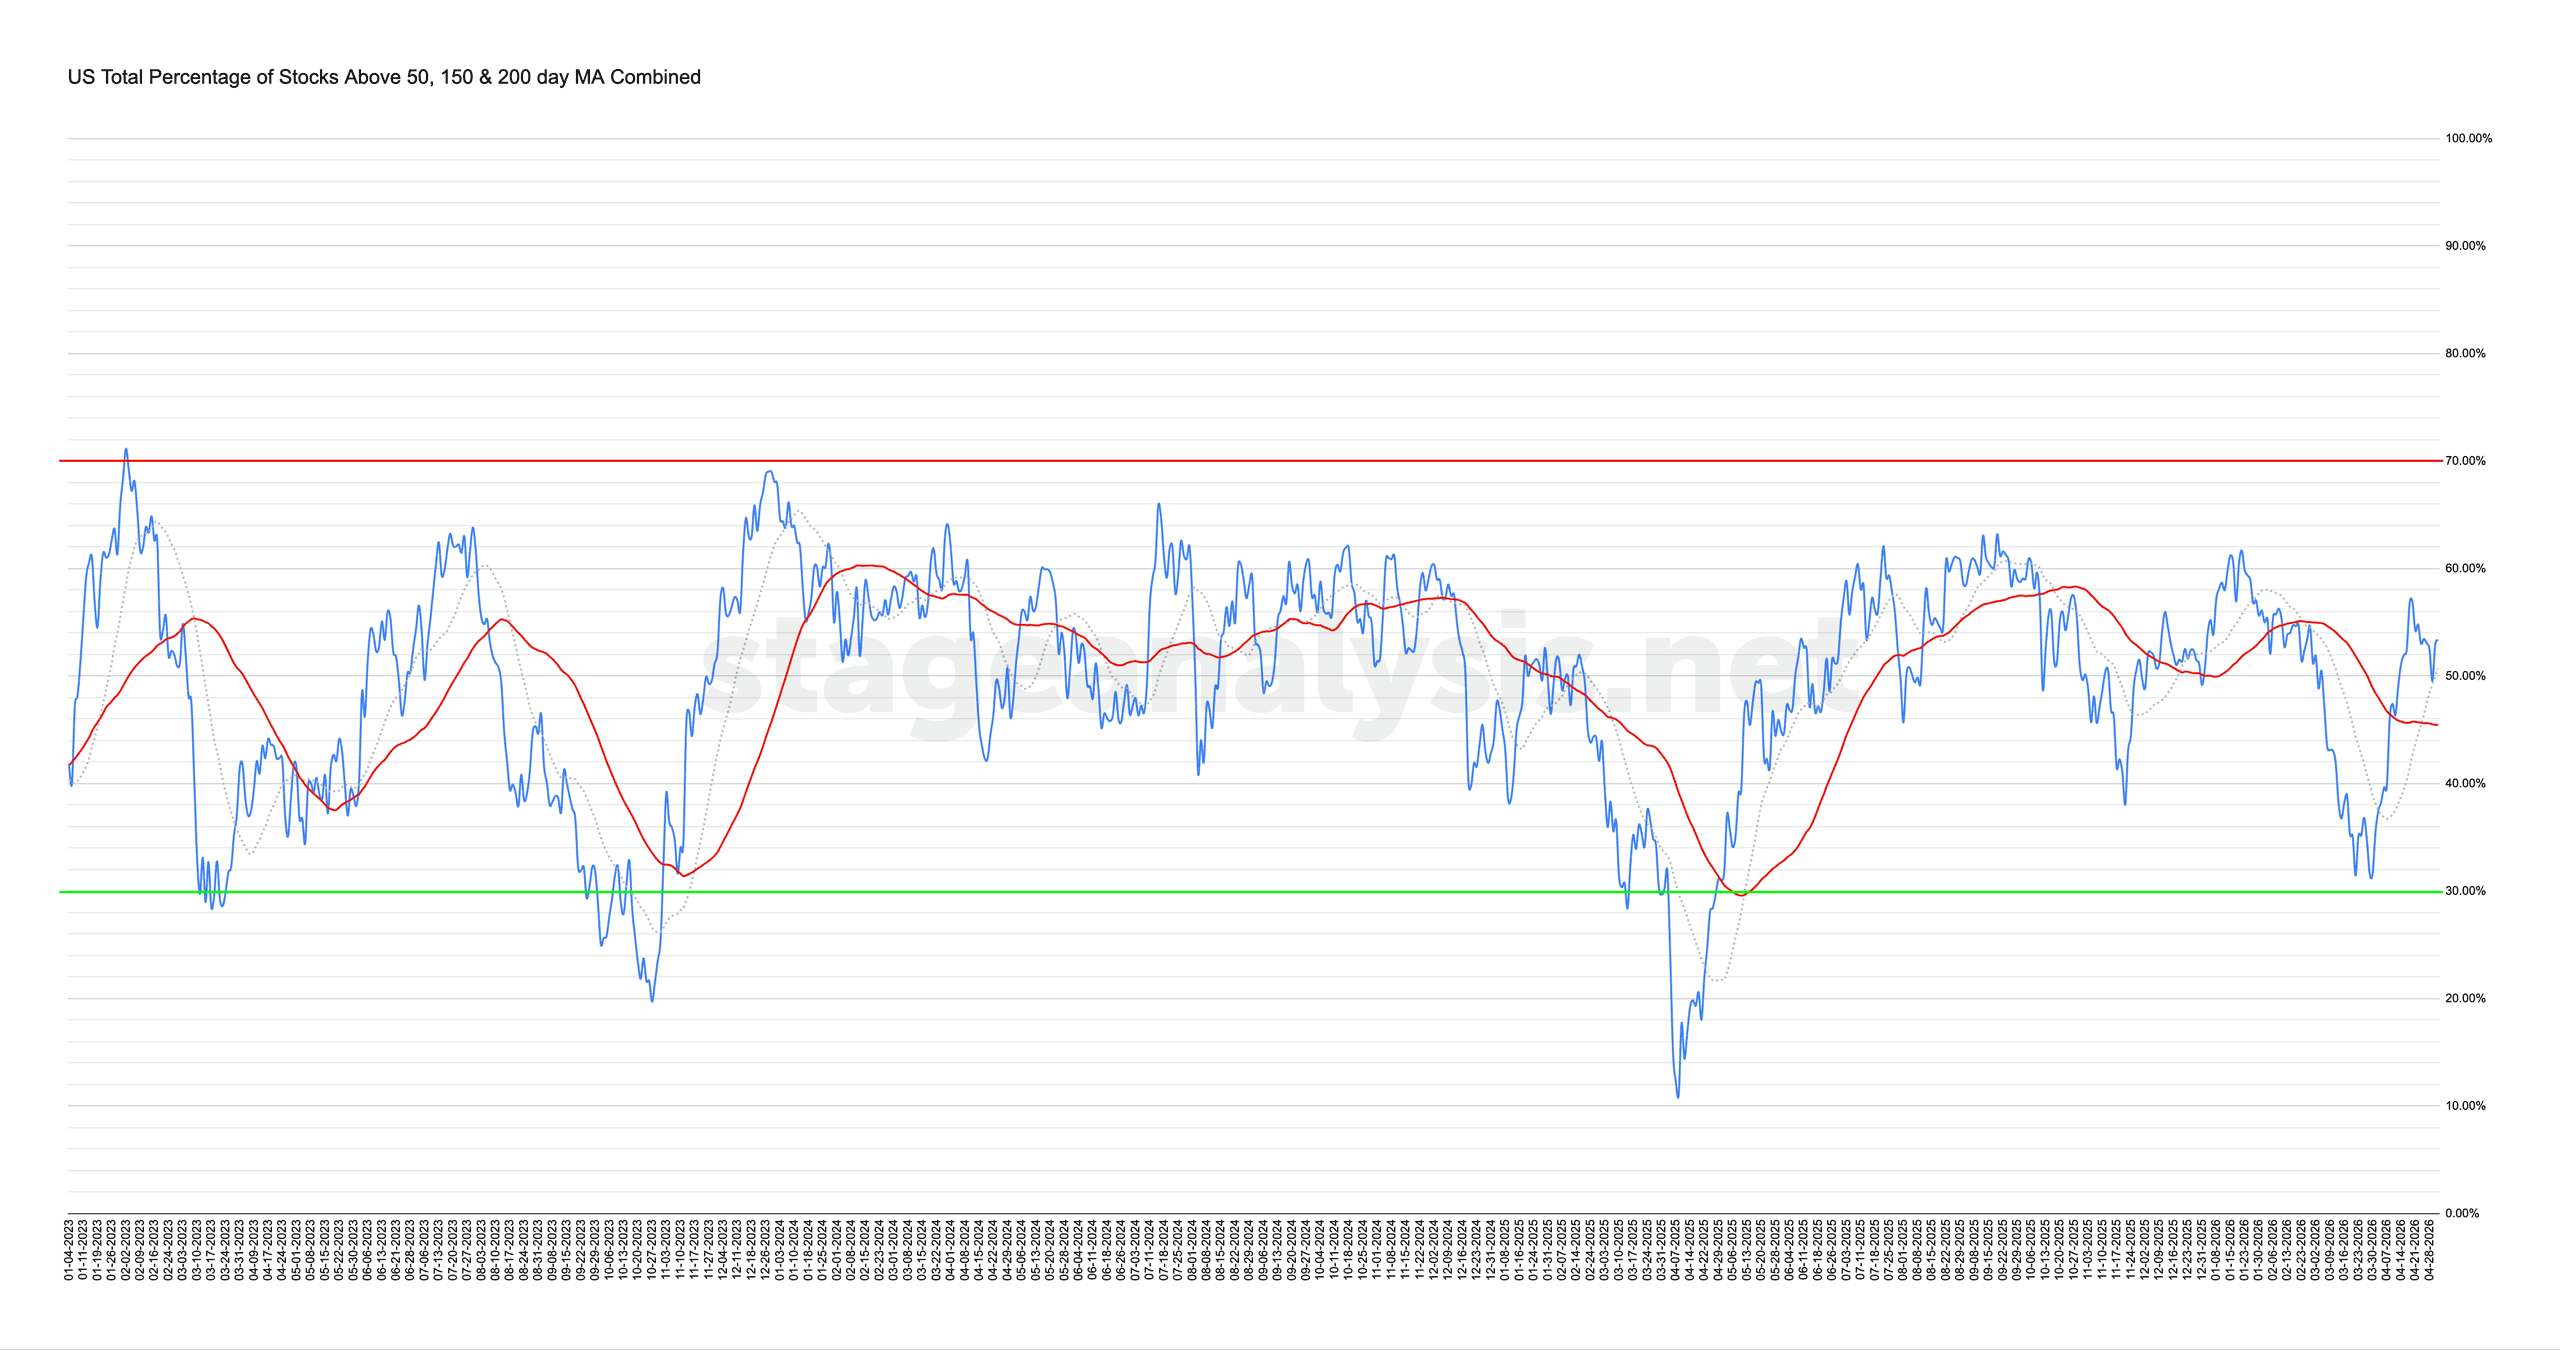
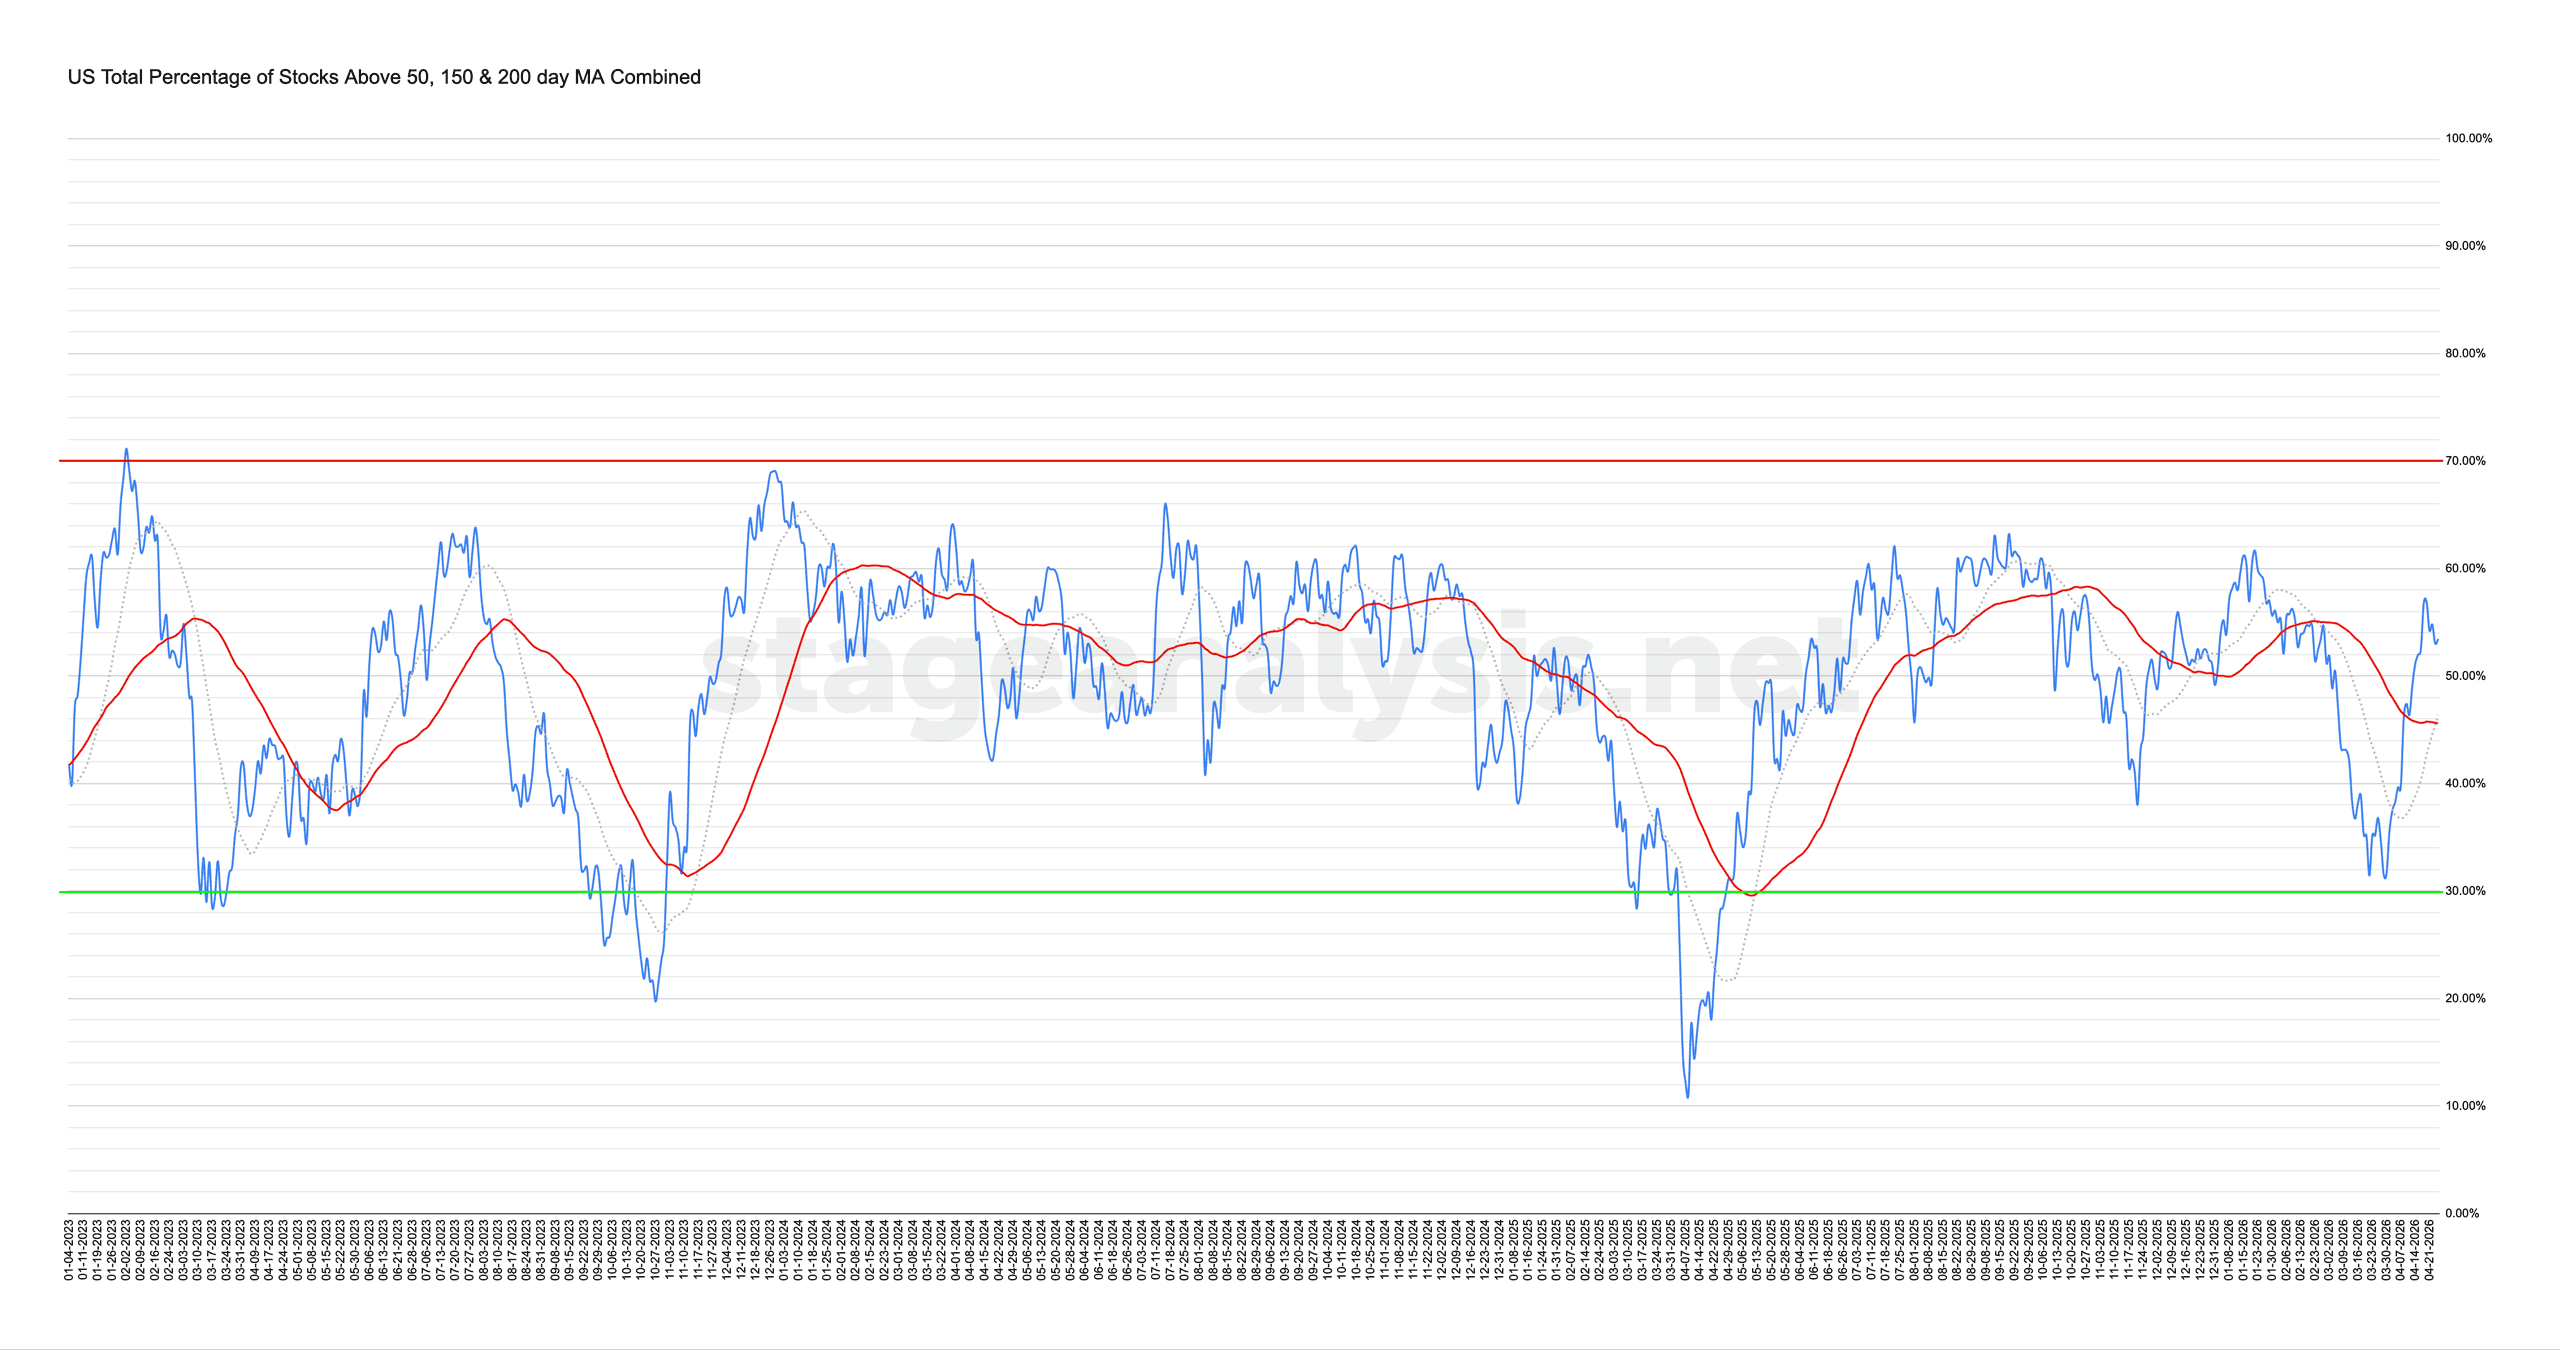
The US Total Percentage of Stocks above their 50 Day, 150 Day & 200 Day Moving Averages (shown above) decreased by -5.30% this week. Therefore, the overall combined average is at 31.43% in the US market (NYSE and Nasdaq markets combined) above their short, medium and long term moving averages.
Read More
Blog – All Posts
The blog shows all articles in date order – including the US Stocks Watchlist, Videos, Indexes, Market Breadth and featured articles on Industry Groups, Sectors or individual Stocks. But if you want see the watchlist posts only, then use the Watchlist tab in the menu, or the category link in the sidebar area.
15 March, 2026
Stage Analysis Weekend Video – 15 March 2026 (38mins)
The Stage Analysis weekend video discussing the Major US Stock Market Indexes, Stage 2 Breakout & Stage 4 Breakdown attempts, Stages Summary, the Sector breadth and Sub-industries Bell Curves, Relative Strength Rankings, the key Market Breadth Charts to determine the Weight of Evidence and ETF Summary.
Read More
13 March, 2026
Market Breadth: Percentage of Stocks Above their 50 Day, 150 Day & 200 Day Moving Averages Combined
The US Total Percentage of Stocks above their 50 Day, 150 Day & 200 Day Moving Averages (shown above) decreased by -6.77% this week. Therefore, the overall combined average is at 36.73% in the US market (NYSE and Nasdaq markets combined) above their short, medium and long term moving averages.
Read More
07 March, 2026
Stage Analysis Members Video – 8 March 2026 (59mins)
The Stage Analysis members video begins this week with a discussion of the most liquid US stock on multiple timeframes, Stage 2 Breakout & Stage 4 Breakdown attempts, Stages Summary, the Sector breadth and Sub-industries Bell Curves, Relative Strength Rankings, the key Market Breadth Charts to determine the Weight of Evidence, Bitcoin & Ethereum, the Major US Stock Market Indexes and ETF Summary.
Read More
07 March, 2026
Market Breadth: Percentage of Stocks Above their 50 Day, 150 Day & 200 Day Moving Averages Combined
The US Total Percentage of Stocks above their 50 Day, 150 Day & 200 Day Moving Averages (shown above) decreased by -7.71% this week. Therefore, the overall combined average is at 43.49% in the US market (NYSE and Nasdaq markets combined) above their short, medium and long term moving averages.
Read More
06 March, 2026
US Stocks Watchlist – 6 March 2026
There were 18 stocks highlighted from the US stocks watchlist scans today...
Read More
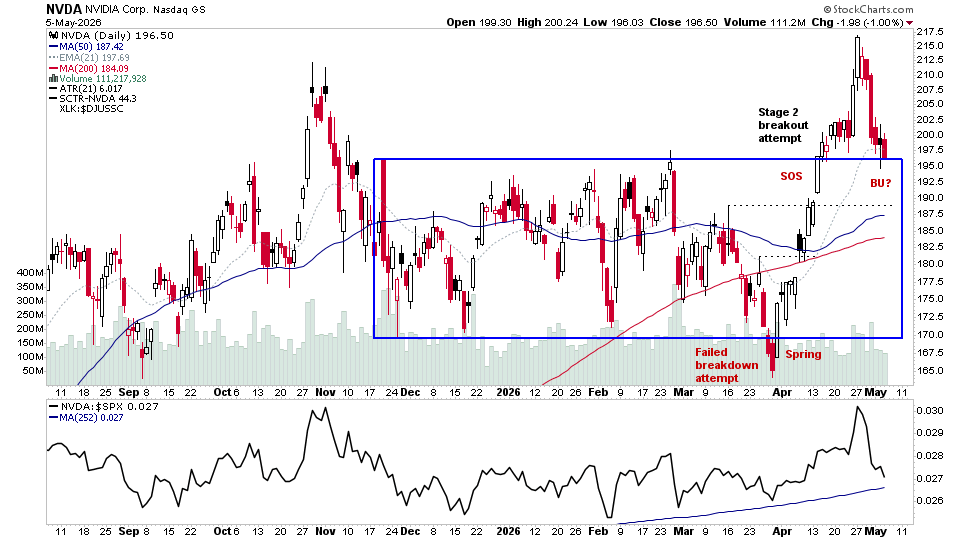
04 March, 2026
US Stocks Watchlist – 4 March 2026
There were 20 stocks highlighted from the US stocks watchlist scans today...
Read More
01 March, 2026
Stage Analysis Members Video – 1 March 2026 (58mins)
The Stage Analysis members video beginning with a discussion of the latest US Watchlist Stocks in detail on multiple timeframes, Stage 2 Breakout attempts, Stages Summary, the Sector breadth and Sub-industries Bell Curves, Relative Strength Rankings, the key Market Breadth Charts to determine the Weight of Evidence, Bitcoin & Ethereum, the Major US Stock Market Indexes and ETF Summary.
Read More
28 February, 2026
US Stocks Watchlist – 2 March 2026
There are 21 stocks highlighted from the weekends US stocks watchlist scans...
Read More
27 February, 2026
Market Breadth: Percentage of Stocks Above their 50 Day, 150 Day & 200 Day Moving Averages Combined
The US Total Percentage of Stocks above their 50 Day, 150 Day & 200 Day Moving Averages (shown above) decreased by -3.49% this week. Therefore, the overall combined average is at 51.20% in the US market (NYSE and Nasdaq markets combined) above their short, medium and long term moving averages.
Read More