Custom Percentage of Stocks Above Their 50 Day, 150 Day & 200 Day Moving Averages Combined Market Breadth Charts for the Overall US Market, NYSE and Nasdaq for Market Timing and Strategy.
Read More

Blog
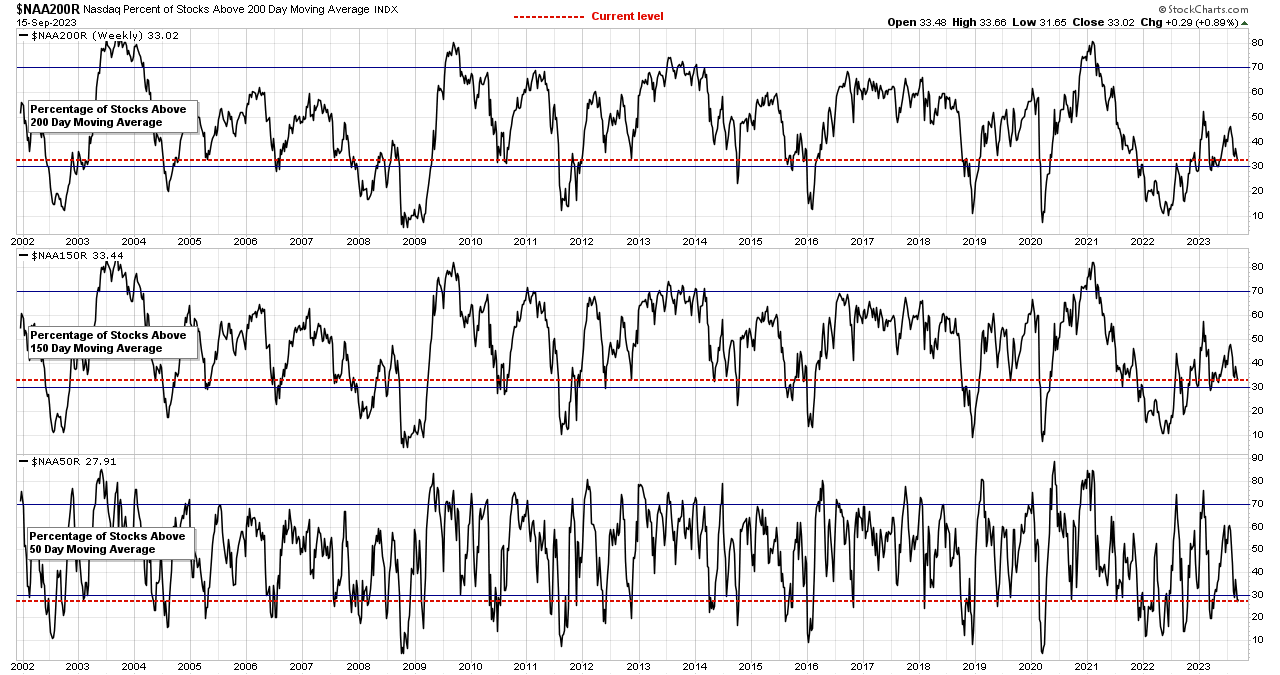
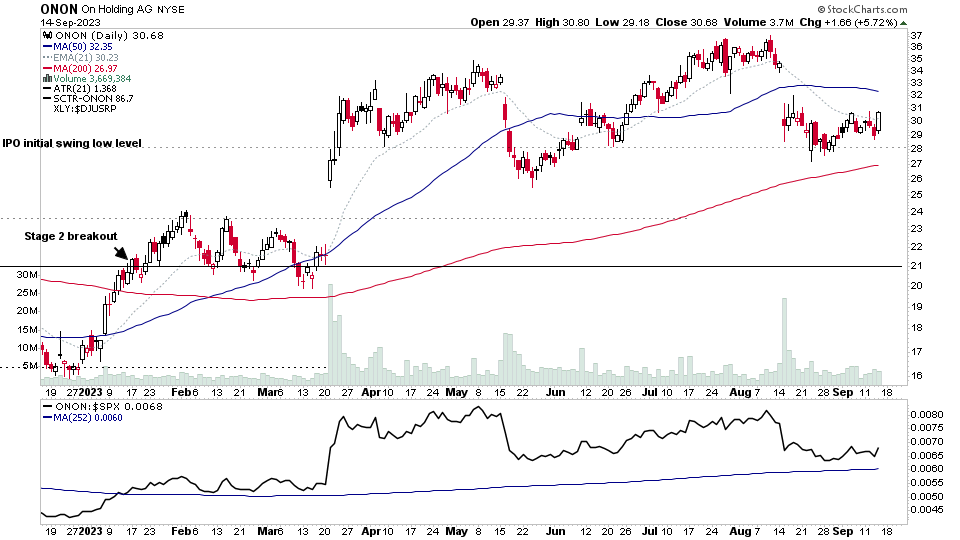
14 September, 2023
US Stocks Watchlist – 14 September 2023
There were 17 stocks highlighted from the US stocks watchlist scans today...
Read More
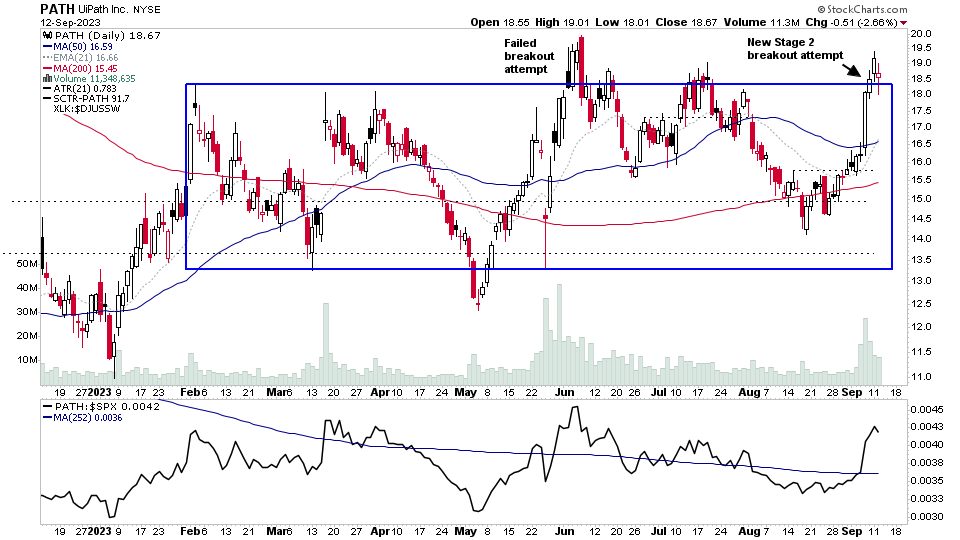
12 September, 2023
US Stocks Watchlist – 12 September 2023
There were 19 stocks highlighted from the US stocks watchlist scans today...
Read More
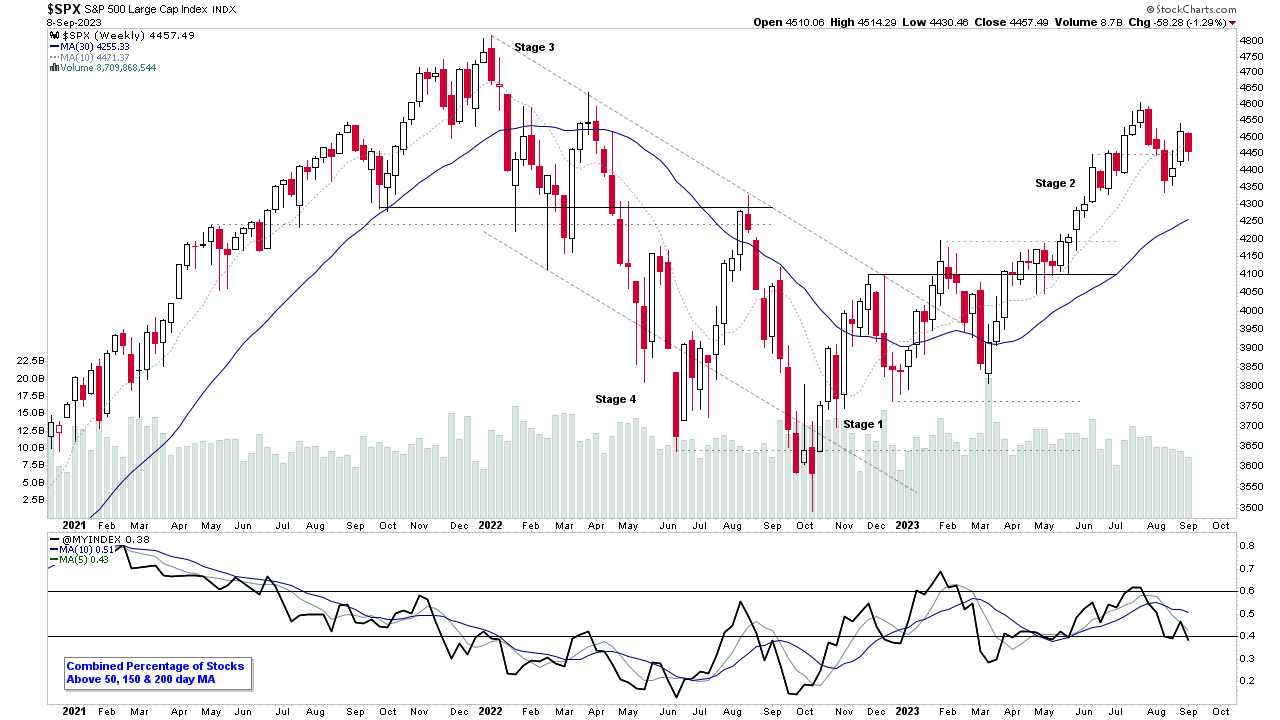
10 September, 2023
Stage Analysis Members Video – 10 September 2023 (1hr 17mins)
Stage Analysis weekend video featuring the regular members content of the the Major US Indexes Update, Futures SATA Charts, Industry Groups RS Rankings, IBD Industry Group Bell Curve, Market Breadth Update to help to determine the weight of evidence, strong volume movers in Stage 1 and Stage 2 and finally the US Watchlist Stocks from the recent posts with detailed live markups on multiple timeframes.
Read More
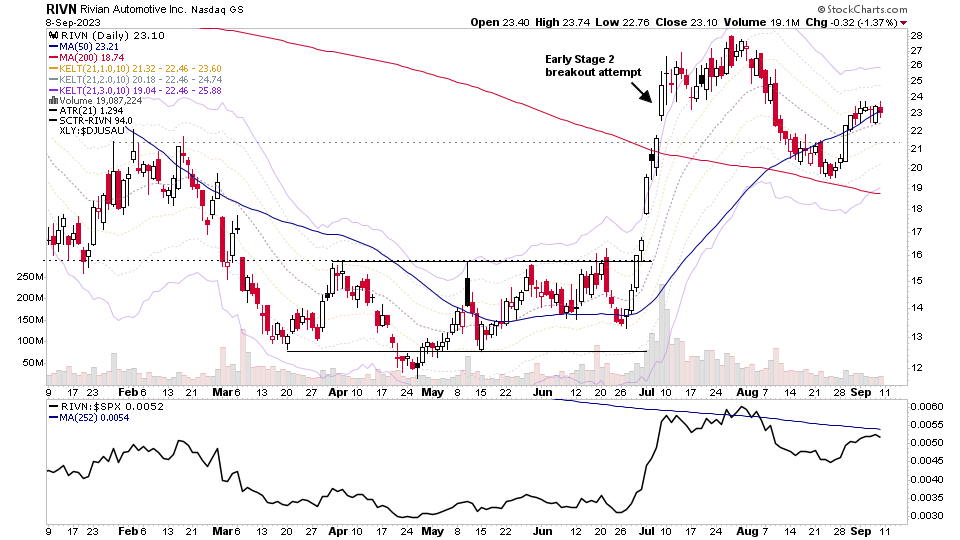
10 September, 2023
US Stocks Watchlist – 10 September 2023
There were 16 stocks highlighted from the US stocks watchlist scans today...
Read More
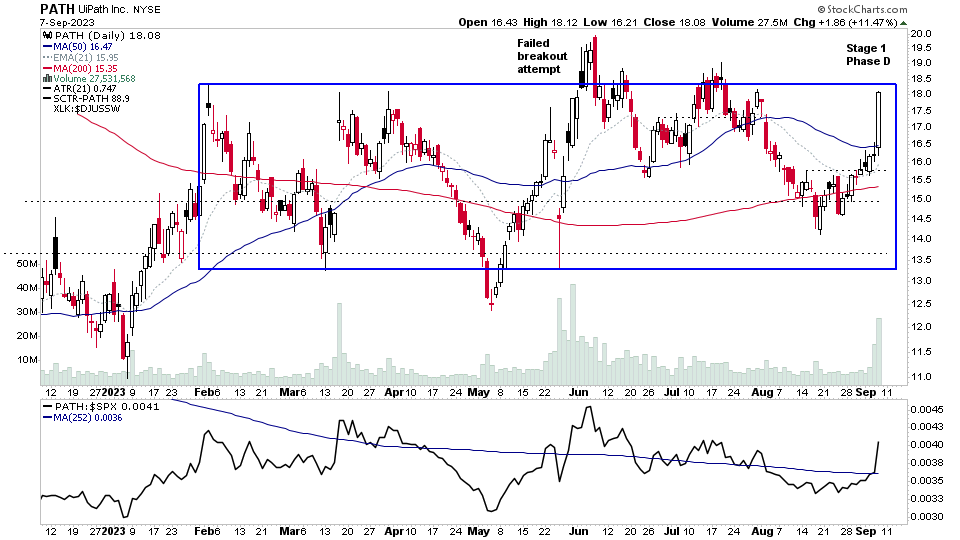
08 September, 2023
US Stocks Watchlist – 7 September 2023
There were 25 stocks highlighted from the US stocks watchlist scans today...
Read More
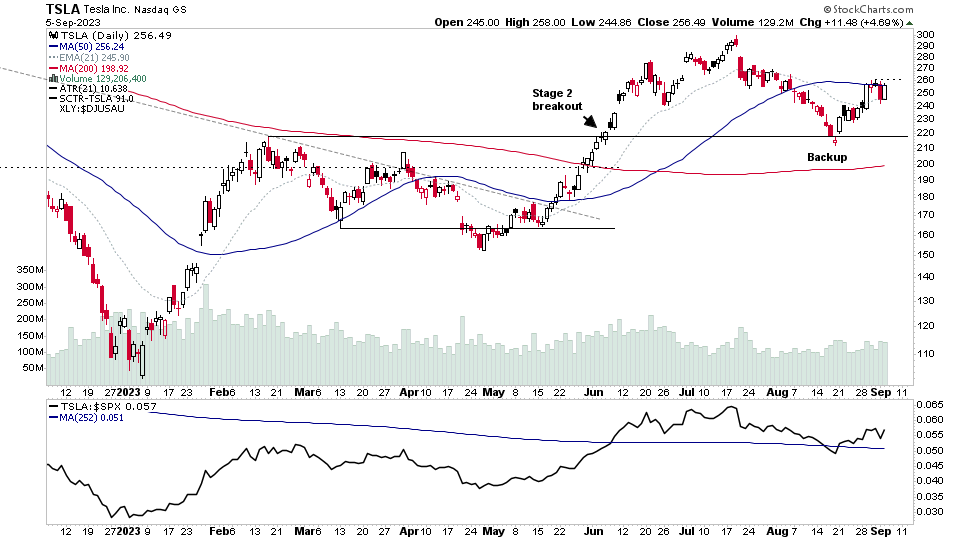
05 September, 2023
US Stocks Watchlist – 5 September 2023
There were 16 stocks highlighted from the US stocks watchlist scans today...
Read More
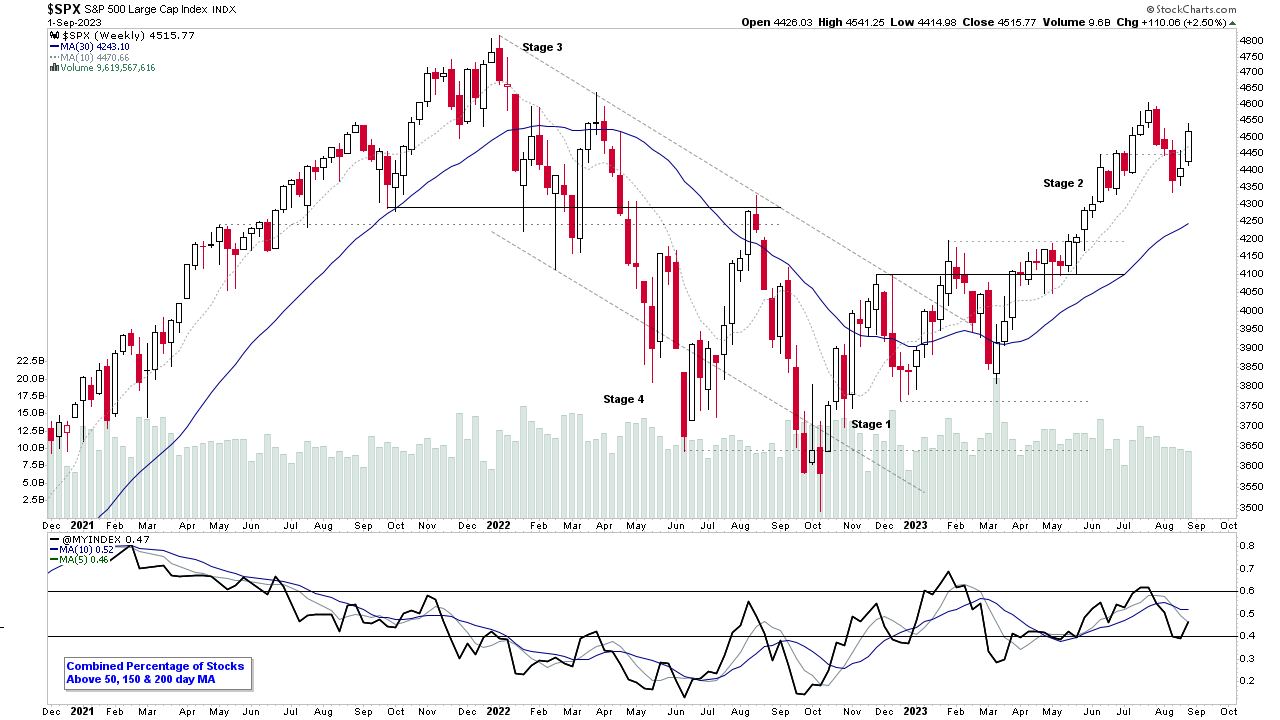
03 September, 2023
Stage Analysis Members Video – 3 September 2023 (1hr 34mins)
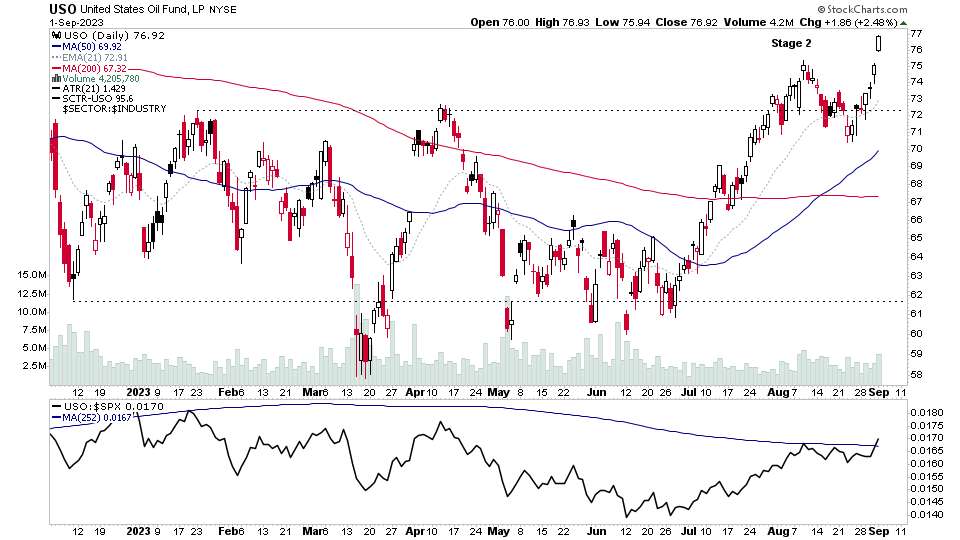
Stage Analysis members video discussing of the US market indexes, futures charts including the Crude Oil Stage 2 Breakout, industry groups, watchlist stocks and the essential market breadth measures that we use in the Stage Analysis method to determine the Weight of Evidence...
Read More
03 September, 2023
Crude Oil Futures Stage 2 Breakout Attempt and the US Stocks Watchlist – 3 September 2023
There were 28 stocks highlighted from the US stocks watchlist scans today...
Read More
31 August, 2023
US Stocks Watchlist – 31 August 2023
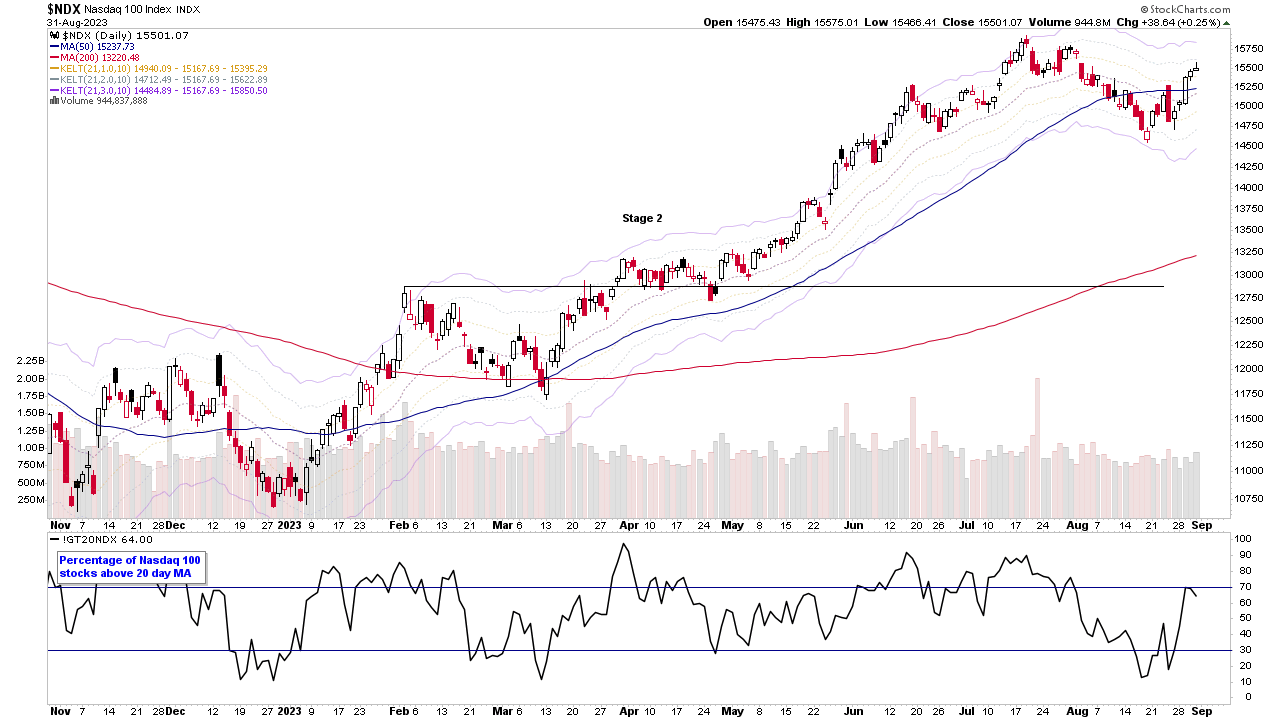
The strength this week has taken the Nasdaq 100 back above its 50 day MA and +1x ATR(21 day) level, which we use to help to determine the short-term trend. As if the rebound rally attempt is real, and not just an Upthrust, then the expectation would be for it to hold the 50 day MA and Tuesdays Significant Bar on any retest in the coming days...
Read More