There were 22 stocks highlighted from the US stocks watchlist scans today. I'll discuss the watchlist stocks and group themes in detail in the members weekend video...
Read More

Blog
23 July, 2023
US Stocks Watchlist – 23 July 2023
20 July, 2023
US Stocks Watchlist – 20 July 2023
There were 31 stocks highlighted from the US stocks watchlist scans today...
Read More
19 July, 2023
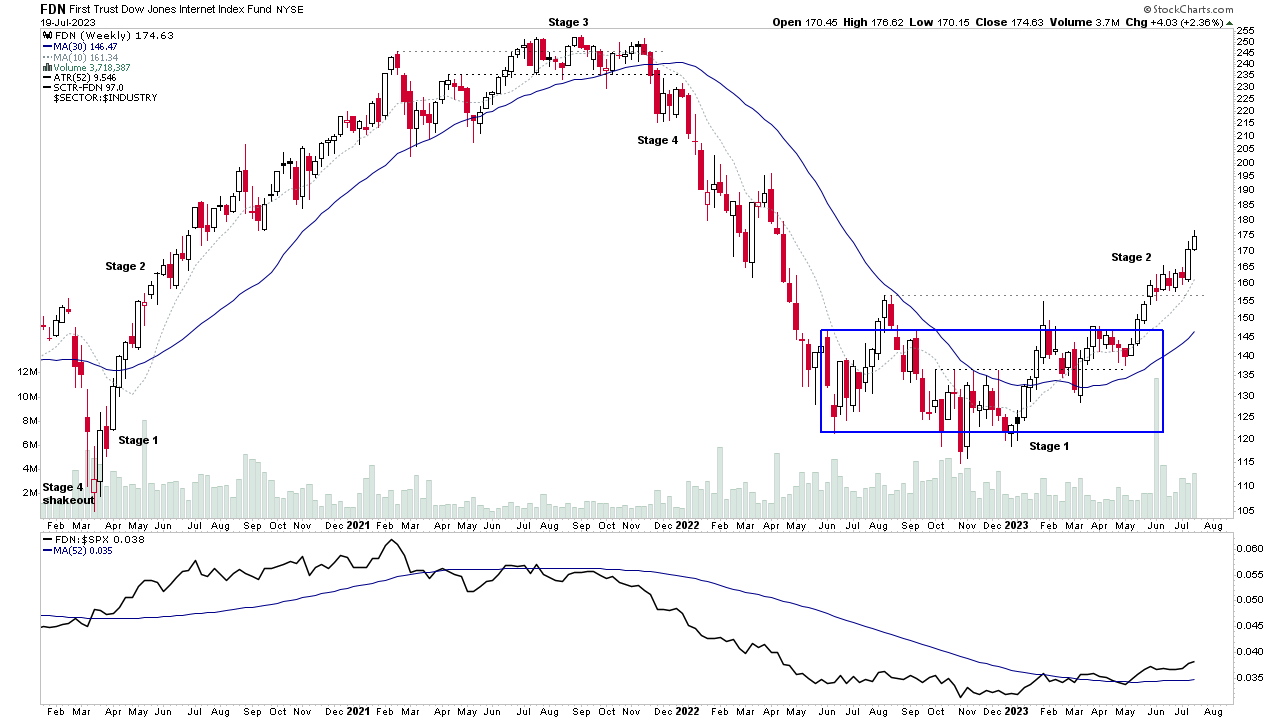
Group Focus Video: Internet – 19 July 2023 (49mins)
This weeks group focus video is on the Internet group, which has been one of the leading groups (in the top 10 of the RS Rankings) since mid March. So with earnings season underway, and multiple stocks from the group reporting in the coming weeks, it's a good time to review the groups overall position in its Stage 2 advance...
Read More
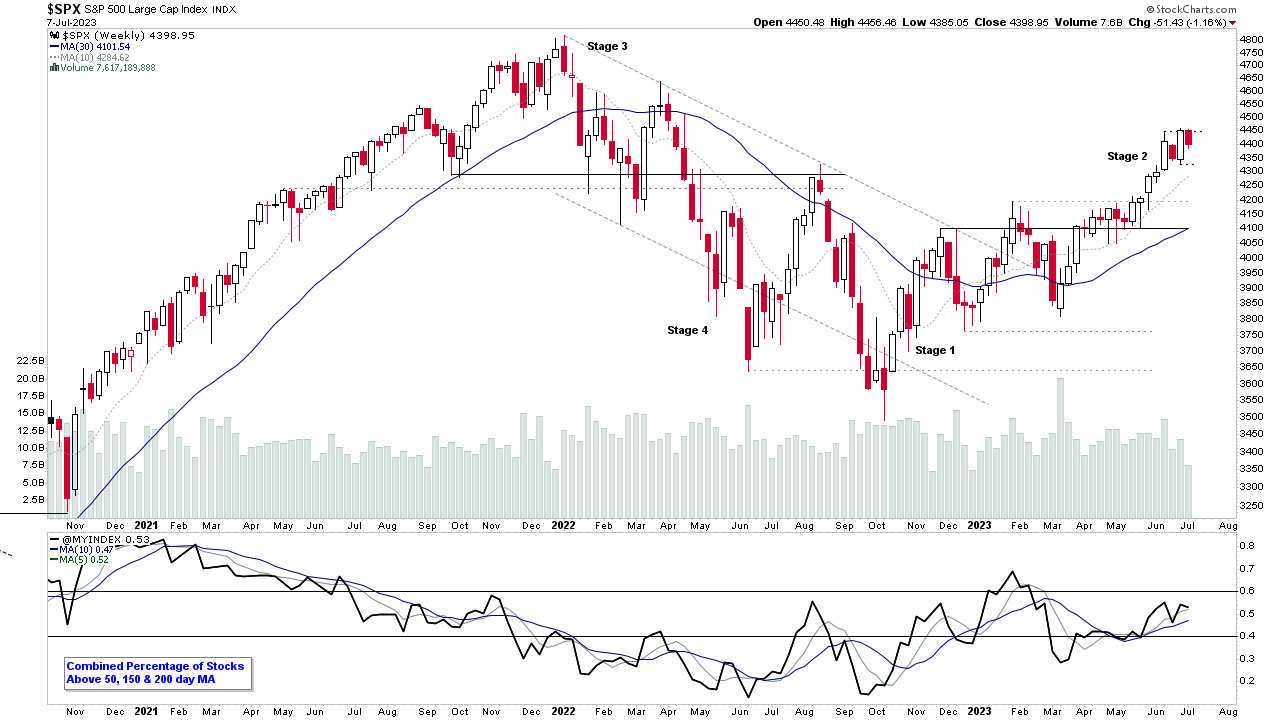
18 July, 2023
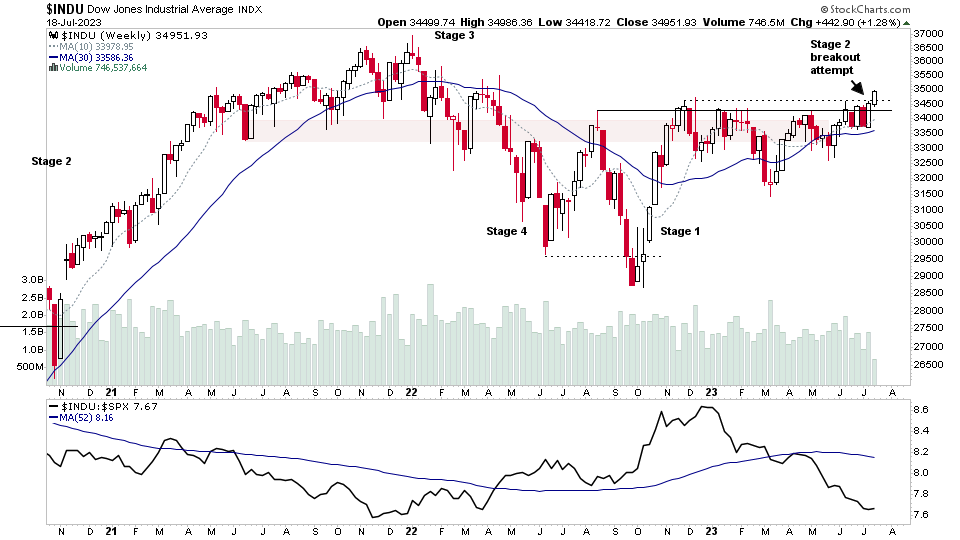
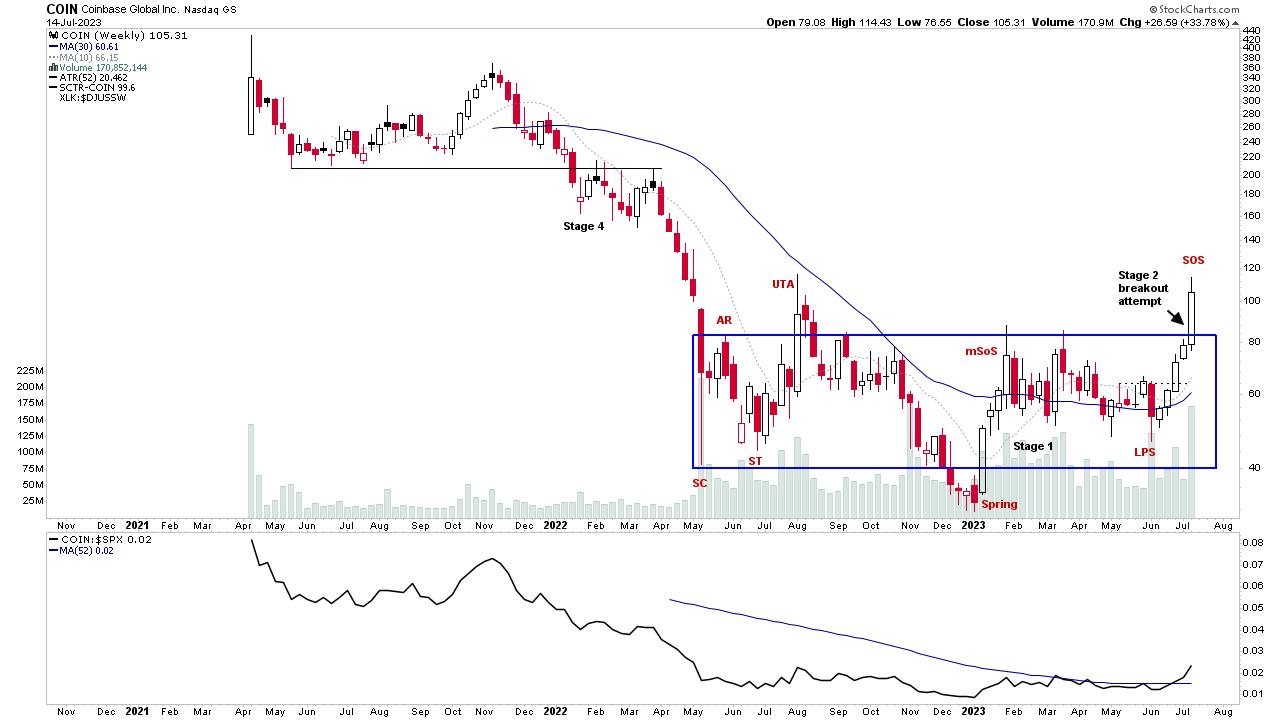
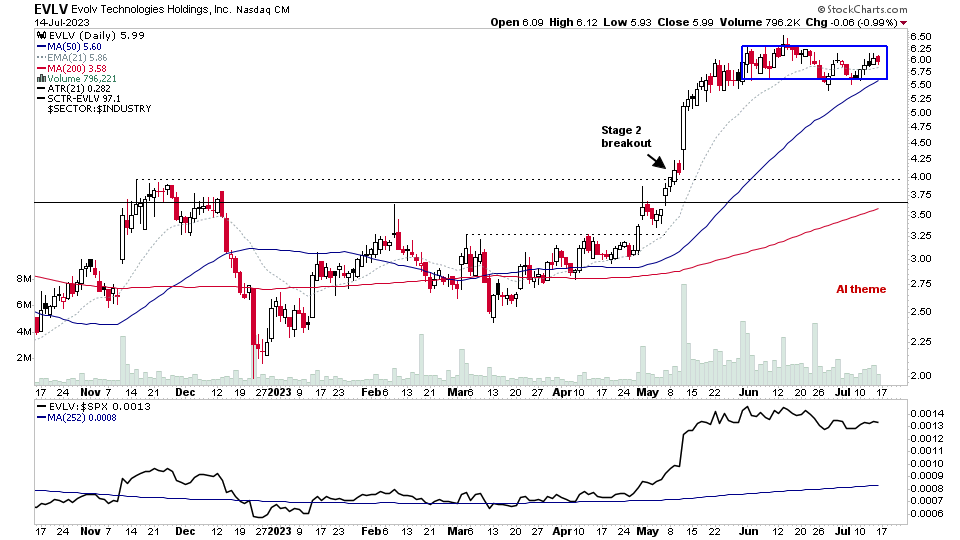
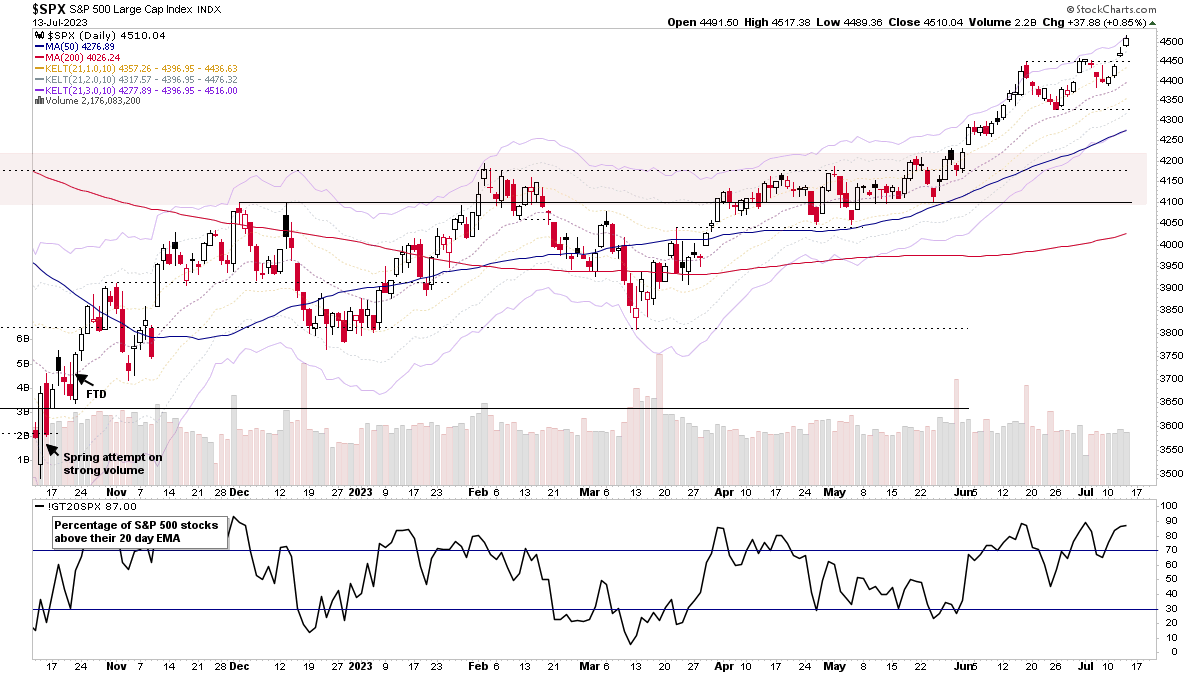
Dow Jones Stage 2 Breakout Attempt and the US Stocks Watchlist – 18 July 2023
There were 30 stocks highlighted from the US stocks watchlist scans today...
Read More
16 July, 2023
Stage Analysis Members Video – 16 July 2023 (1hr 25mins)
Stage Analysis members weekend video beginning with a discussion of some of the weeks strongest Stage 2 breakout attempts on volume, followed by the regular member content...
Read More
16 July, 2023
US Stocks Watchlist – 16 July 2023
There were 20 stocks highlighted from the US stocks watchlist scans today. I'll discuss the watchlist stocks and group themes in detail in the members weekend video...
Read More
13 July, 2023
US Stocks Watchlist – 13 July 2023
There were 26 stocks highlighted from the US stocks watchlist scans today...
Read More
12 July, 2023
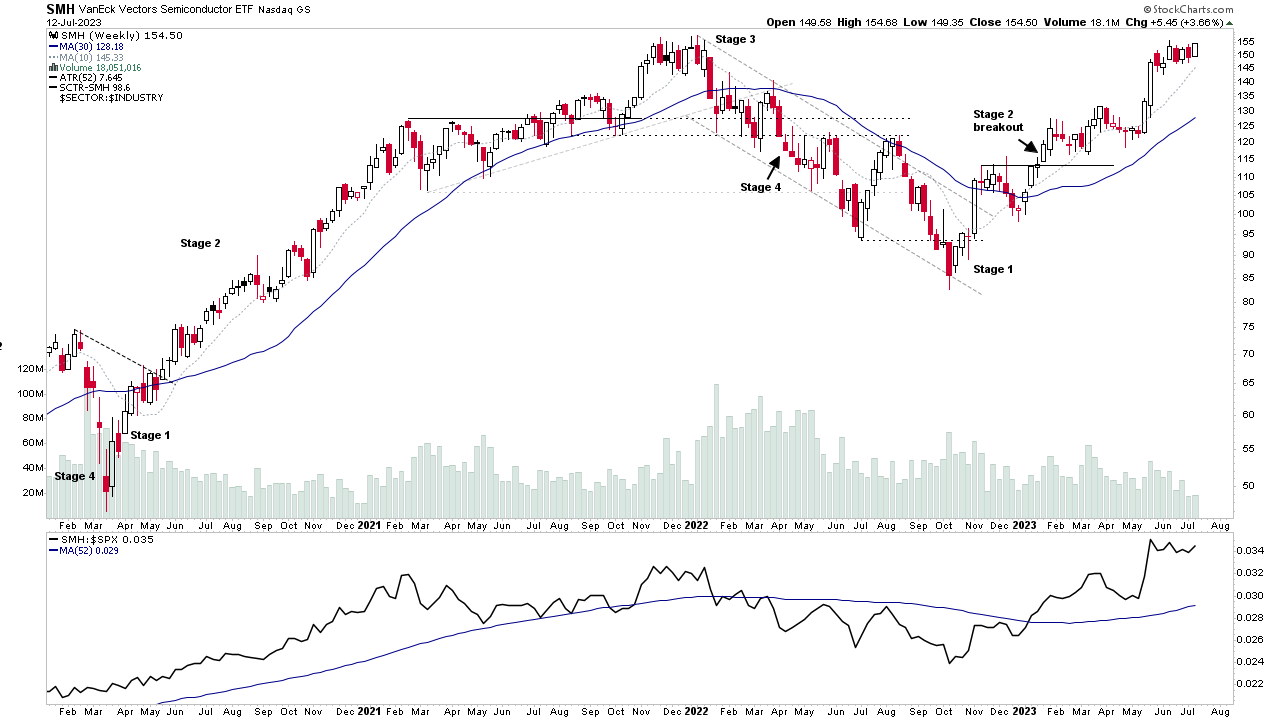
Group Focus: Semiconductors Review Before Earnings Results – 12 July 2023 (57mins)
This weeks midweek video is a special group focus, following up on the strong Semiconductors group. Which I discussed at length in multiple videos and posts at the beginning of the year as it moved into early Stage 2, and it has since gone on to be one of this years leading groups. With multiple periods at the top of the Relative Strength rankings as it has advanced higher in Stage 2 over the last six months...
Read More
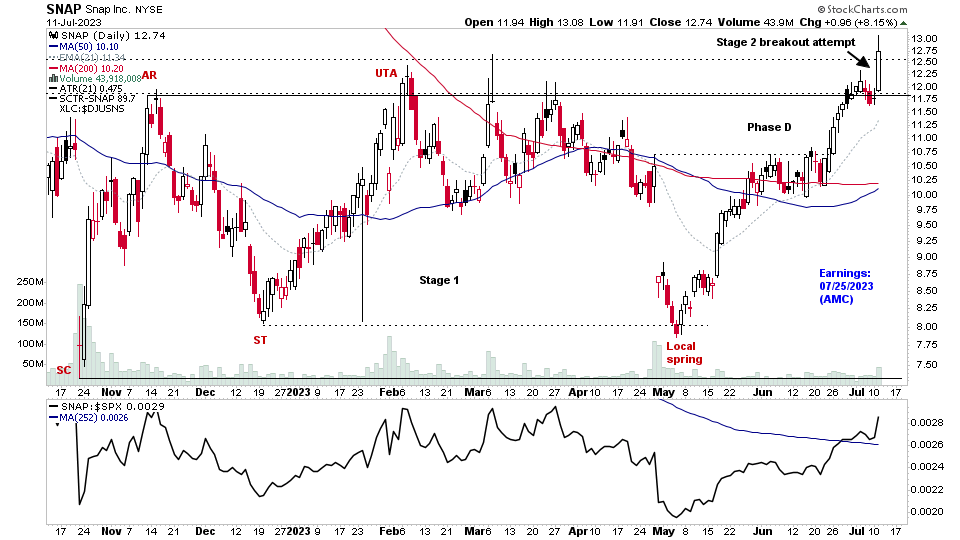
11 July, 2023
US Stocks Watchlist – 11 July 2023
There were 36 stocks highlighted from the US stocks watchlist scans today...
Read More
09 July, 2023
Stage Analysis Members Video – 9 July 2023 (1hr 28mins)
Stage Analysis members weekend video featuring the Major US Stock Market Indexes Update, Futures SATA Charts, Industry Groups RS Rankings, IBD Industry Group Bell Curve, Market Breadth Update to help to determine the weight of evidence, Stage 2 breakouts on volume, and finally the US Watchlist Stocks from the weekend scans in detail on multiple timeframes.
Read More