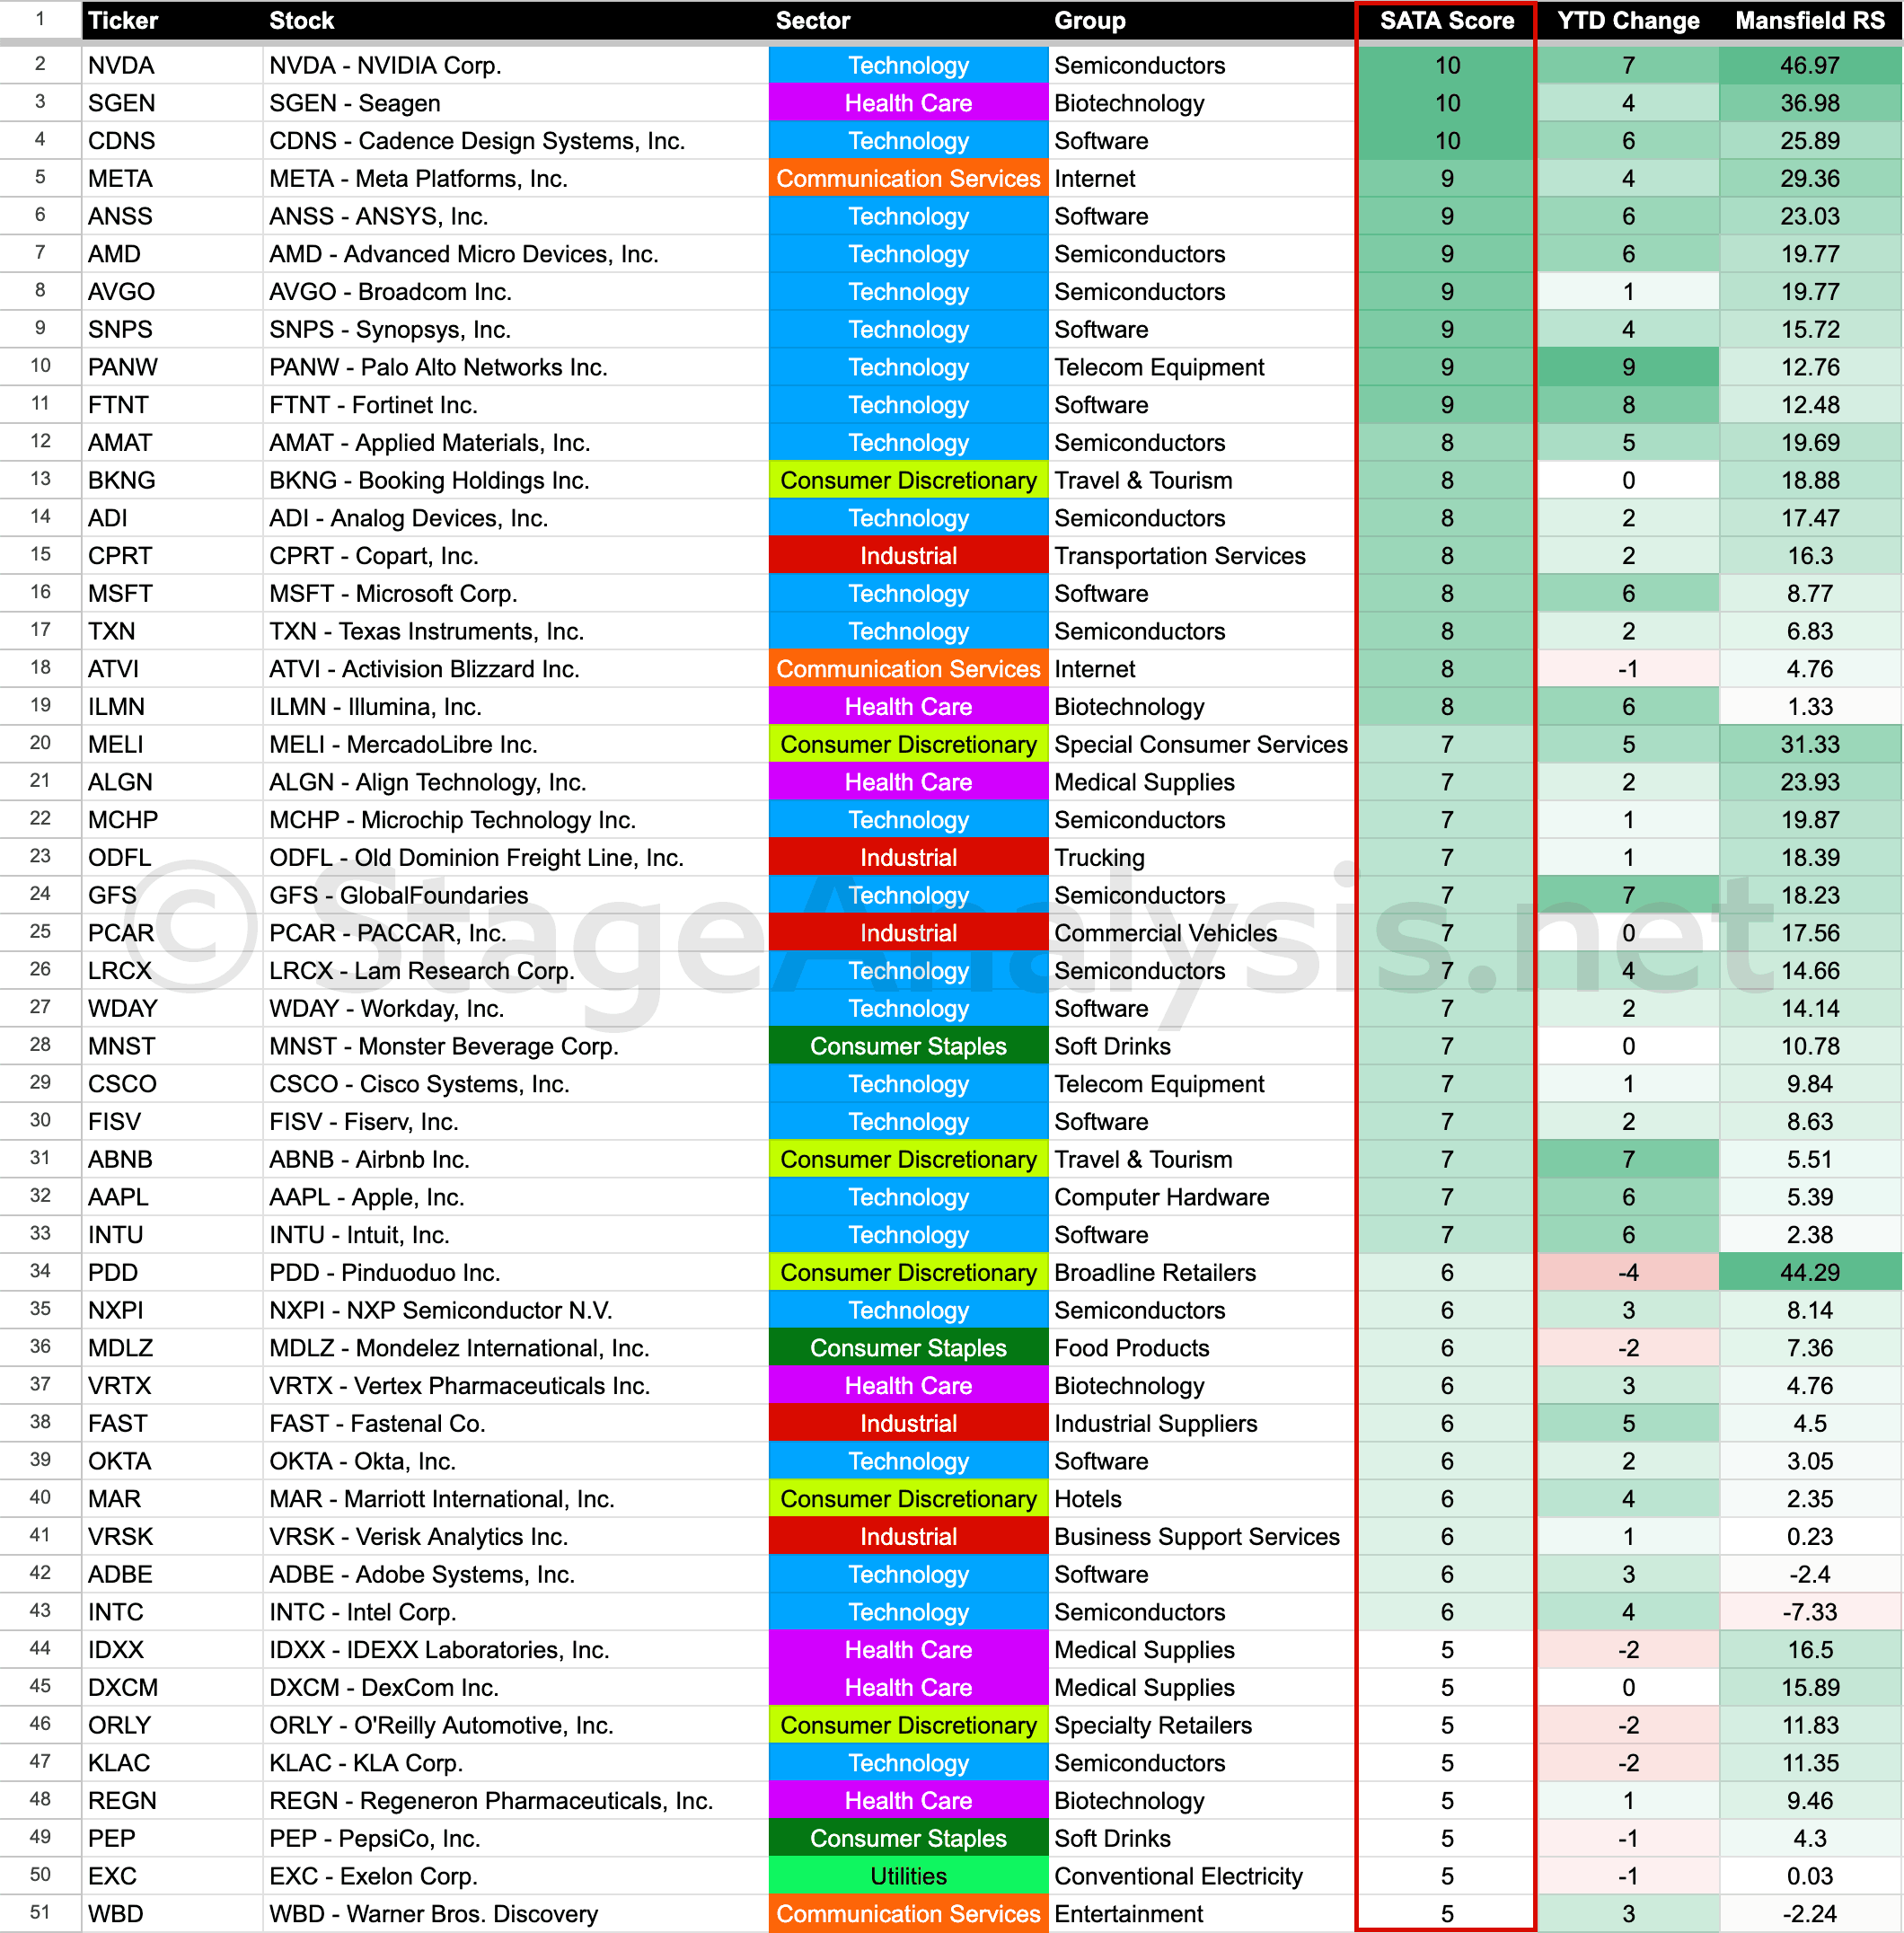
The Stage Analysis Technical Attributes (SATA) score is our proprietary indicator that helps to identify the four stages from Stan Weinstein's Stage Analysis method, using a scoring system from 0 to 10 that rates ten of the key technical characteristics that we look for when analysing the weekly charts.
Read More

Blog
10 April, 2023
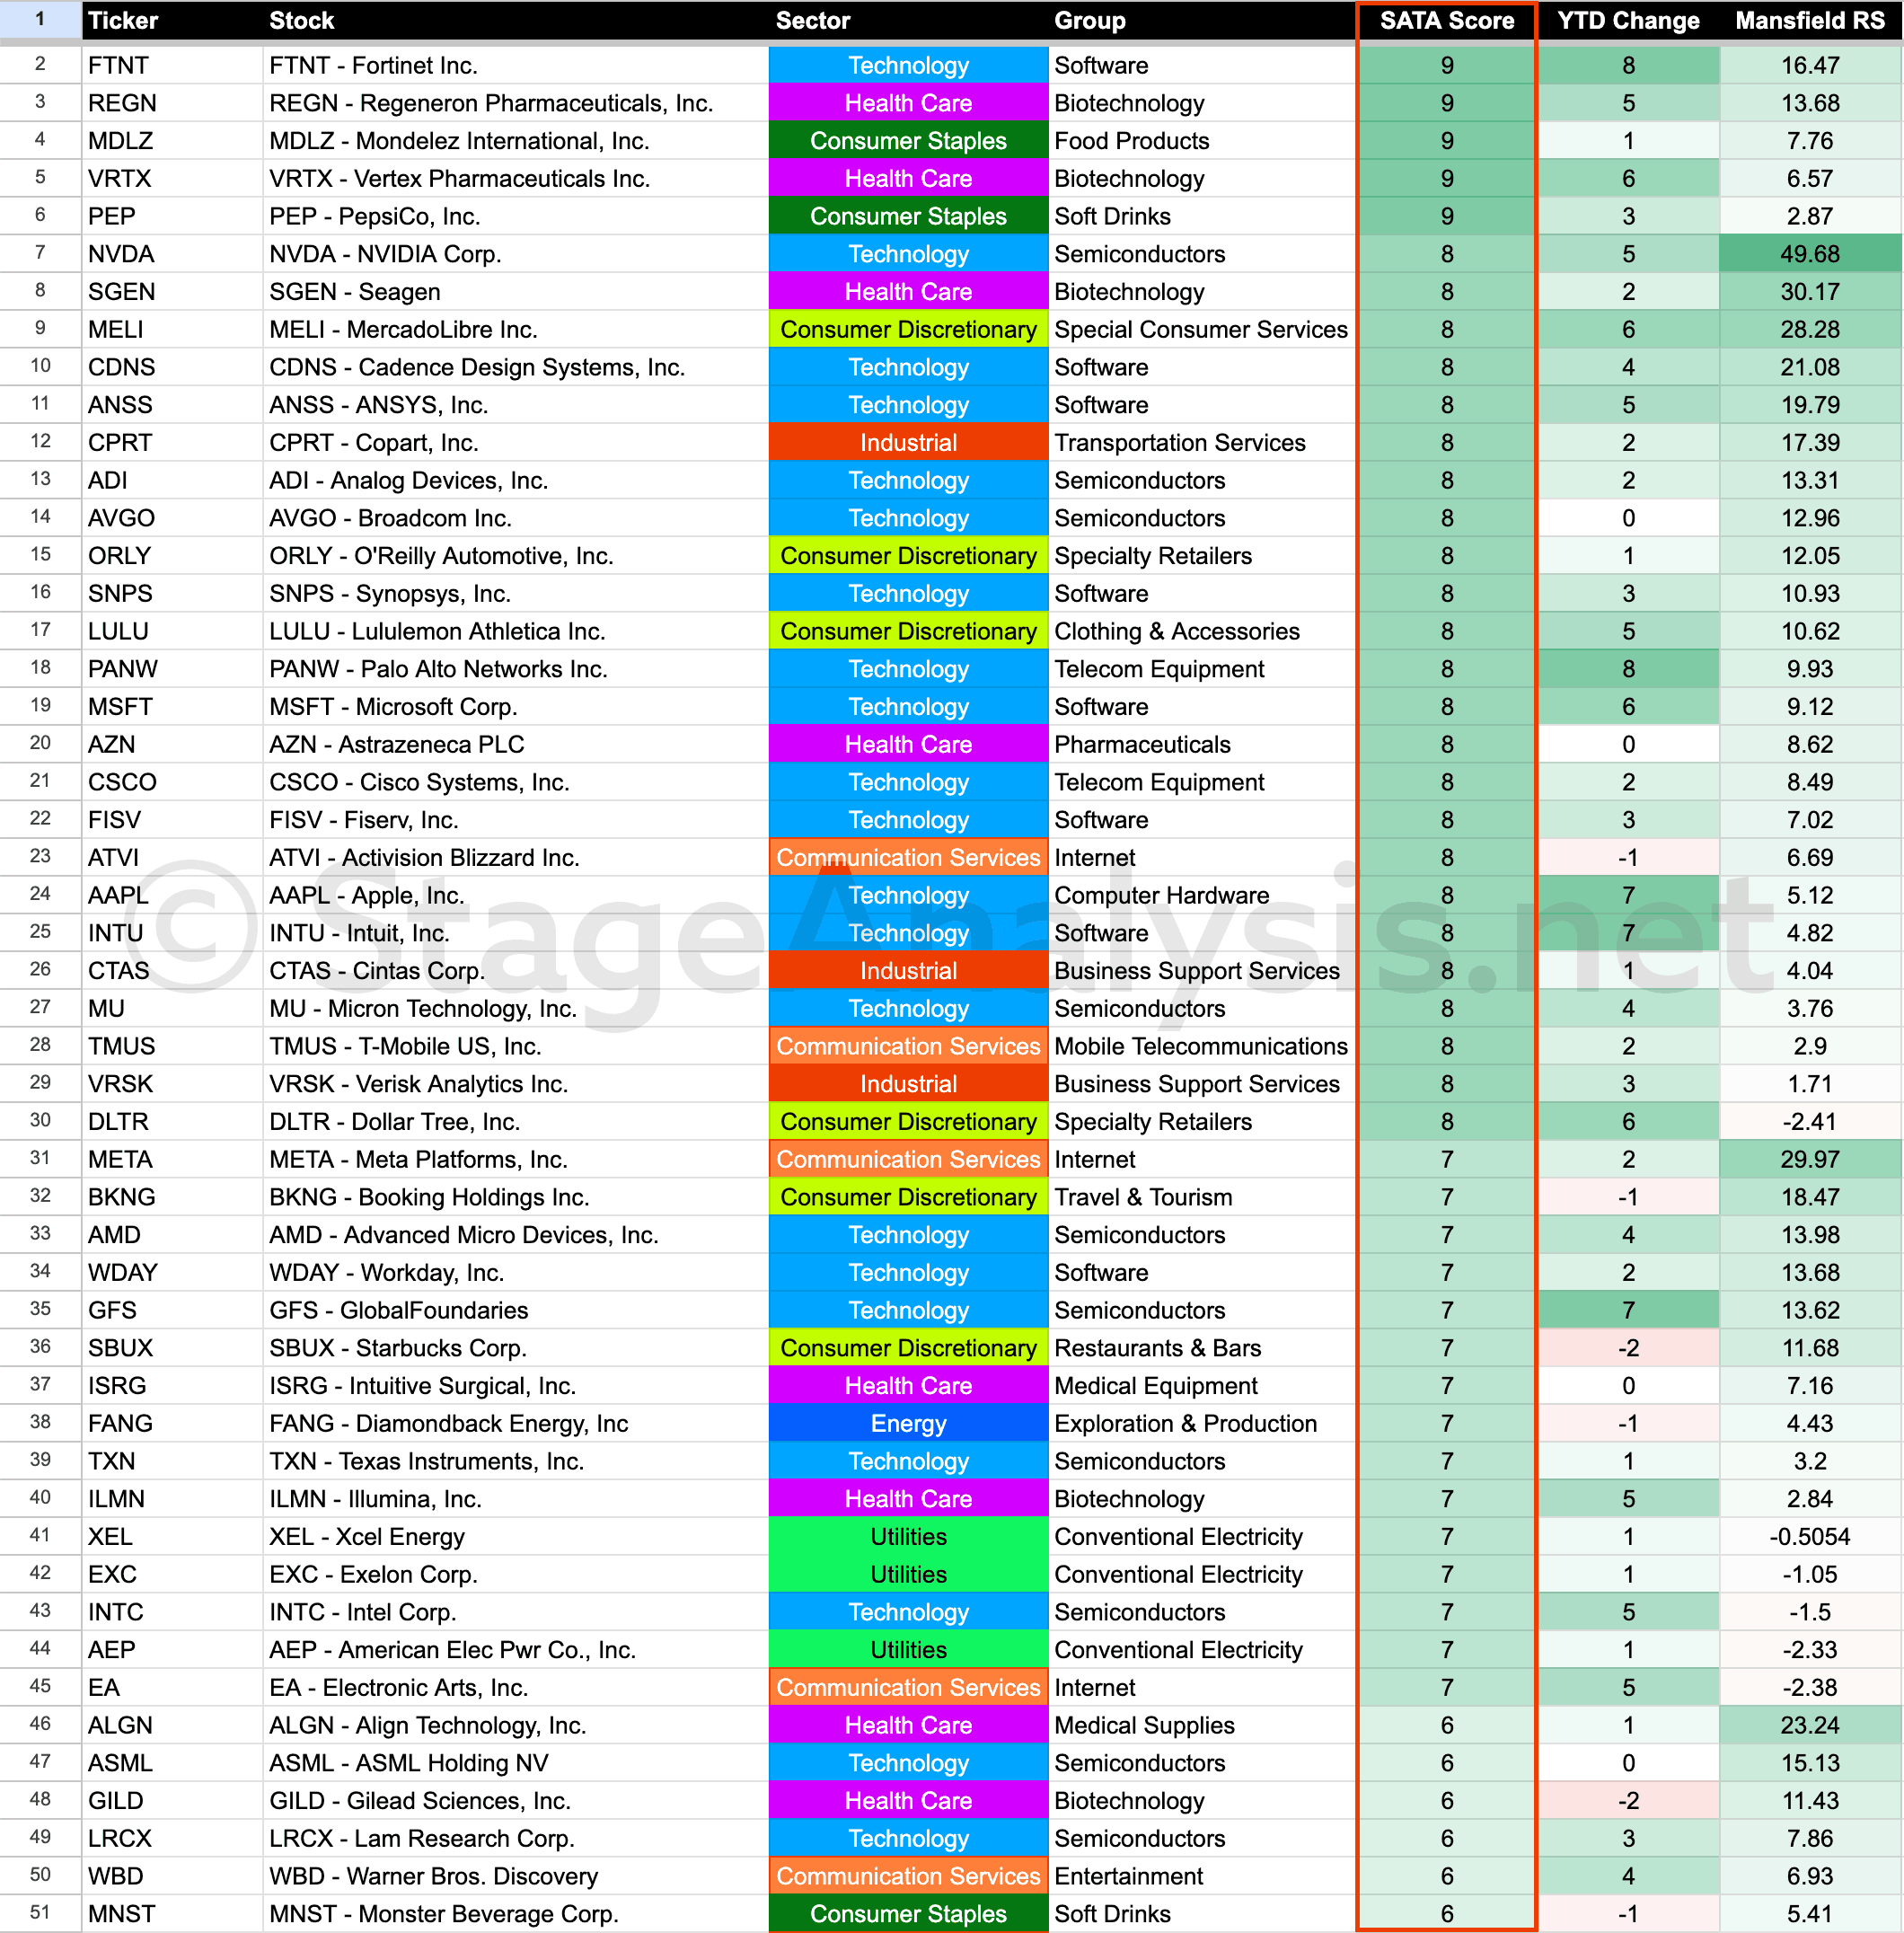
Stage Analysis Technical Attributes Scores – Nasdaq 100
09 April, 2023
Stage Analysis Members Video – 9 April 2023 (1hr 21mins)
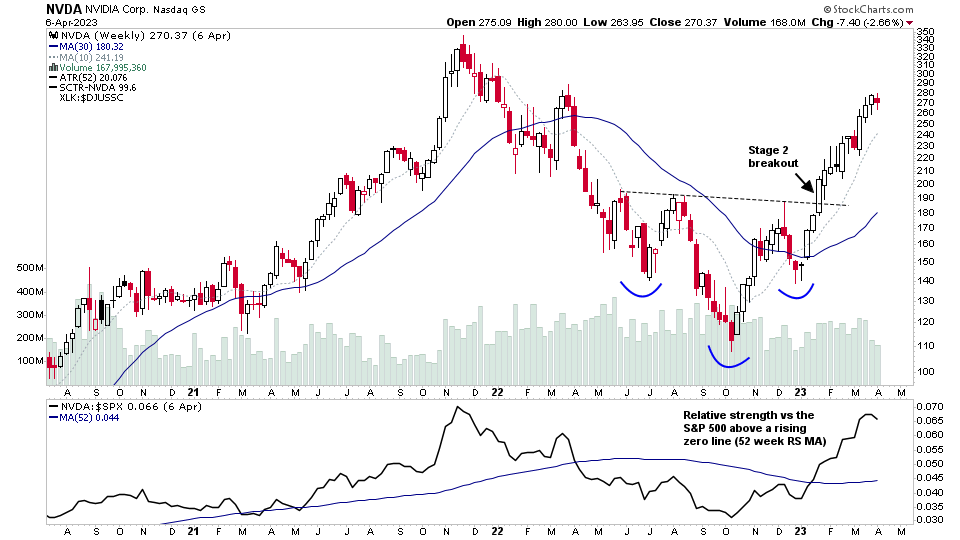
The Stage Analysis members weekend video this week begins with a feature on the mega cap stocks, as many are attempting to move into early Stage 2. Then the more regular member content covering the major US stock market indexes update, Futures stock charts, US Stocks Industry Groups Relative Strength (RS) Rankings...
Read More
02 April, 2023
Stage Analysis Members Video – 2 April 2023 (1hr 17mins)
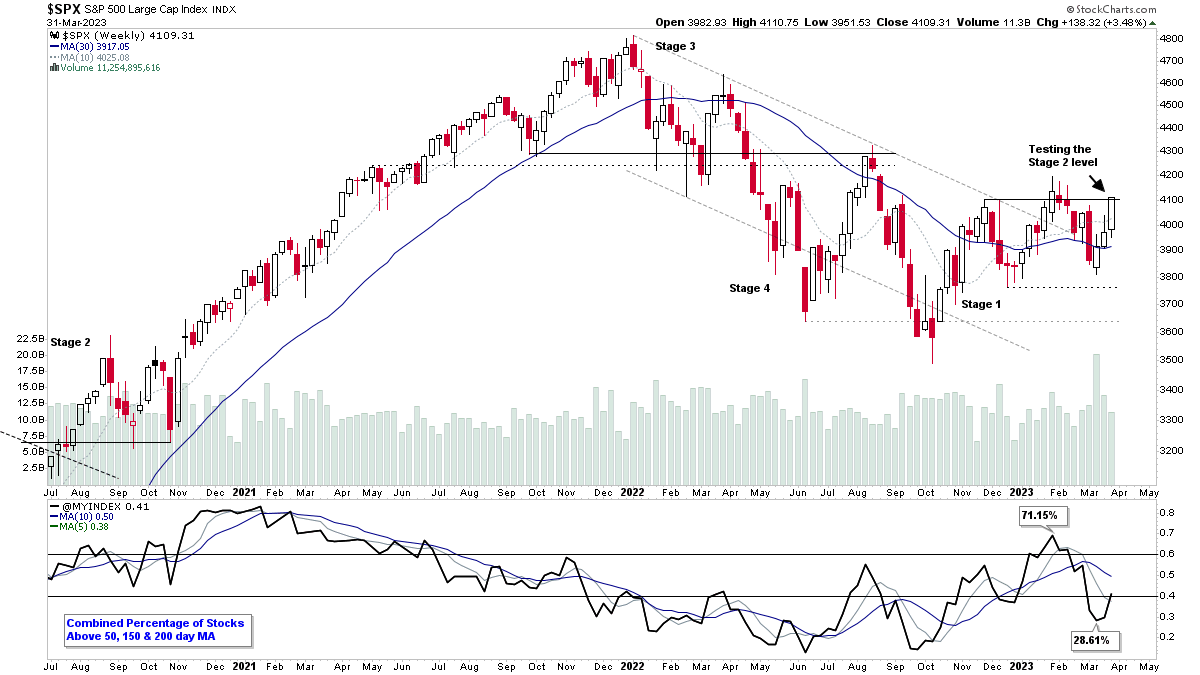
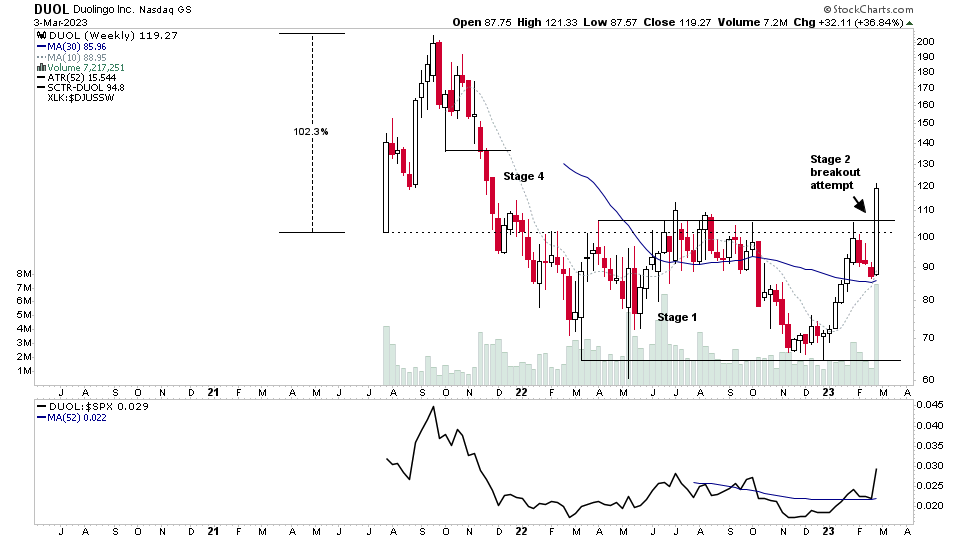
The Stage Analysis members weekend video this week features analysis of the Stage 2 breakout attempt in the Nasdaq 100, and test of the Stage 2 level by the S&P 500. Also discussion of the futures charts, US Stocks Industry Groups RS Rankings...
Read More
29 March, 2023
Stage Analysis Members Video – 29 March 2023 (1hr 4mins)
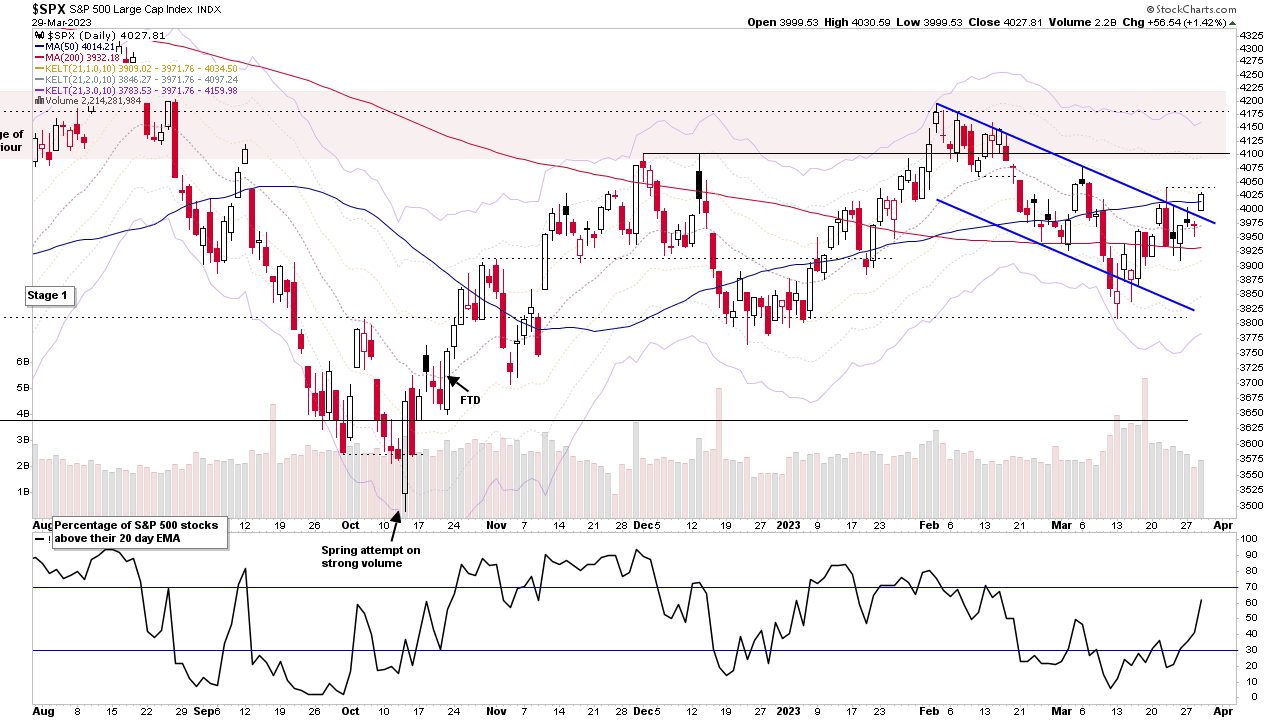
The Stage Analysis members midweek video discussing the improvements in the short-term market breadth indicators, the major market indexes. Stage Analysis of the mega cap stocks, and review of the banks position. Followed by discussion of the recent US watchlist stocks in more detail, and finishing off with a look at Bitcoin and Ethereum.
Read More
26 March, 2023
Stage Analysis Members Video – 26 March 2023 (1hr 20mins)
The Stage Analysis members weekend video with the Major Indexes Update, Futures, Sector Breadth, US Stocks Industry Groups RS Rankings, IBD Industry Groups Bell Curve – Bullish Percent, Market Breadth Update – Weight of Evidence and the US Watchlist Stocks in detail with live markups on multiple timeframes...
Read More
19 March, 2023
Stage Analysis Members Video – 19 March 2023 (1hr 20mins)
This weekends video begins with a detailed discussion of the IBD Industry Groups Bell Curve – Bullish Percent and the Market Breadth Indicators, in order to help to determine the weight of evidence, which is the most crucial aspect of Stan Weinstein's Stage Analysis method. The changes in the US Stocks Industry Groups RS Rankings are then discussed, as well as the Major Indexes Update and Futures, including the S&P 500, Nasdaq 100, Russell 2000, US Dollar Index, Gold etc. Followed by a review of the watchlist stocks from the weekend scans.
Read More
16 March, 2023
Stage Analysis Technical Attributes Scores – Nasdaq 100
The Stage Analysis Technical Attributes (SATA) score is our proprietary indicator that helps to identify the four stages from Stan Weinstein's Stage Analysis method, using a scoring system from 0 to 10 that rates ten of the key technical characteristics that we look for when analysing the weekly charts.
Read More
12 March, 2023
Stage Analysis Members Video – 12 March 2023 (1hr 29mins)
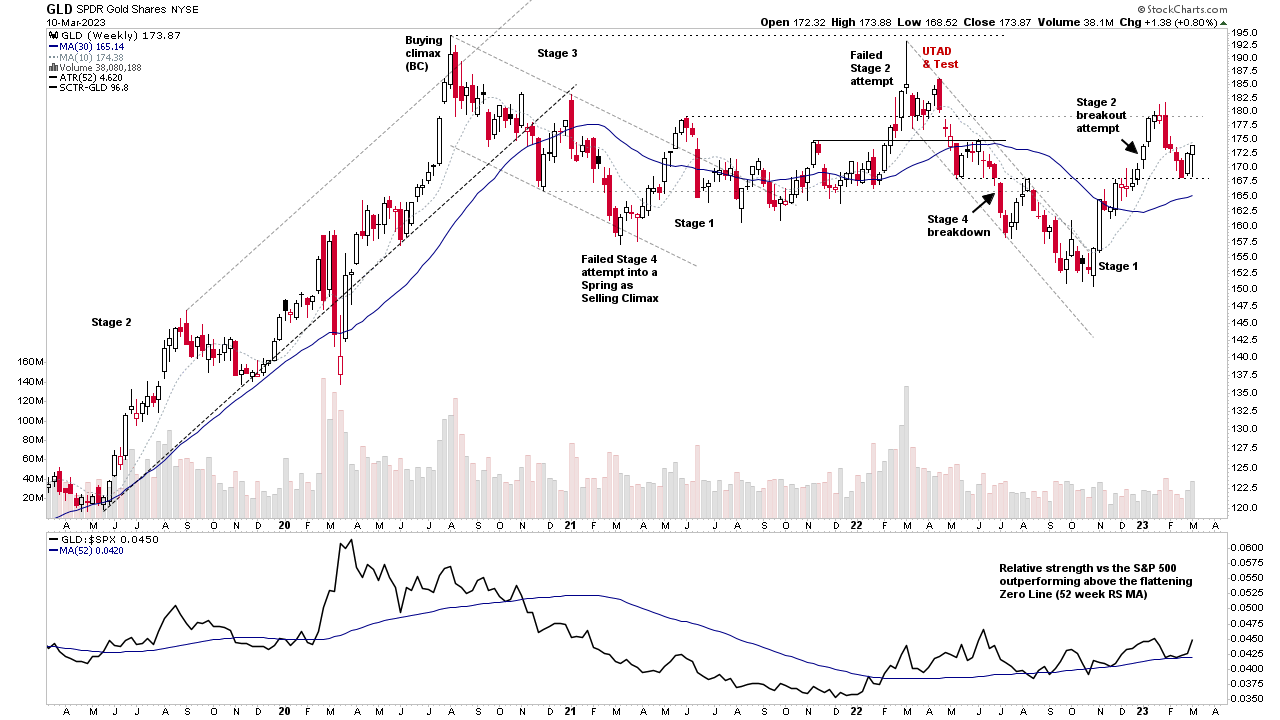
The Stage Analysis members weekend video this week begins with a discussion on Gold as it attempts to rebound around its prior Stage 2 breakout level in the turn with the US Dollar Index attempting to rollover at its Stage 4 breakdown level. Then a discussion of the Stage 4 breakdowns in the Bank indexes and different ETFs that cover them. Before the more regular weekly content of the Major Indexes Update, Futures and US Treasuries, IBD Industry Groups Bell Curve – Bullish Percent, US Stocks Industry Groups RS Rankings, Market Breadth Update – Weight of Evidence and some of the weeks Stage 2 Breakout attempts against the overall market action.
Read More
05 March, 2023
Stage Analysis Members Video – 5 March 2023 (1hr 4mins)
The Stage Analysis members weekend video with the major US Indexes, futures charts, US Industry Groups RS Rankings, the Market Breadth Update to help to determine the Weight of Evidence and discussion of some the recent breakouts and stocks in Stage 2.
Read More
26 February, 2023
Stage Analysis Members Video – 26 February 2023 (1hr 22mins)
The Stage Analysis members weekend video featuring early Stage 2 and developing Stage 1 stocks, watchlist stocks in focus with upcoming earnings in the coming week. Plus the regular content with the major US Indexes, the futures charts, US Industry Groups RS Rankings, IBD Industry Groups Bell Curve - Bullish Percent, the Market Breadth Update to help to determine the Weight of Evidence.
Read More