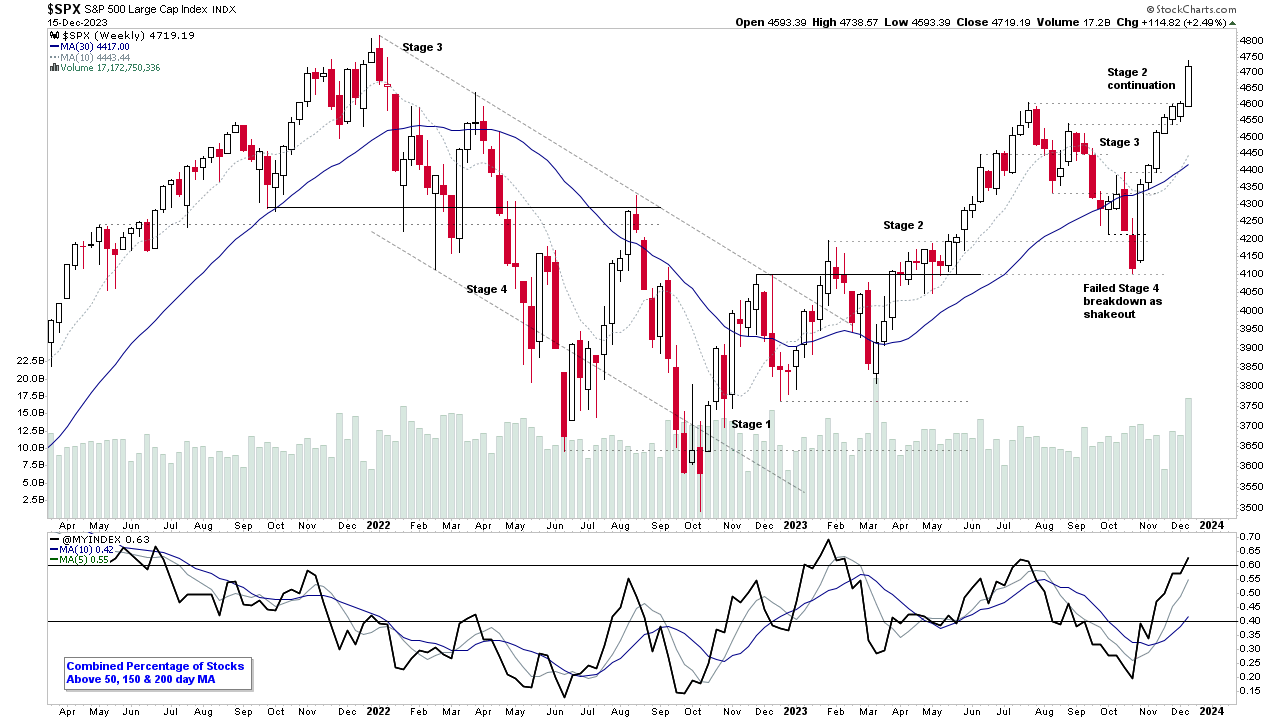
Stage Analysis members weekend video discussing the Major US Stock Market Indexes, Futures charts, Industry Groups Relative Strength (RS) Rankings, IBD Industry Group Bell Curve – Bullish Percent, the key Market Breadth Charts to determine the Weight of Evidence, Group Focus on the Gold and Silver Miners, Significant Weekly Bars, and the US watchlist stocks in detail on multiple timeframes.
Read More

Blog
17 December, 2023
Stage Analysis Members Video – 17 December 2023 (1hr 24mins)
13 December, 2023
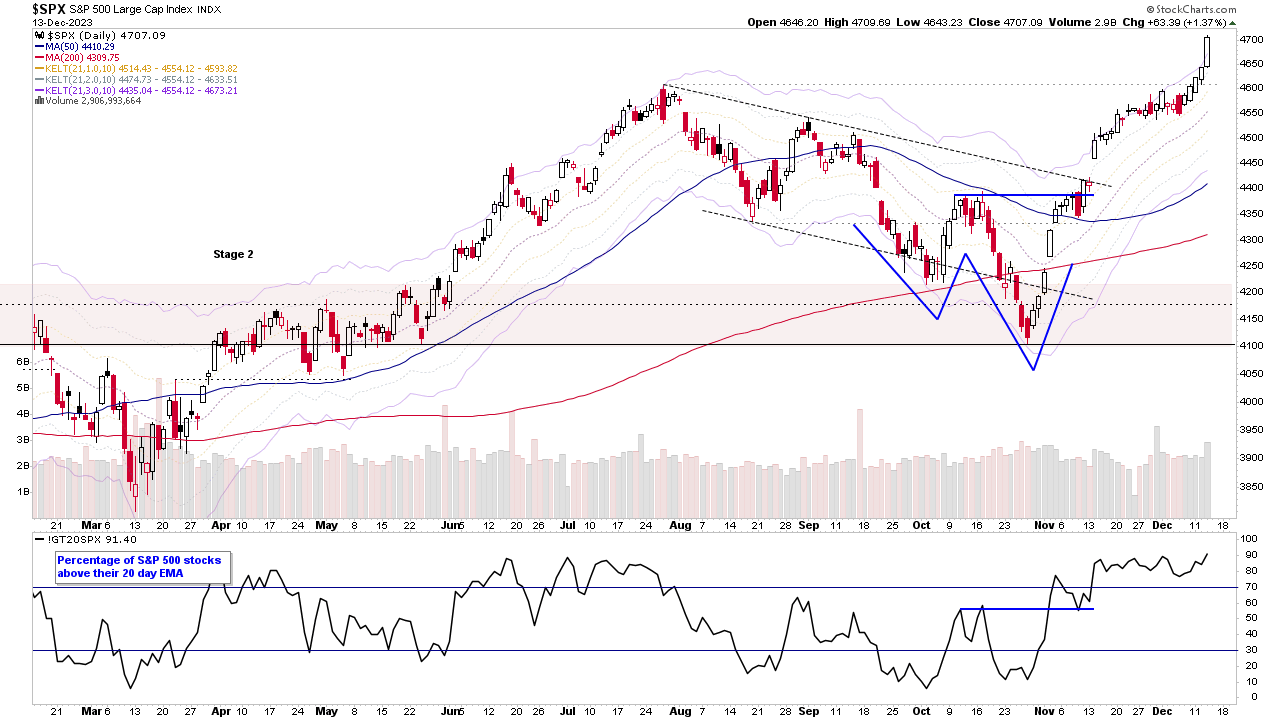
Stage Analysis Members Video – 13 December 2023 (42mins)
Stage Analysis midweek video discussing of the major US stock market indexes following todays Fed rate decision, short-term market breadth measures, and the recent watchlist stocks on multiple timeframes.
Read More
10 December, 2023
Stage Analysis Members Video – 10 December 2023 (1hr 8mins)
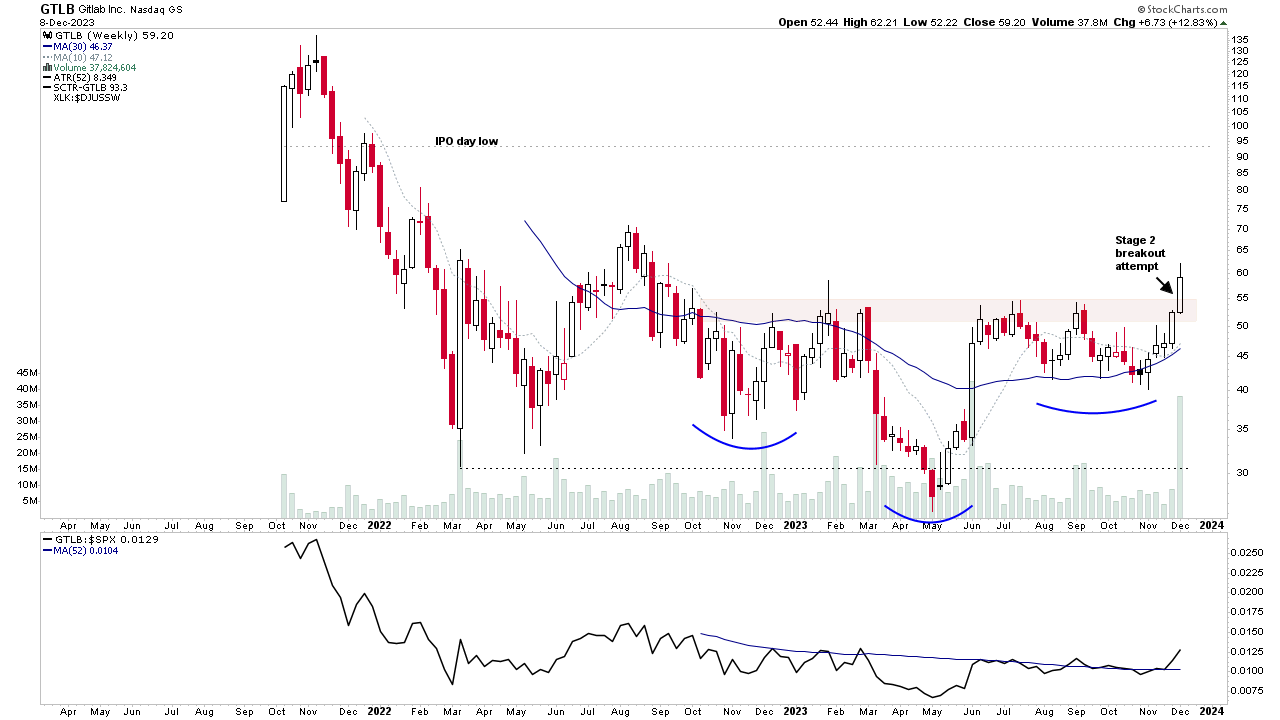
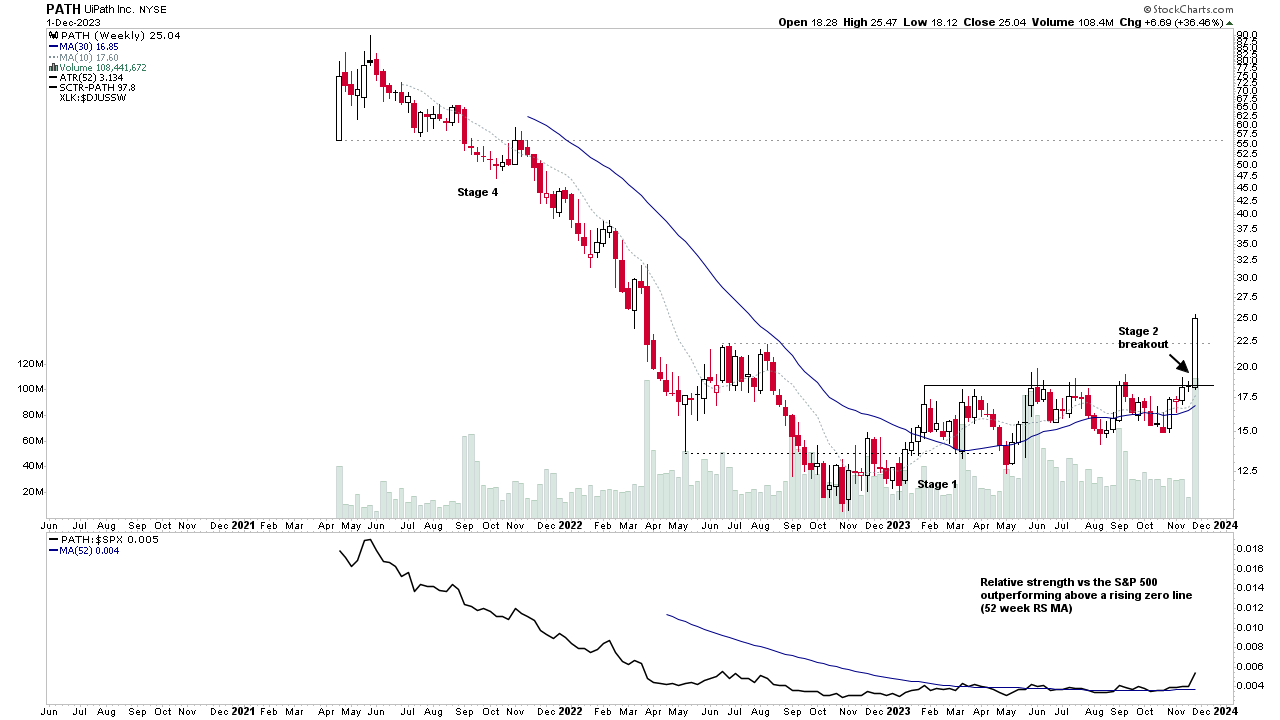
Stage Analysis members weekend video starting this with a look at some of the significant weekly bars of stocks in Stage 2, followed by the regular members content on the Major US Stock Market Indexes, Industry Groups Relative Strength (RS) Rankings, IBD Industry Group Bell Curve – Bullish Percent, the key Market Breadth Charts to determine the Weight of Evidence, Bitcoin & Ethereum Update, and the US watchlist stocks in detail on multiple timeframes.
Read More
03 December, 2023
Stage Analysis Members Video – 3 December 2023 (1hr 18mins)
Stage Analysis members weekend video beginning with a discussion of some of strongest moving stocks in Stage 2, followed by the regular members content on the Major US Stock Market Indexes, Industry Groups Relative Strength (RS) Rankings, IBD Industry Group Bell Curve – Bullish Percent, the key Market Breadth Charts to determine the Weight of Evidence, Bitcoin & Ethereum Update, and the US watchlist stocks in detail on multiple timeframes.
Read More
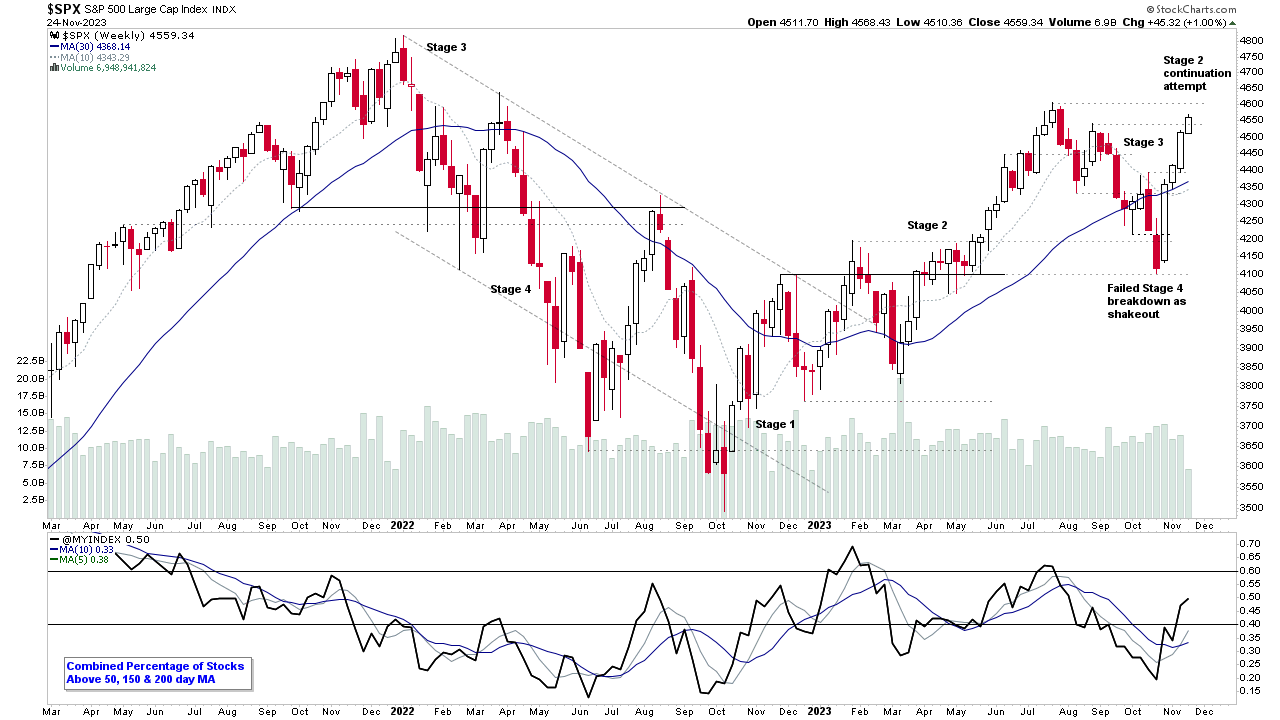
26 November, 2023
Stage Analysis Members Video – 26 November 2023 (1hr 19mins)
Stage Analysis members weekend video discussing the Major US Stock Market Indexes, Industry Groups Relative Strength (RS) Rankings, IBD Industry Group Bell Curve – Bullish Percent, the key Market Breadth Charts to determine the Weight of Evidence, Significant Weekly Bars and the US watchlist stocks in detail on multiple timeframes.
Read More
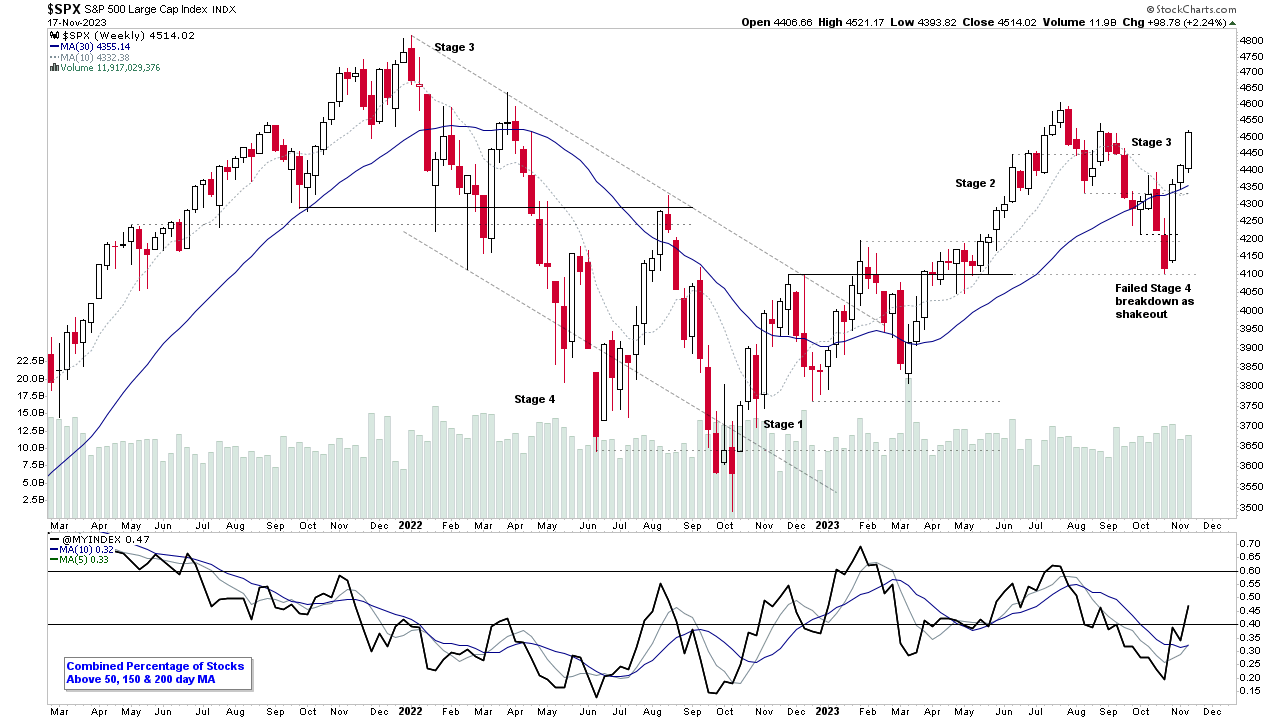
19 November, 2023
Stage Analysis Members Video – 19 November 2023 (1hr 15mins)
Stage Analysis members weekend video discussing the Major US Stock Market Indexes, Futures Charts, Industry Groups Relative Strength (RS) Rankings, IBD Industry Group Bell Curve – Bullish Percent, and the US watchlist stocks in detail on multiple timeframes.
Read More
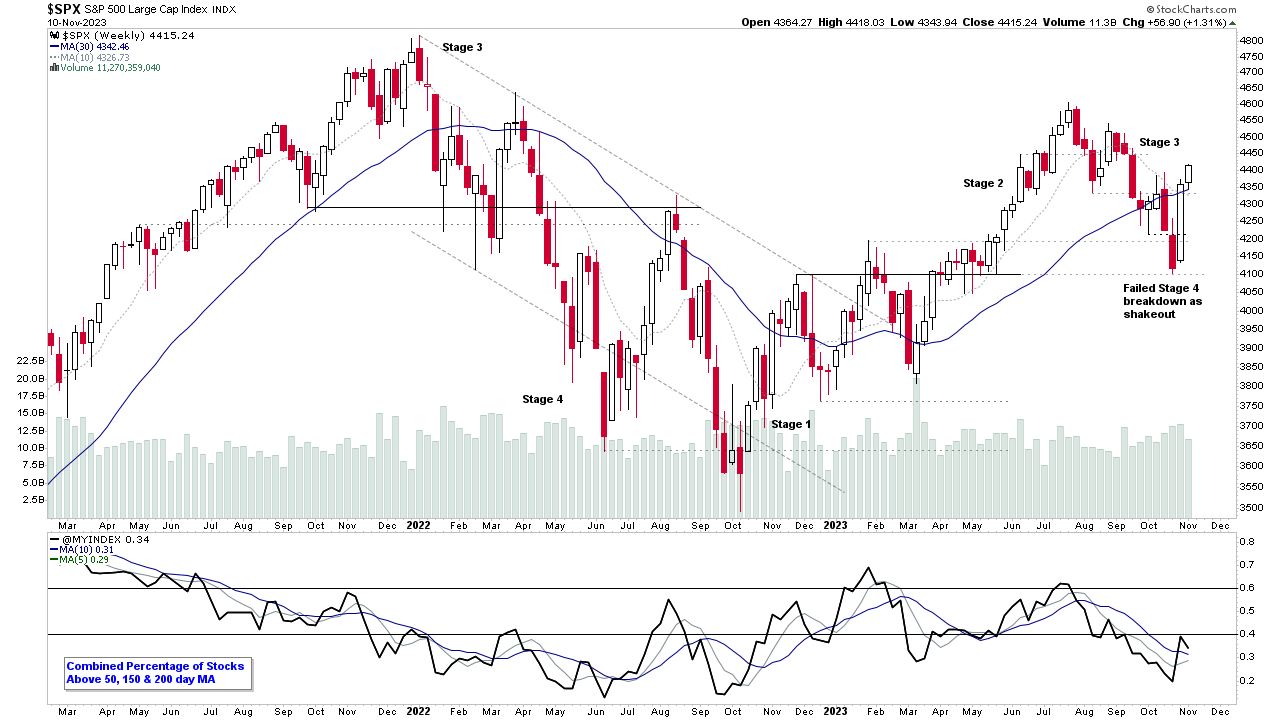
12 November, 2023
Stage Analysis Members Video – 12 November 2023 (1hr 11mins)
Stage Analysis members weekend video covering the Major US Indexes, Futures Charts, Industry Groups Relative Strength (RS) Rankings, IBD Industry Group Bell Curve – Bullish Percent, Significant Weekly Bars, Crypto Coins update and the US watchlist stocks in detail on multiple timeframes.
Read More
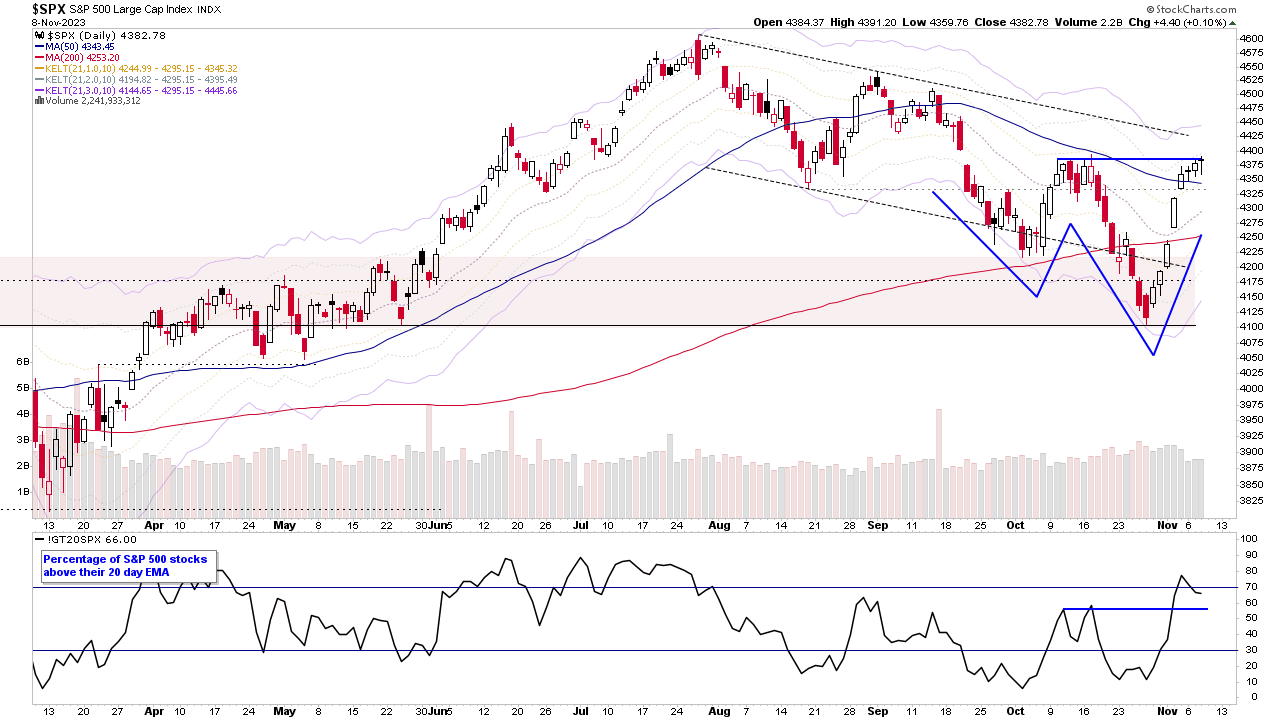
08 November, 2023
Stage Analysis Members Video – 8 November 2023 (56mins)
The Stage Analysis midweek video discussing of the major US stock market indexes, short-term market breadth measures, Bitcoin and Ethereum updated analysis, and the recent watchlist stocks on multiple timeframes.
Read More
05 November, 2023
Stage Analysis Members Video – 5 November 2023 (1hr 33mins)
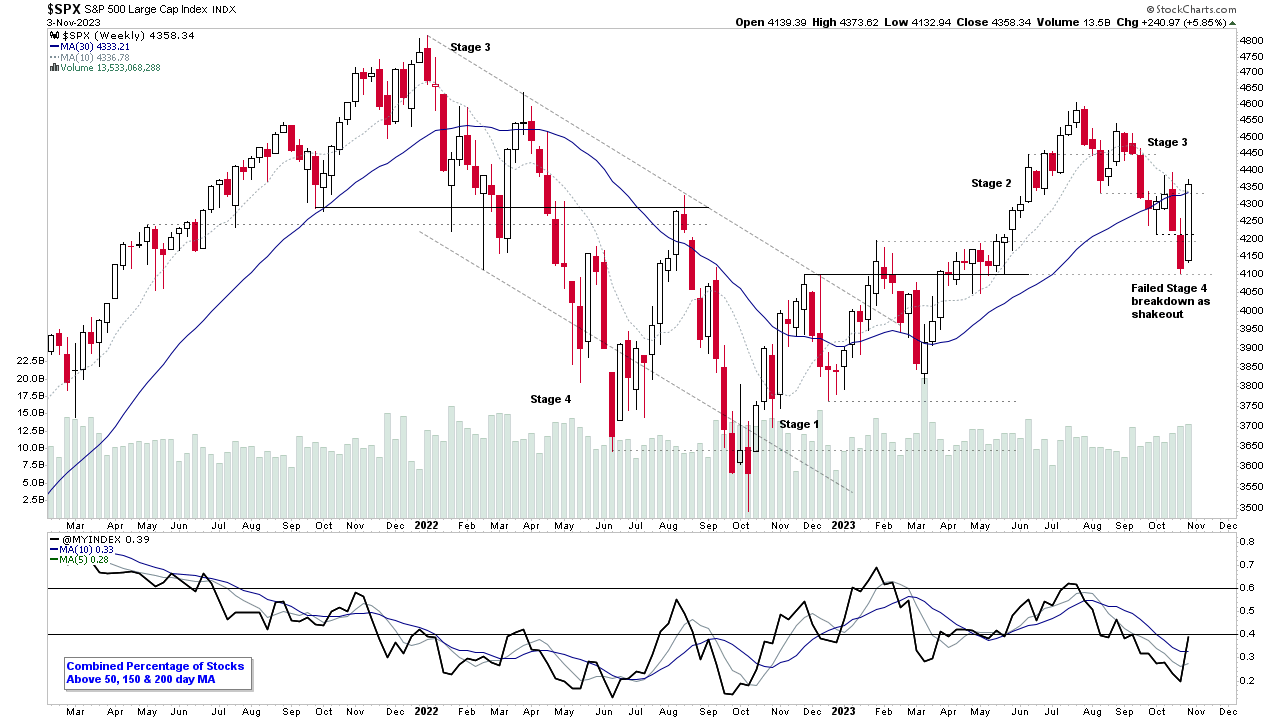
The Stage Analysis members weekend video begins with a look at some of the weeks significant bars in individual stocks, after a huge change of behaviour in the broad market. Followed by the regular weekend content of the Major US Indexes, the Futures Charts, Industry Groups Relative Strength (RS) Rankings, IBD Industry Group Bell Curve – Bullish Percent, and US watchlist stocks in detail on multiple timeframes.
Read More
01 November, 2023
Stage Analysis Members Video – 1 November 2023 (49mins)
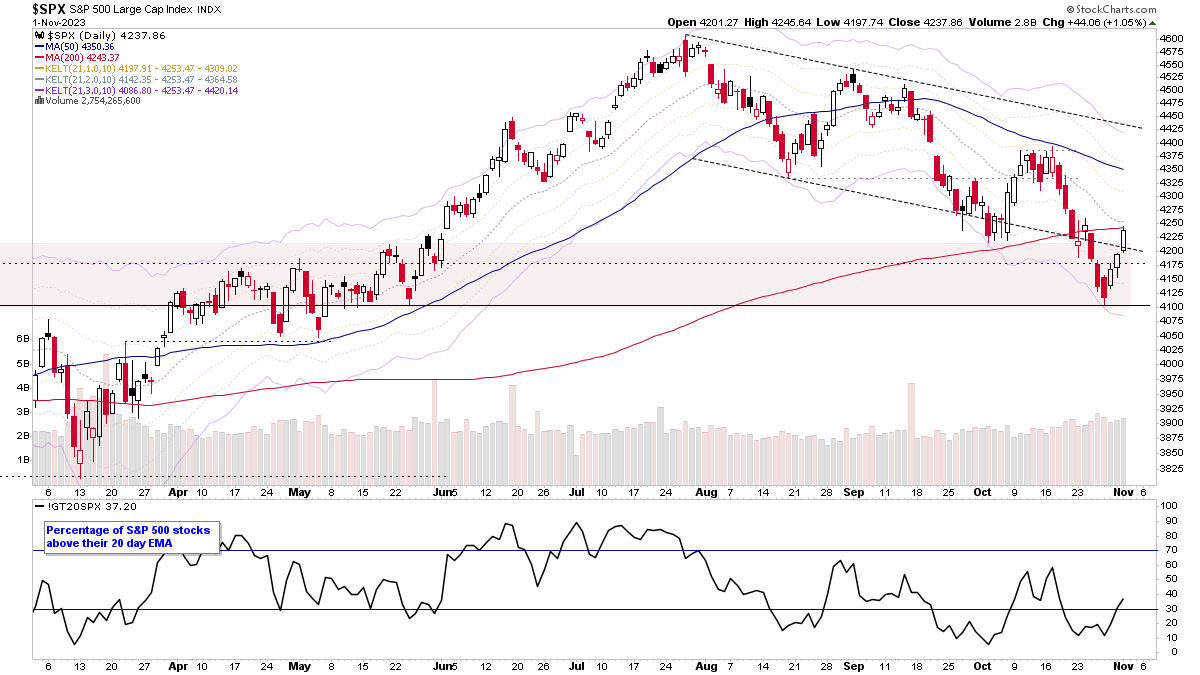
Stage Analysis midweek video discussing of the major US stock market indexes, short-term market breadth measures and the recent watchlist stocks on multiple timeframes.
Read More