
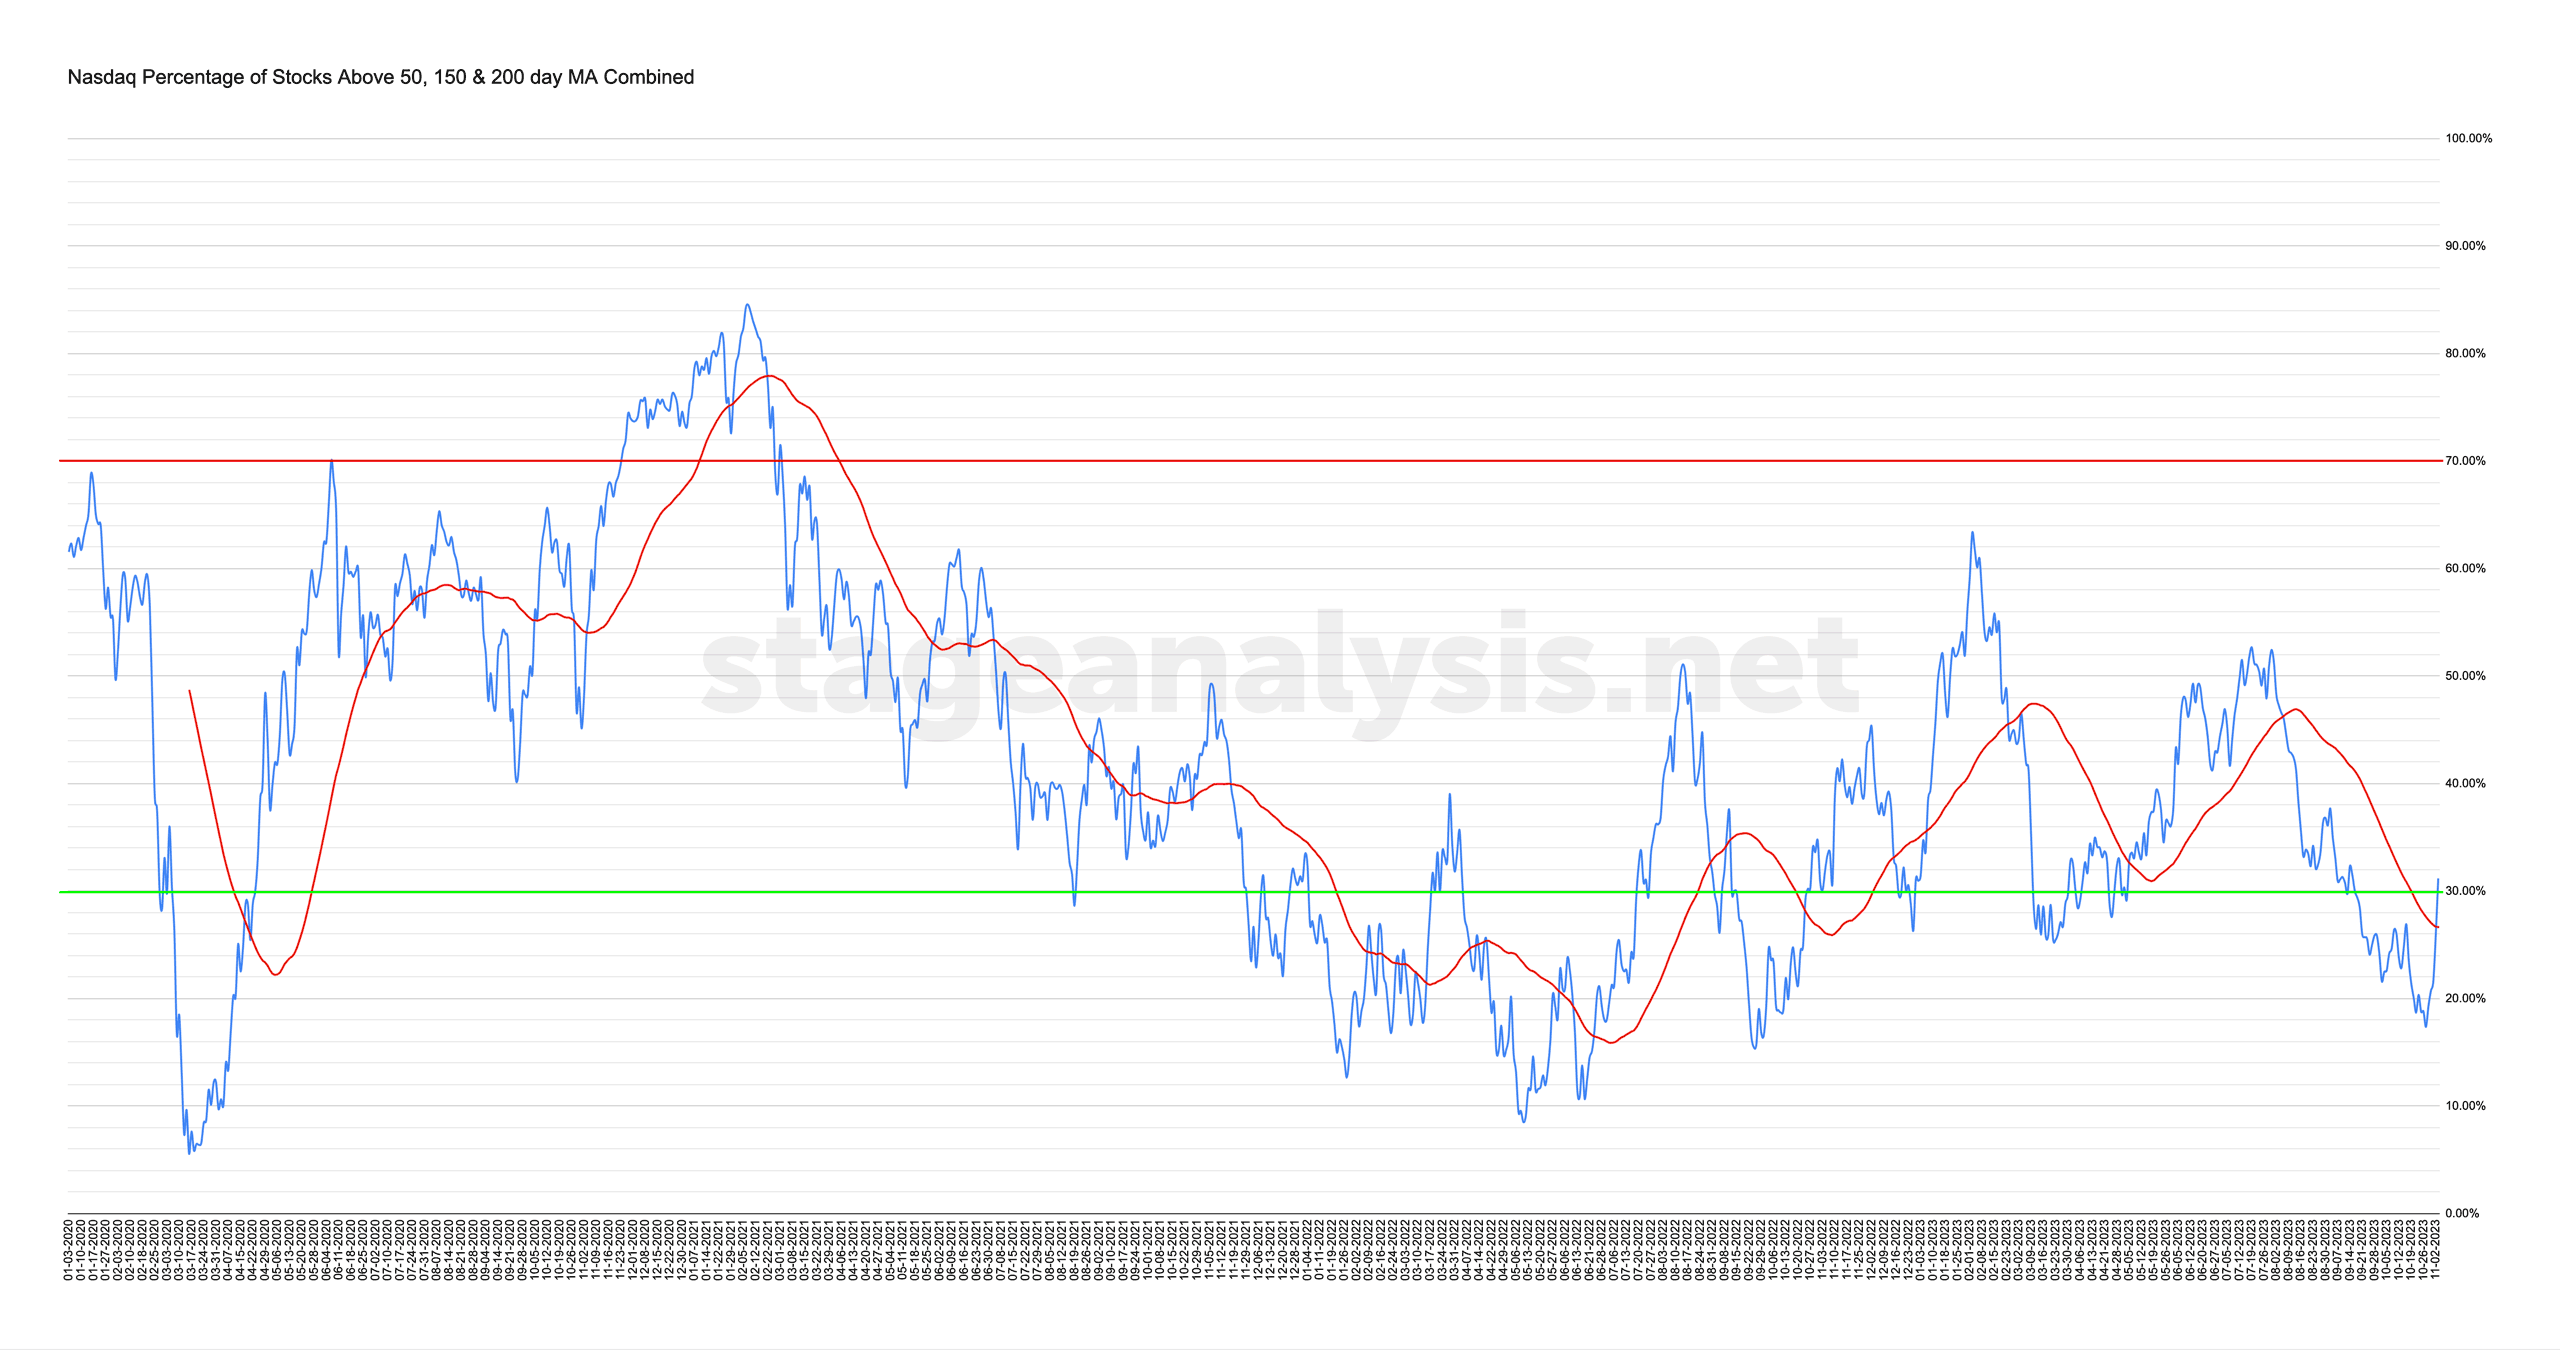
Market Breadth: Percentage of Stocks Above their 50 Day, 150 Day & 200 Day Moving Averages Combined
39.14% (+19.43% 1wk)
Status: Tentative Positive Environment
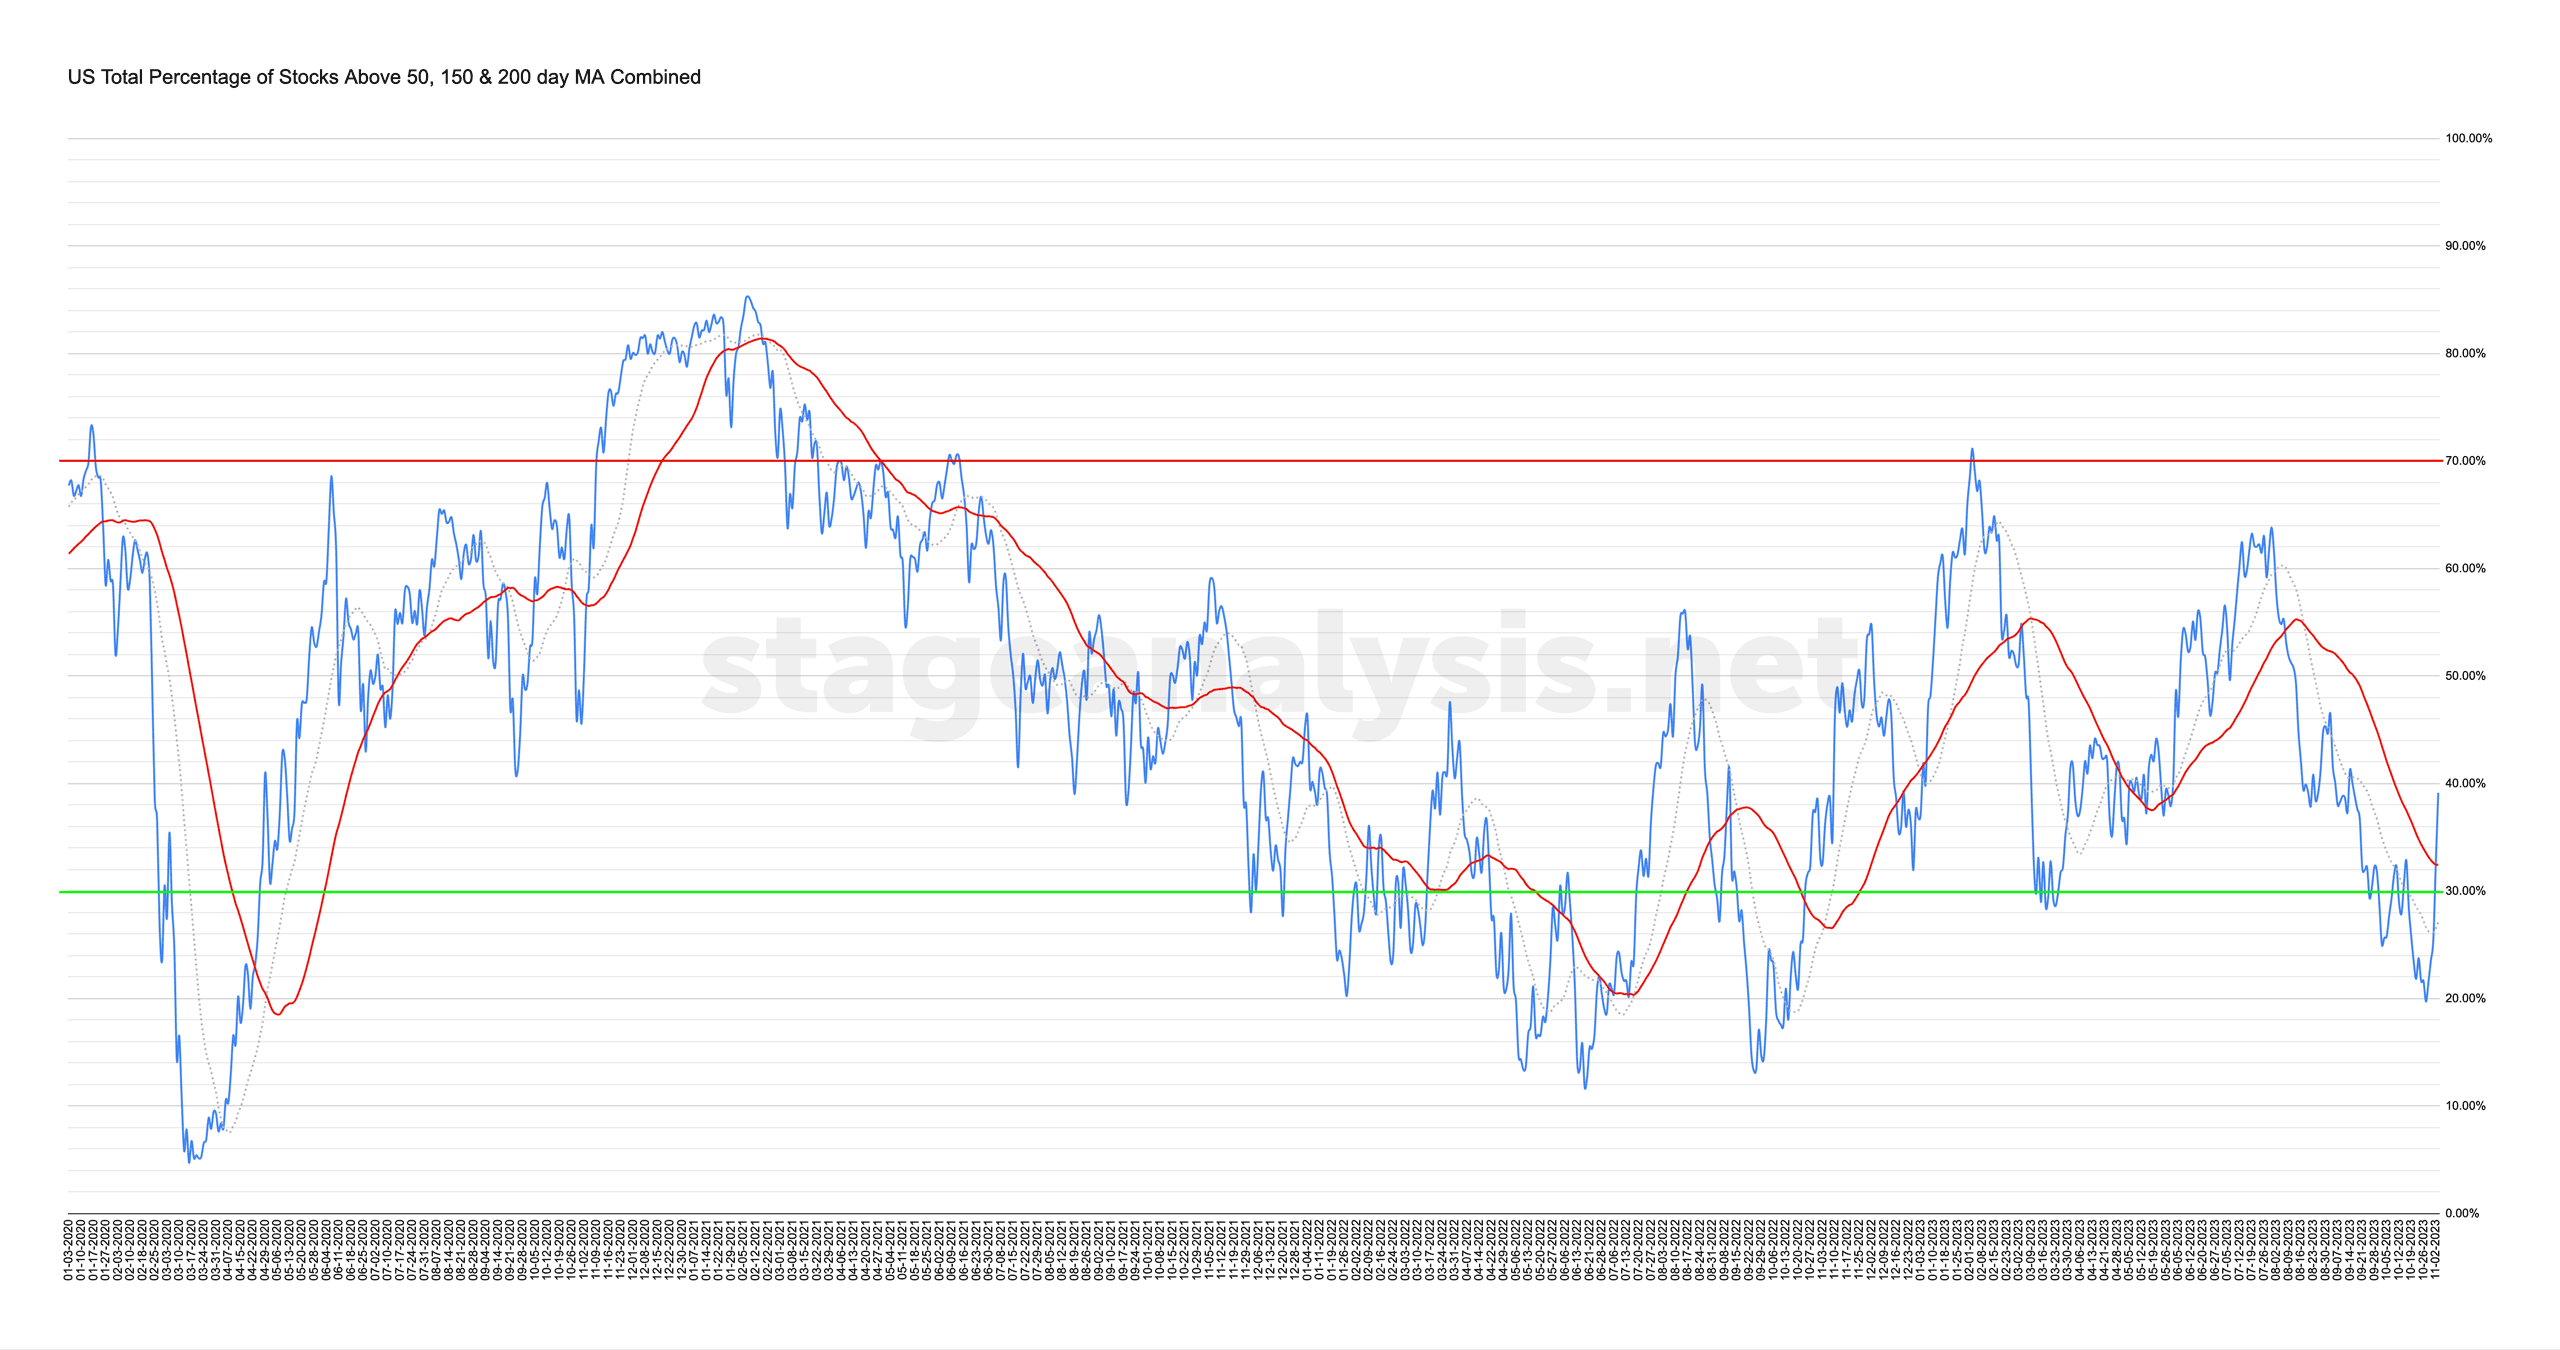
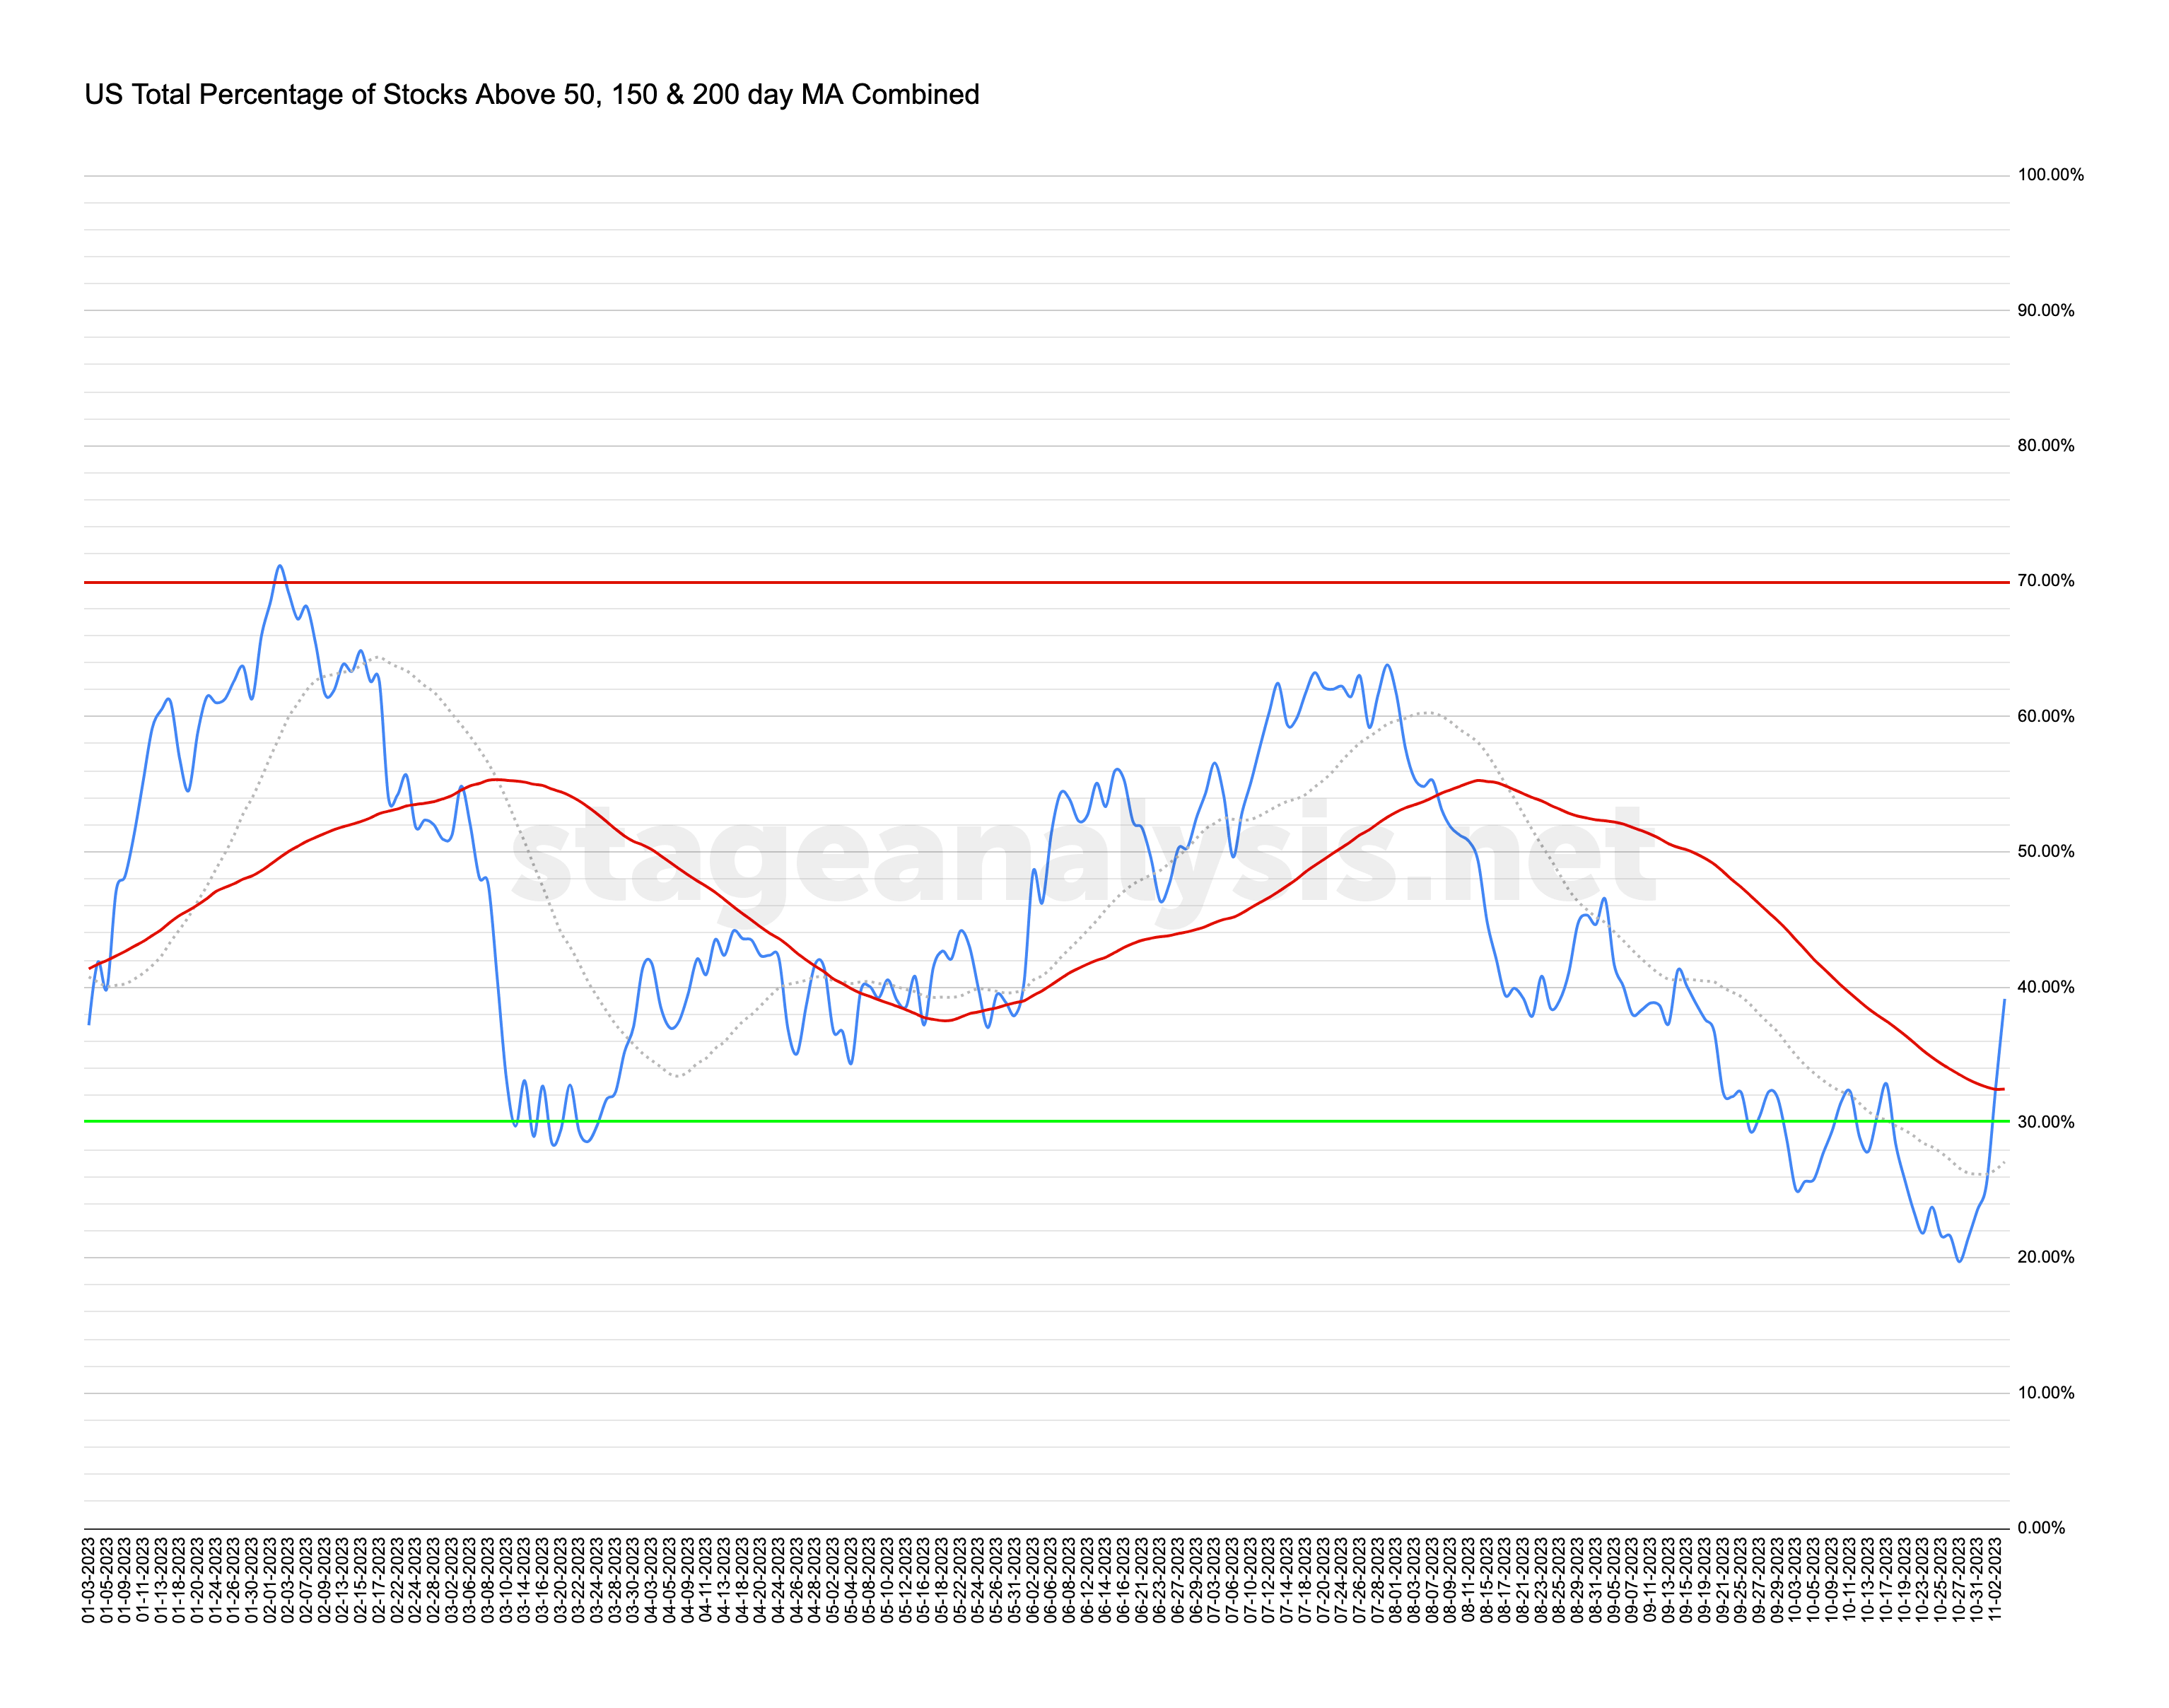
The US Total Percentage of Stocks above their 50 Day, 150 Day & 200 Day Moving Averages (shown above) increased by +19.43% this week.
Therefore, the overall combined average is at 39.14% in the US market (NYSE and Nasdaq markets combined) above their short, medium and long term moving averages.
All change this week for the combined average with a huge +19.43% gain since last week, which is the largest weekly change of this decade (2020s) so far. As a huge amount of stocks regained their short, medium and longer-term moving averages, after reaching close to their lower extremes.
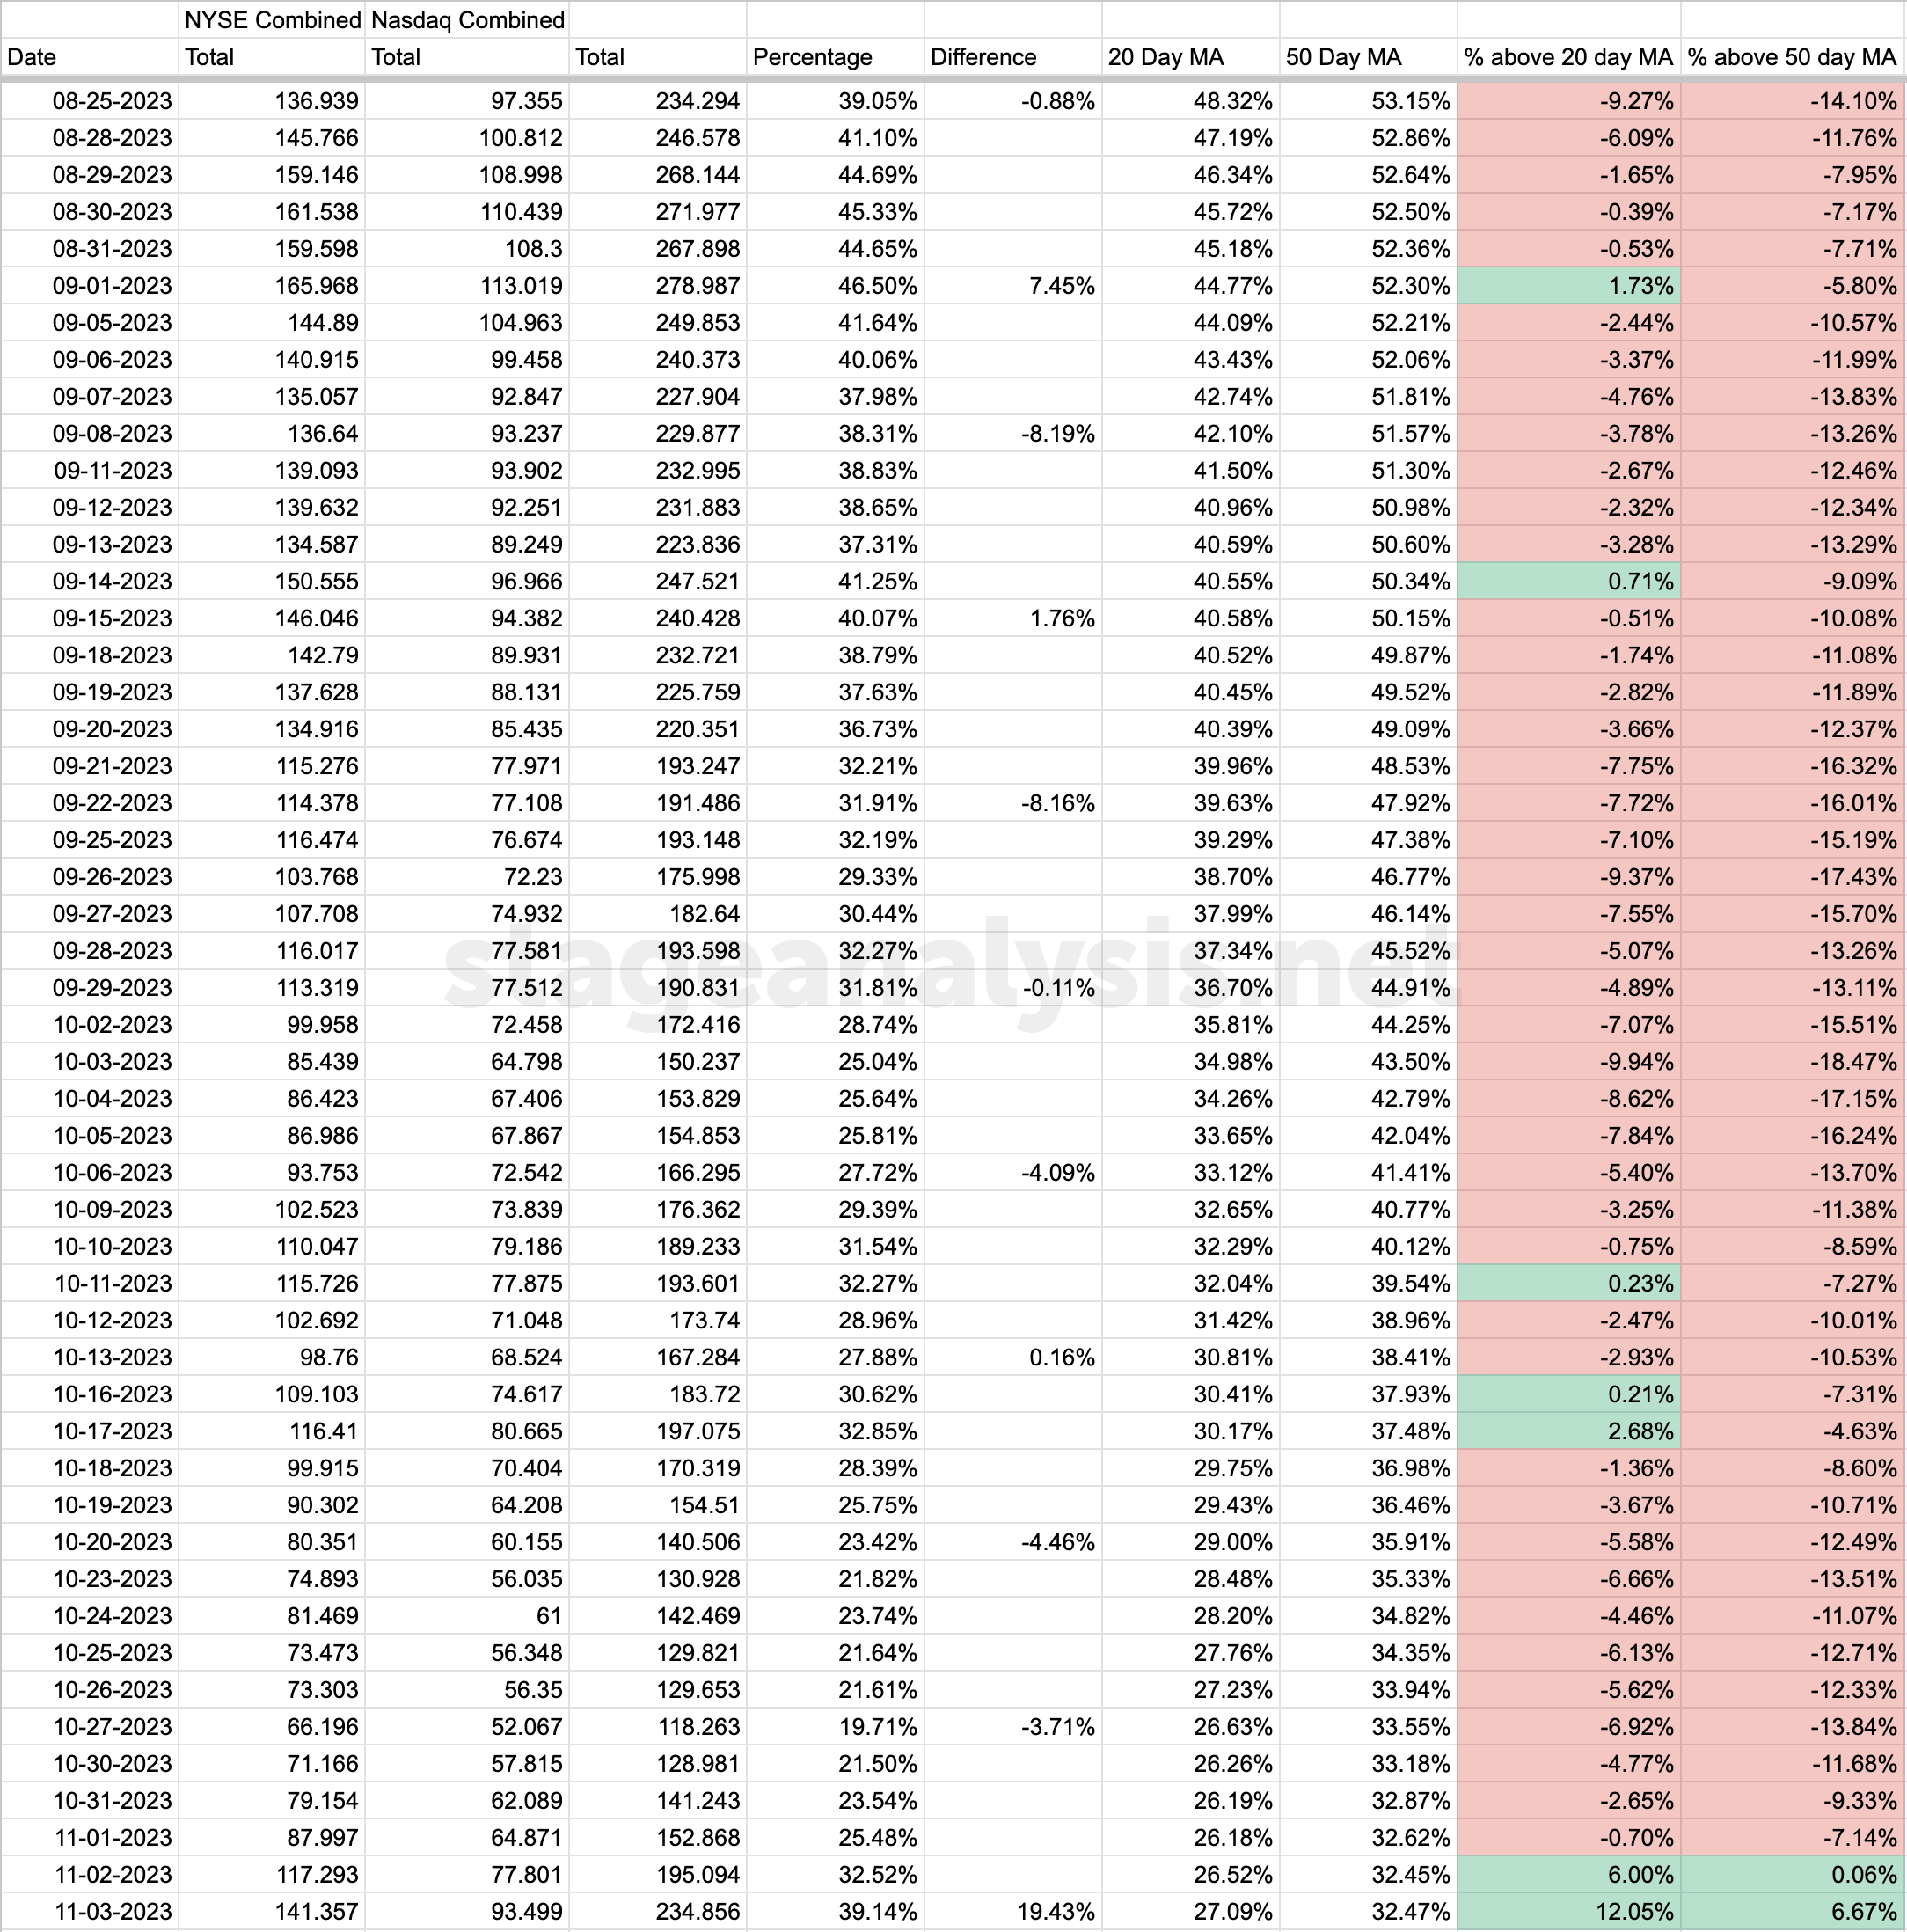
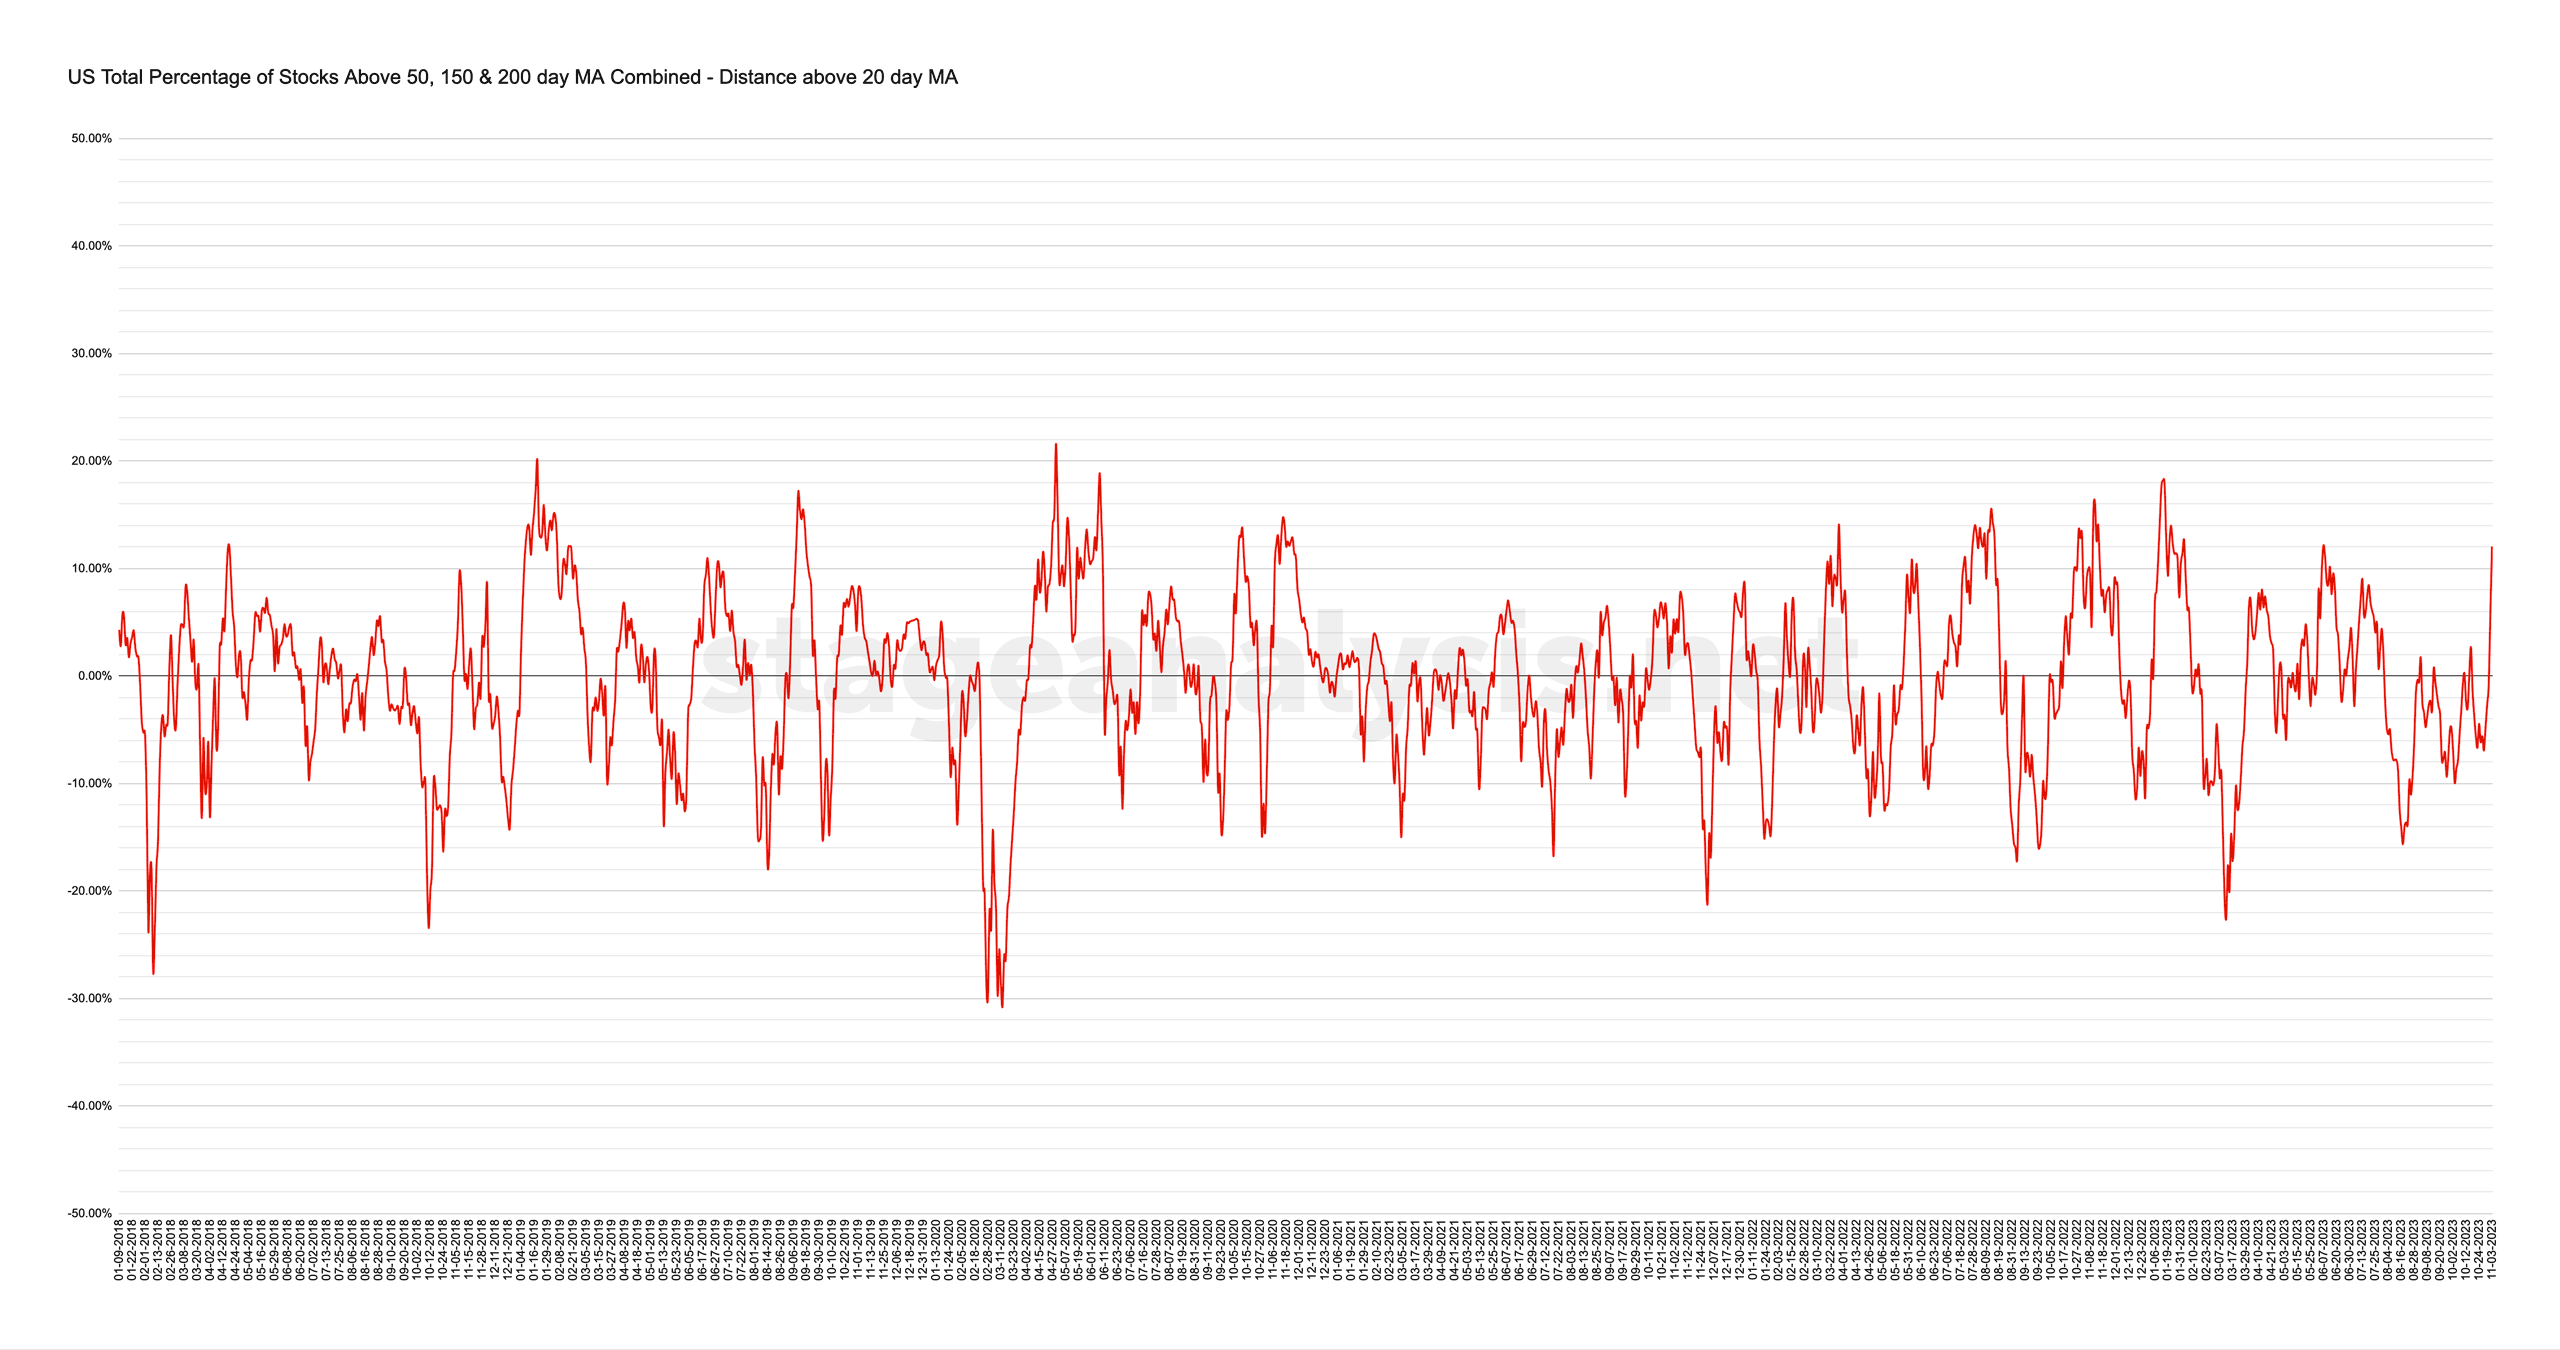
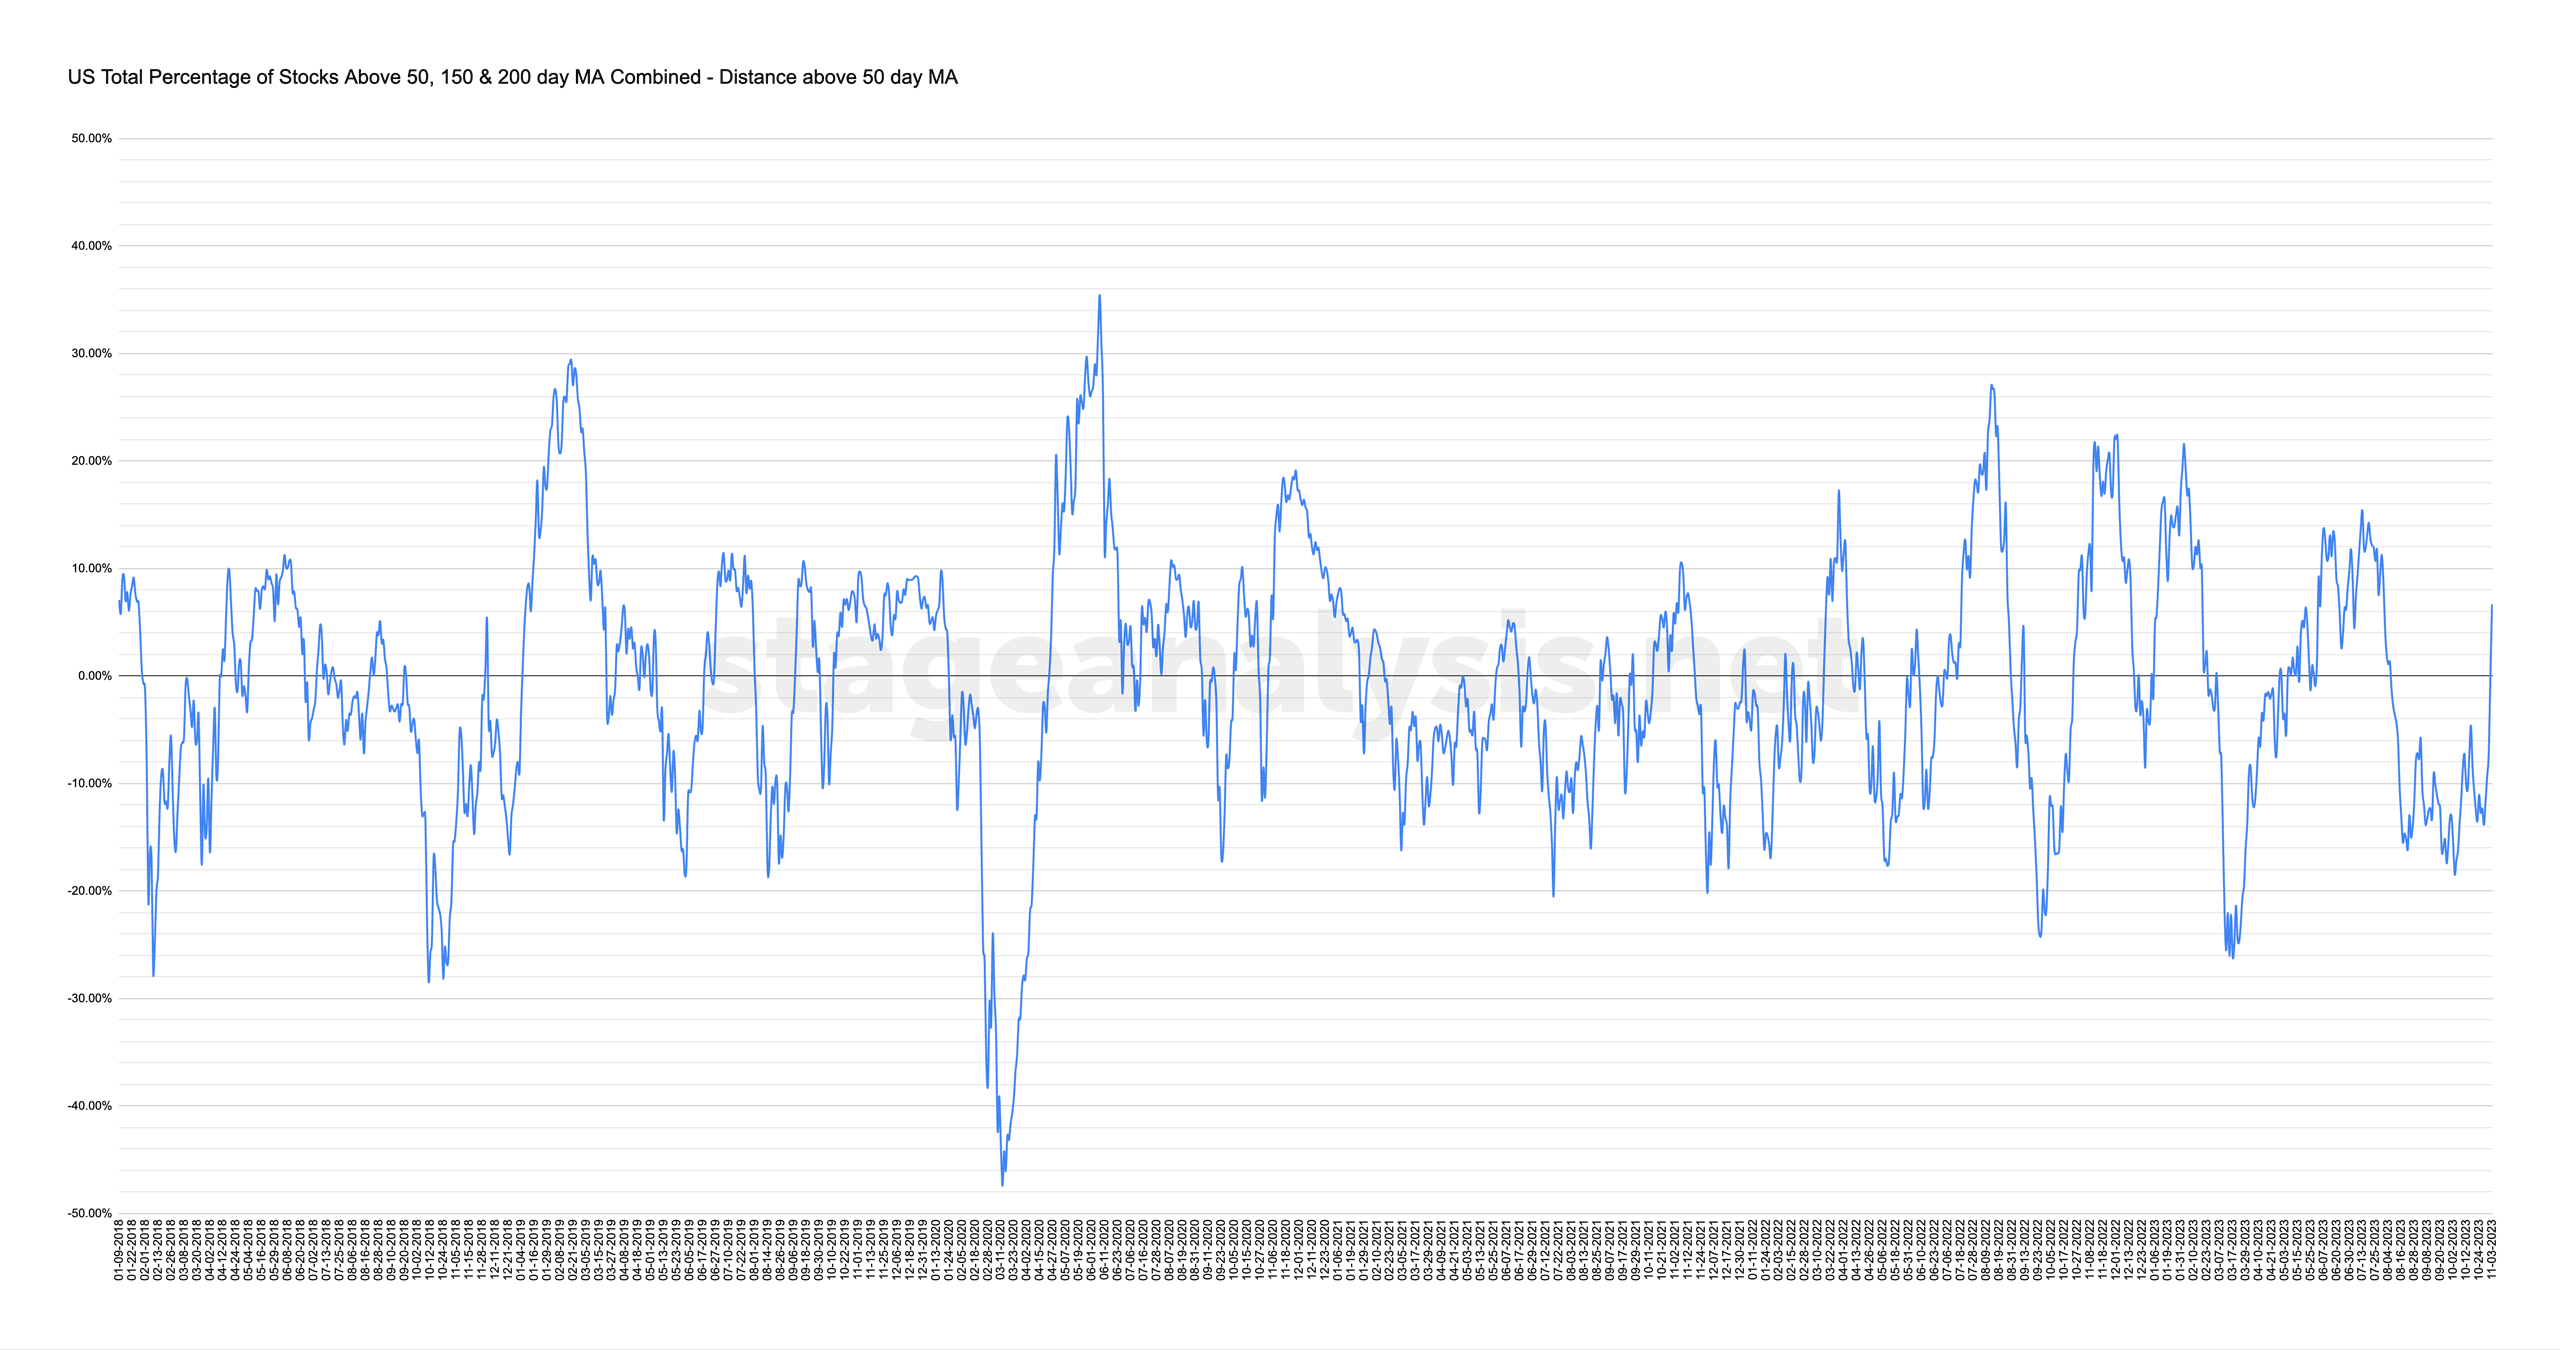
The combined average ended the week +12.05% above its 20 day MA and +6.67% above its 50 day MA (signal line), which with the strong crossover above both MAs changes the status to a Tentative Positive Environment, and I include the word Tentative, as although it's moved strongly above both of the moving averages on Friday, it's still only a few days since the status change, and so it's a provisional status until we see further confirmation.
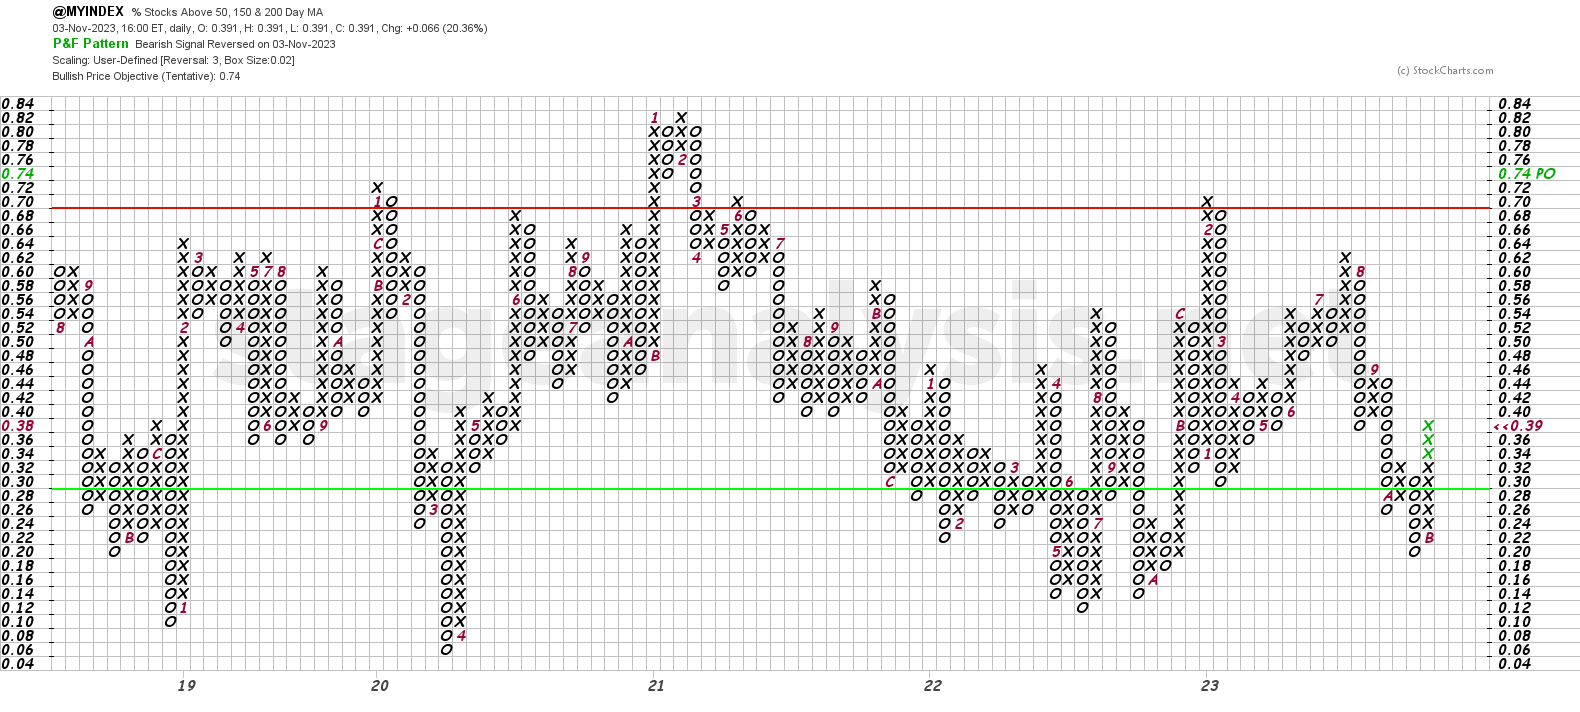
The Point and Figure (P&F) chart (shown above) reversed to a column of Xs this week, adding a massive 9 Xs by Fridays close.
So the P&F strategy changes to Offense (as it is in a column of Xs), and the P&F status has moved to Bull Confirmed status, with the double top breakout on Friday.
Therefore, we have possession of the ball, and our offensive team has moved back out onto the field. So it's our job to try is to score against the market while conditions are more favourable.
See the Bullish Percent article for more information on the P&F statuses.
Status on Tentative Positive Environment with P&F column in Xs in the lower-middle zone.
- Offensive posture
- Point & Figure Bull Confirmed Status
- ETFs can be a lower-risk way to get exposure to certain groups, sectors or indexes if setups in individual stocks are lacking, and a way to increase exposure more quickly if market conditions improve, or as a way to hedge and to short via inverse funds.
- Progressive Exposure – if testing the market on the long side. But only increasing exposure if account progress is made. i.e. no need to get more invested unless positive account progress is giving you a reason to increase your exposure.
- Quarterly Earnings Season continues, so watch for Earnings Gap Significant Bars on exceptional volume
- Focus on stocks with strong technical attributes (i.e. looking for A+ characteristics when analysing base structures / potential setups)
- Focus on strong and strengthening Relative Strength Industry Groups.
- Looking for constructive pullbacks (lower volume, tighter spread than on the rally), consolidation, Volatility Contraction Patterns (VCP), Springs, and tight price action on low volume.
- Stage 2 Breakouts and Continuation Breakouts with higher quality technical attributes.
- Some bottom fishing in select Stage 4B- stocks showing a strong change of behaviour (Swing Traders)
- Watch for signs of developing relative strength (i.e. groups moving strongly up the RS rankings table and appearing in the watchlist group themes).
- Focus on risk management
- Overall strategy (based only this breadth data) saw a complete reversal this week to an offensive posture and Bull Confirmed status, with the P&F chart in a column of Xs, and the line chart back above its moving averages and changing to a tentative Positive Environment status. With such a big move though, stocks have quickly become extended in the short-term, and so probabilities of consolidation, or a test of this weeks move seem high. However, with such a powerful breadth thrust, there's also an outside chance of a lockout rally, which then makes it hard for people to get in. i.e. supply quickly being absorbed on pullback attempts. As false moves can lead to fast moves. So stay nimble.
- Remember, always manage risk first.
*Not a recommendation to buy or sell securities. Information is for educational purposes only. See full terms and conditions.
20 and 50-day Oscillator
These show the distance that the combined chart is from the 20-day MA and 50-day MA on the chart. Above zero is a positive environment and below is a difficult/negative environment.
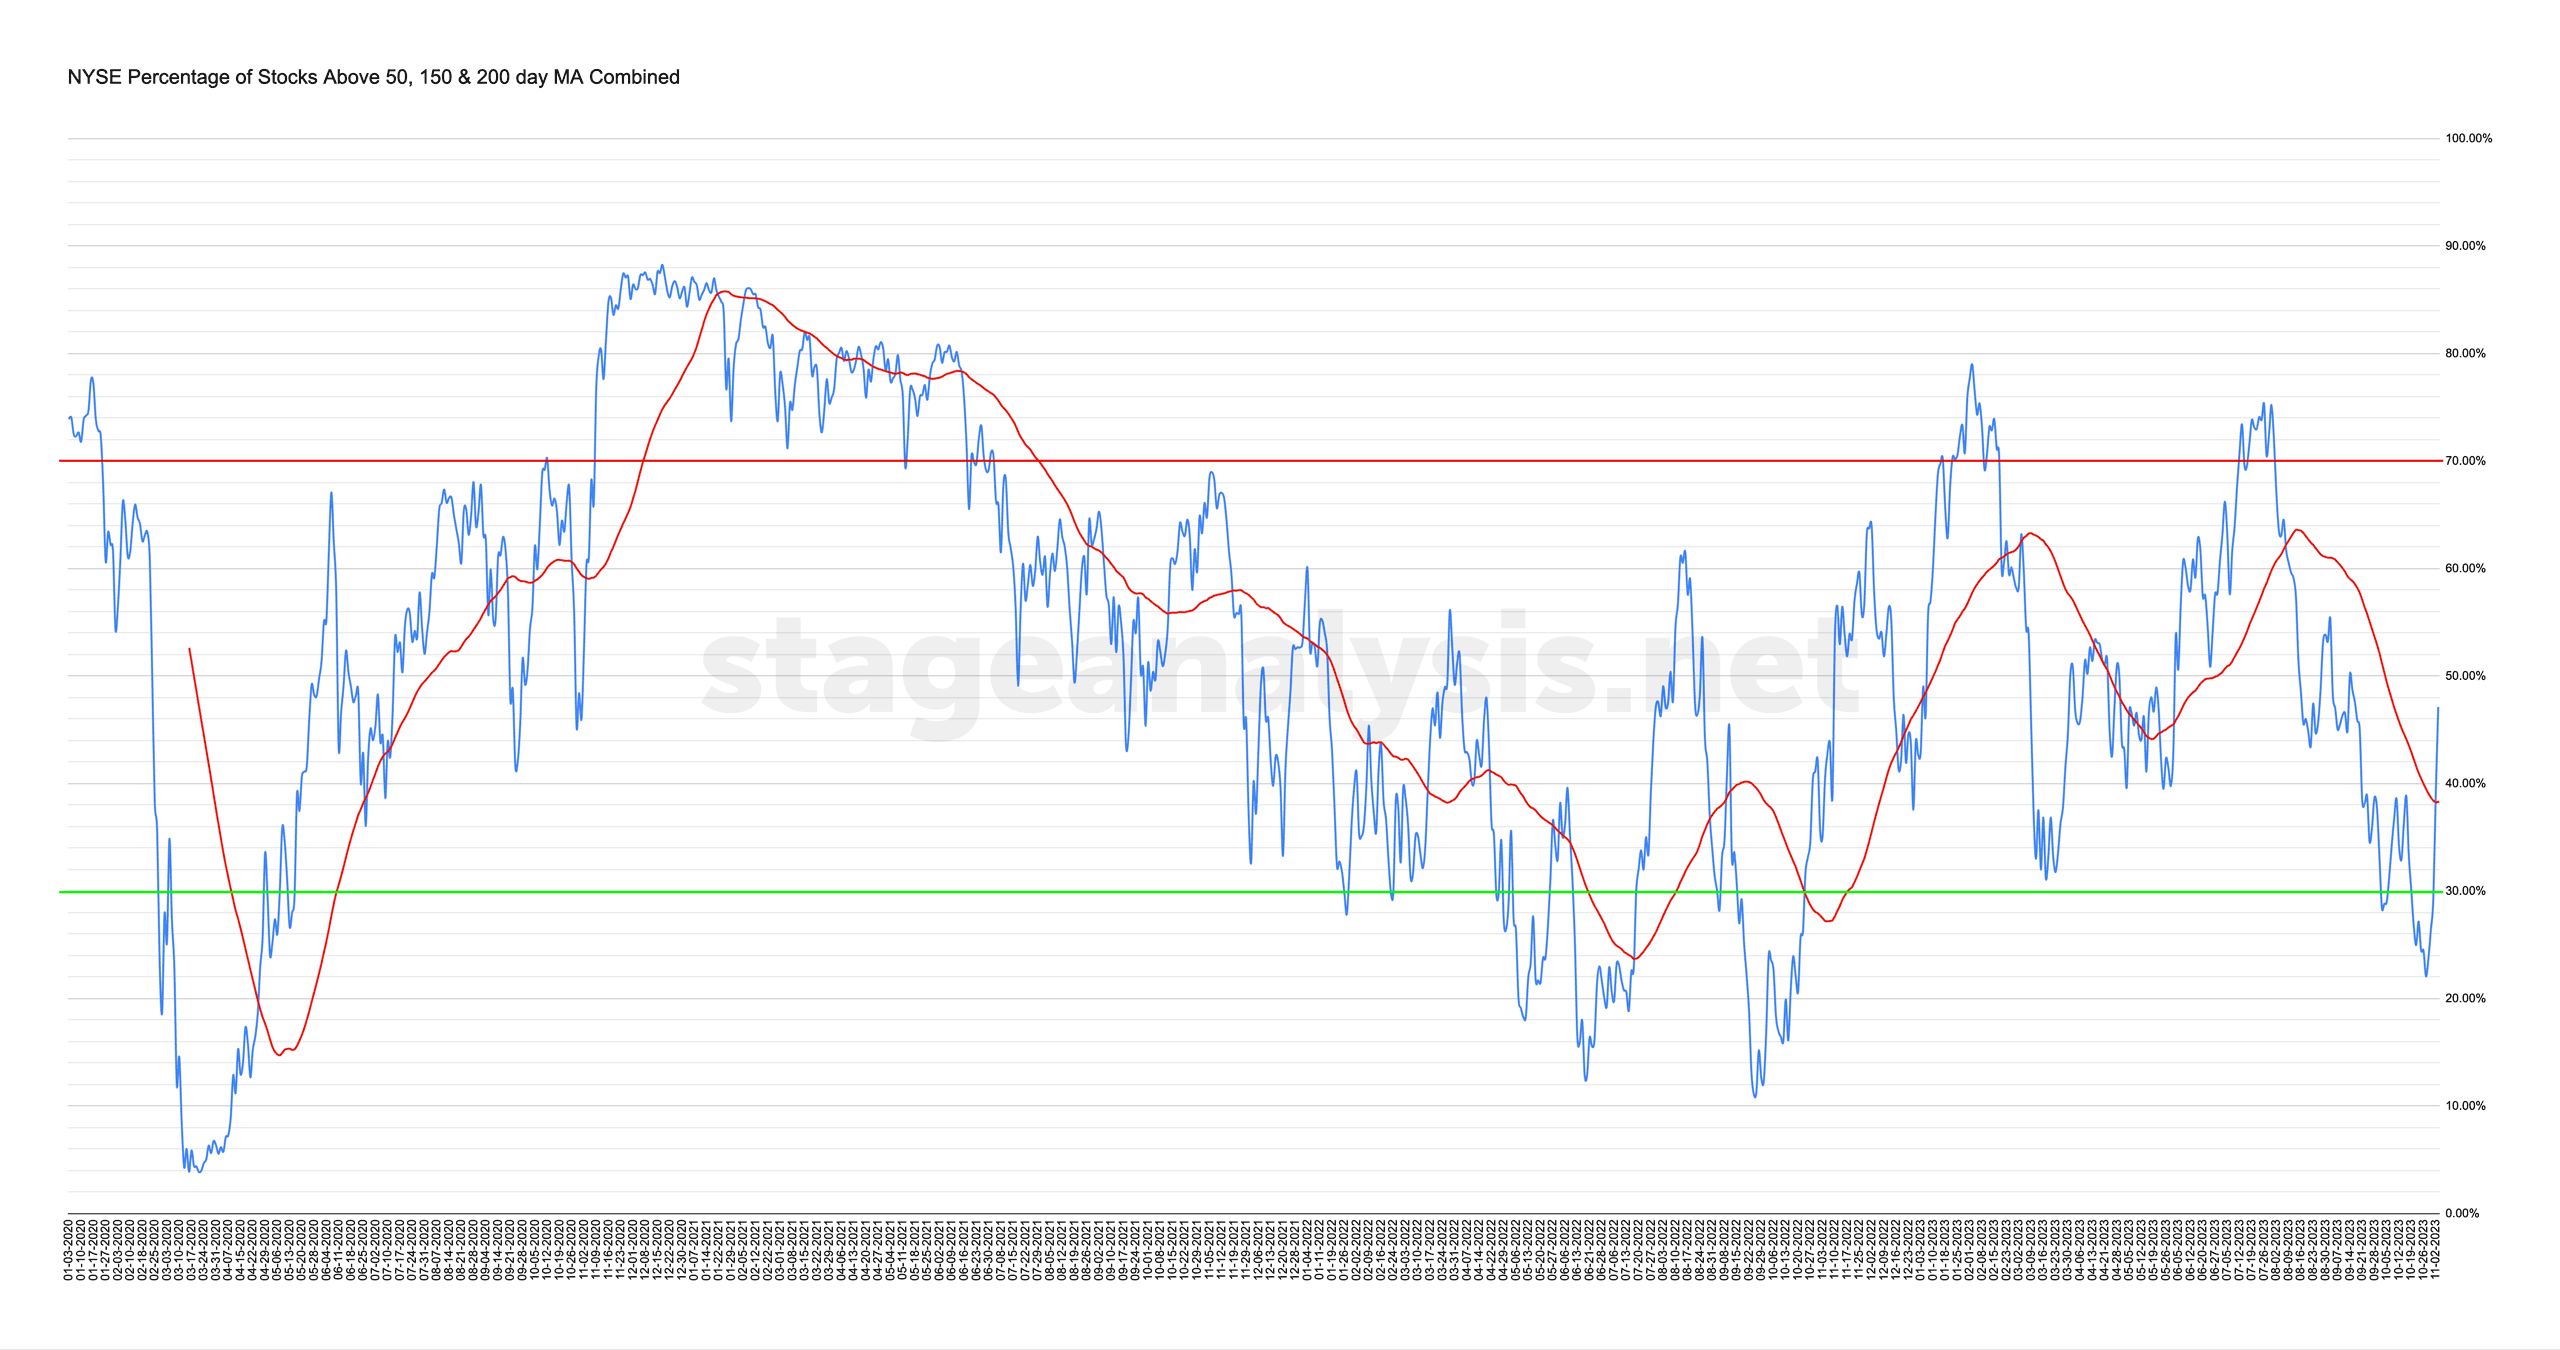
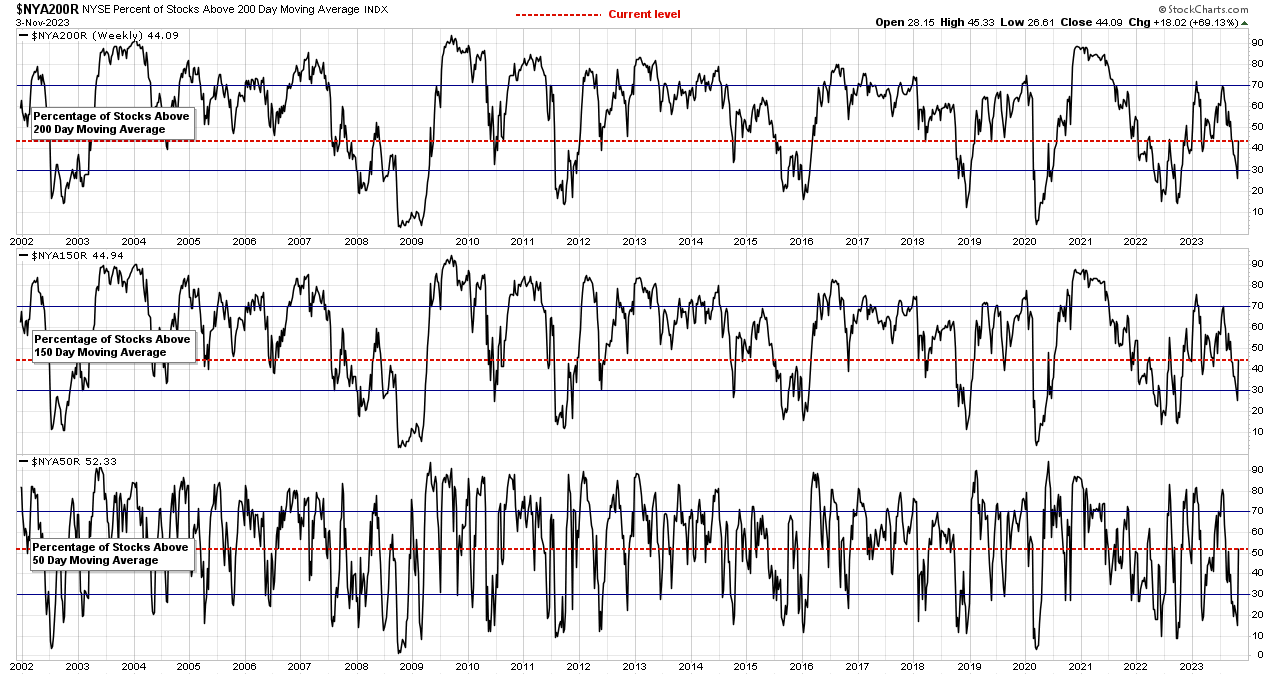
NYSE Total % Stocks Above their 50 Day, 150 Day & 200 Day Moving Averages Combined
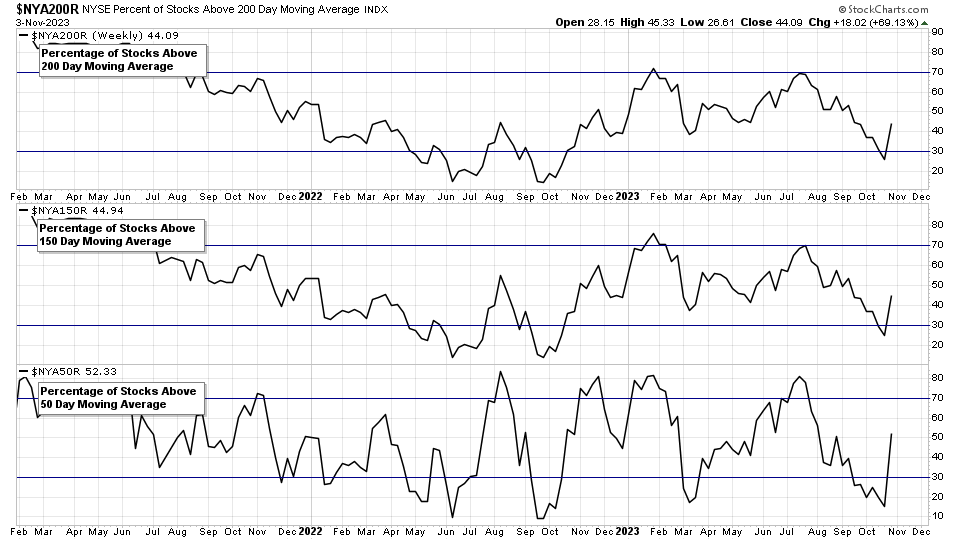
- Long Term: Stocks Above 200 Day MA: 44.09%
- Medium Term: Stocks Above 150 Day MA: 44.94%
- Short Term: Stocks Above 50 Day MA: 52.33%
47.12% (+25.05% 1wk)
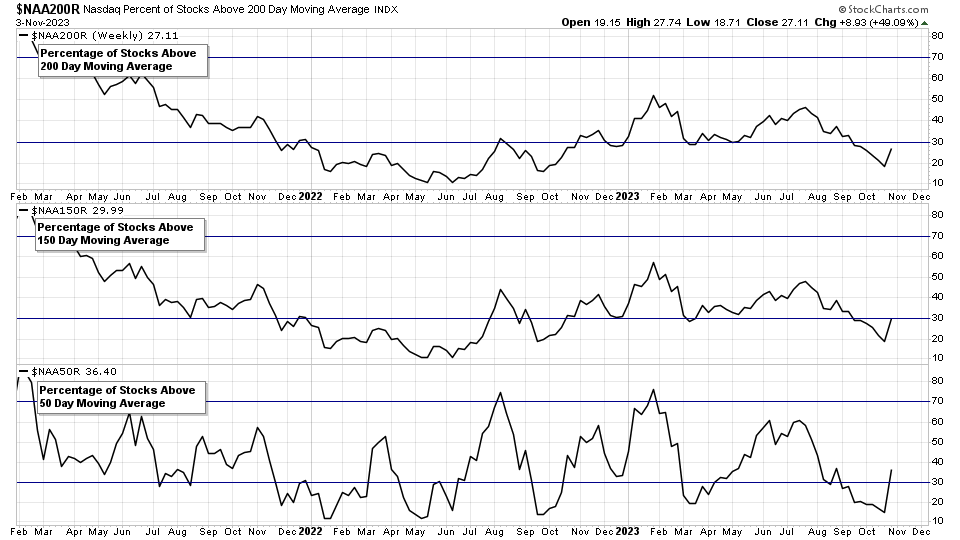
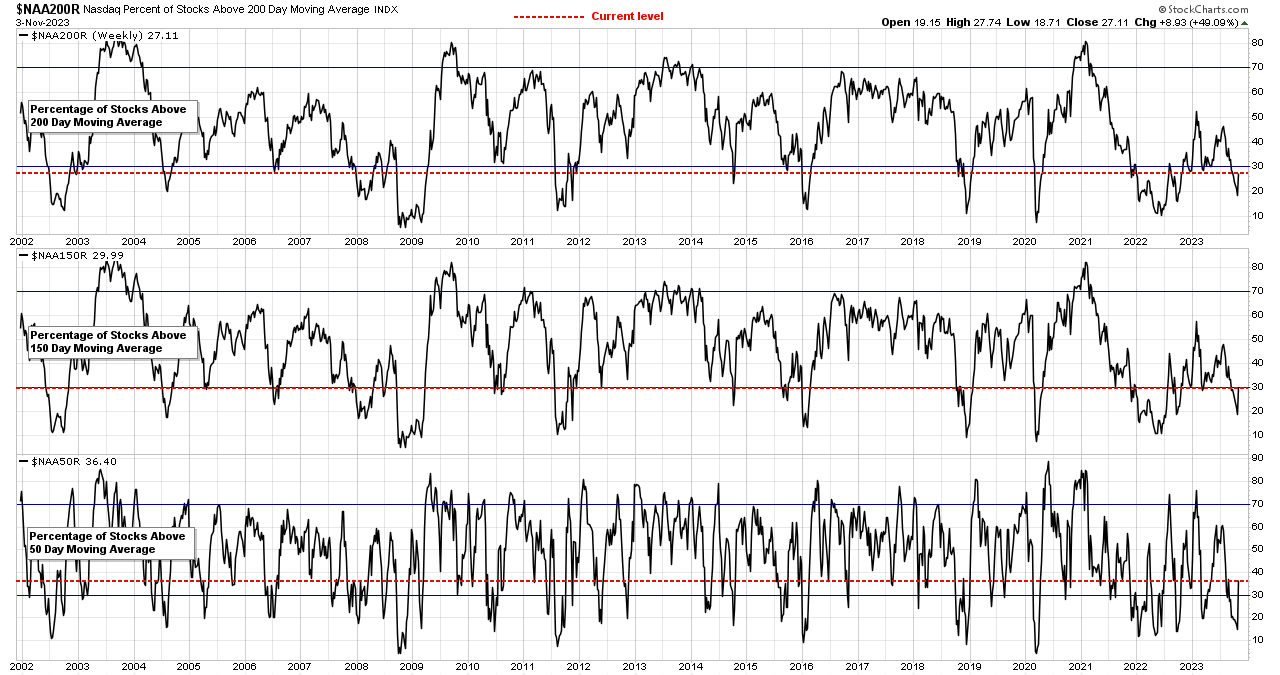
Nasdaq Total % Stocks Above their 50 Day, 150 Day & 200 Day Moving Averages Combined
- Long Term: Stocks Above 200 Day MA: 27.11%
- Medium Term: Stocks Above 150 Day MA: 29.99%
- Short Term: Stocks Above 50 Day MA: 36.40%
31.17% (+13.81% 1wk)
Become a Stage Analysis Member:
To see more like this – US Stocks watchlist posts, detailed videos each weekend, use our unique Stage Analysis tools, such as the US Stocks & ETFs Screener, Charts, Market Breadth, Group Relative Strength and more...
Join Today
Disclaimer: For educational purpose only. Not investment advice. Seek professional advice from a financial advisor before making any investing decisions.