
US Stocks Watchlist – 31 October 2023
The full post is available to view by members only. For immediate access:
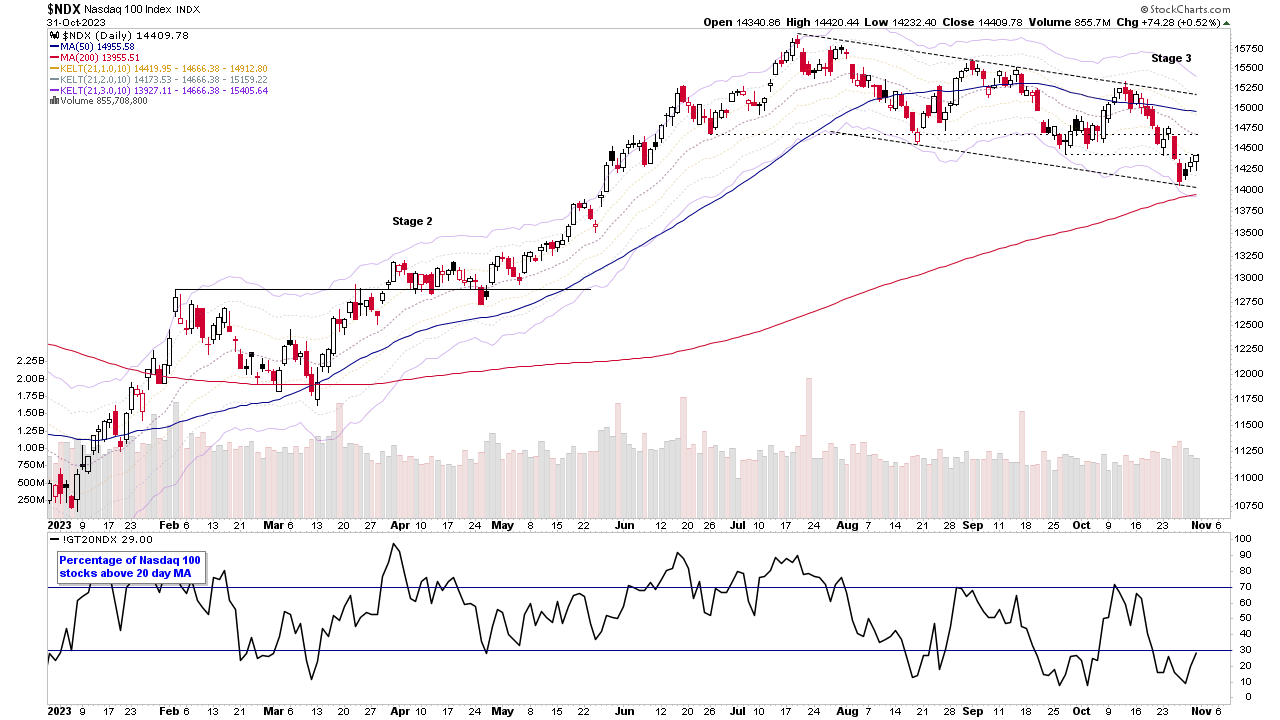
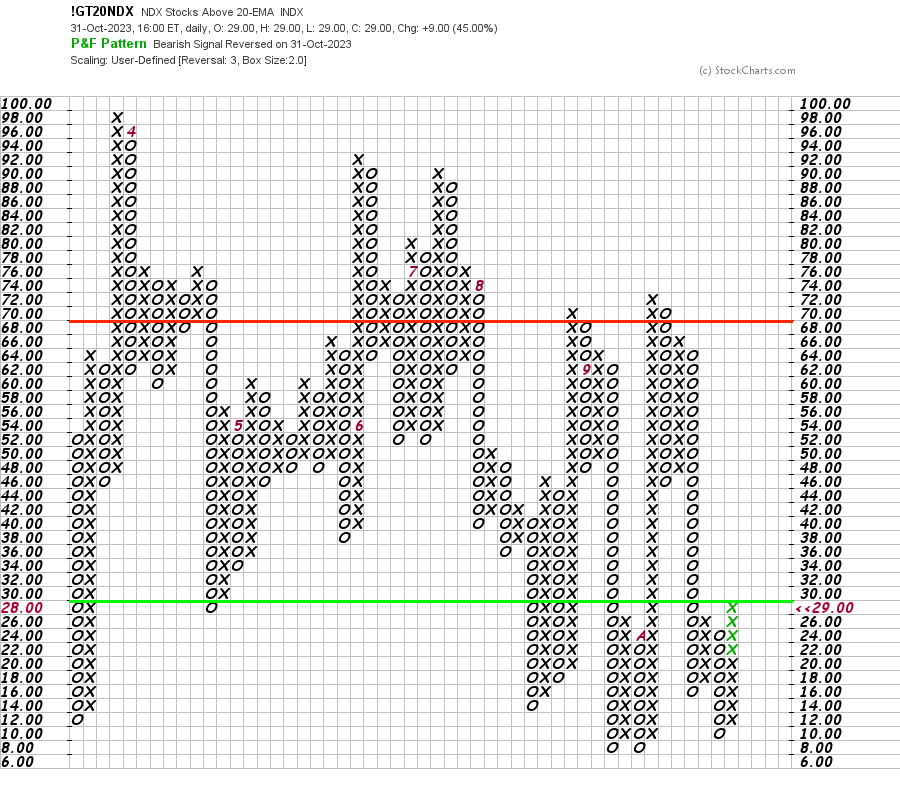
The major indexes continued to gradually rebound from the most recent swing lows, with four days since low the Nasdaq 100 for example, which may turn out to be a bear flag, within the downtrend channel. However, the rebound attempt has caused some of the very short-term market breadth measures to turn back to positive, with the percentage of stocks above their 20 day EMA in the Nasdaq 100 rising +9% to close at 29% – and in doing so forming a double top breakout on the point and figure chart (see the market breadth charts further down the post).
The Fed rate decision is tomorrow, and AAPL reports on Thursday. So they will likely be the key drivers this week.
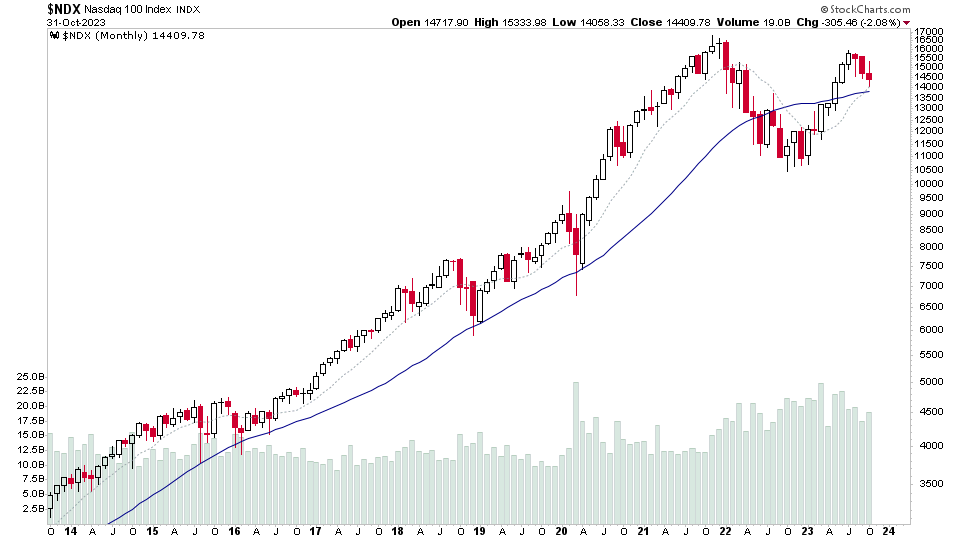
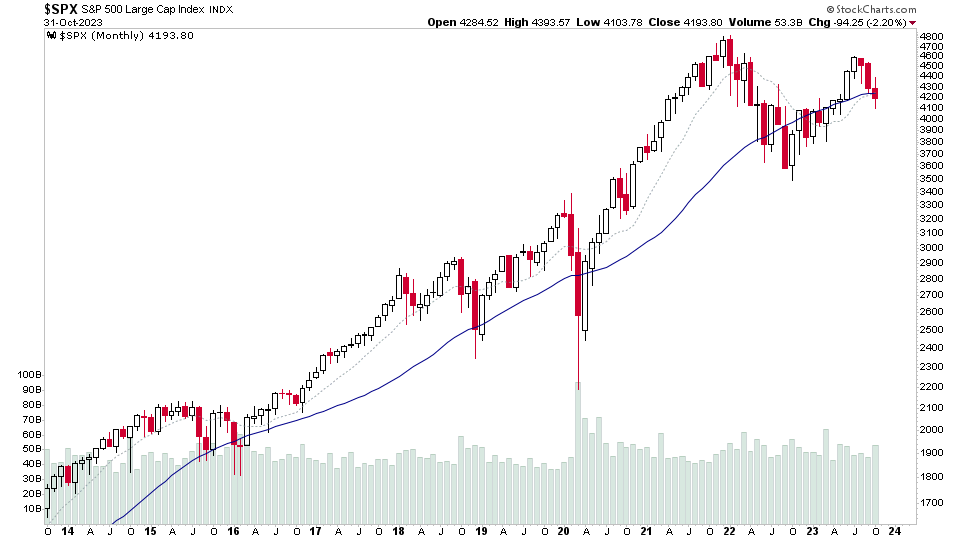
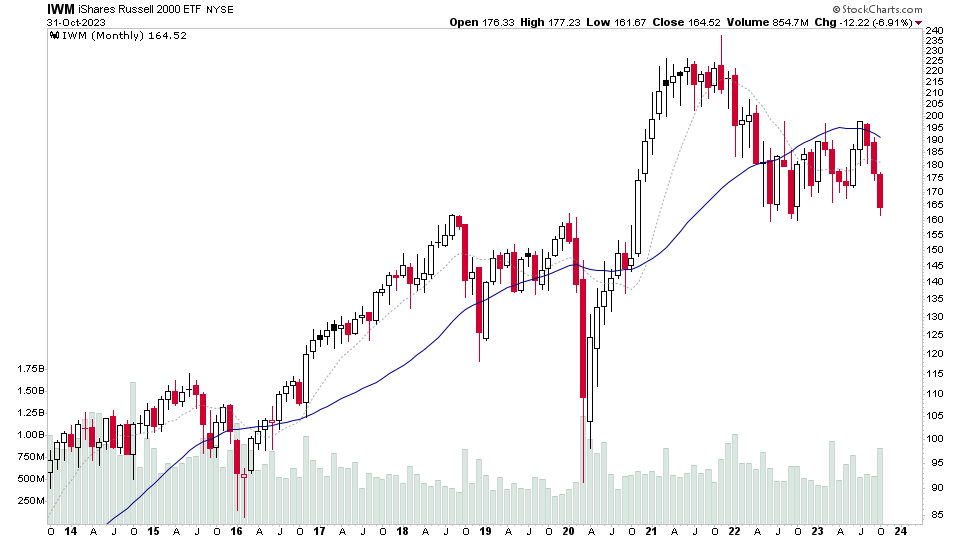
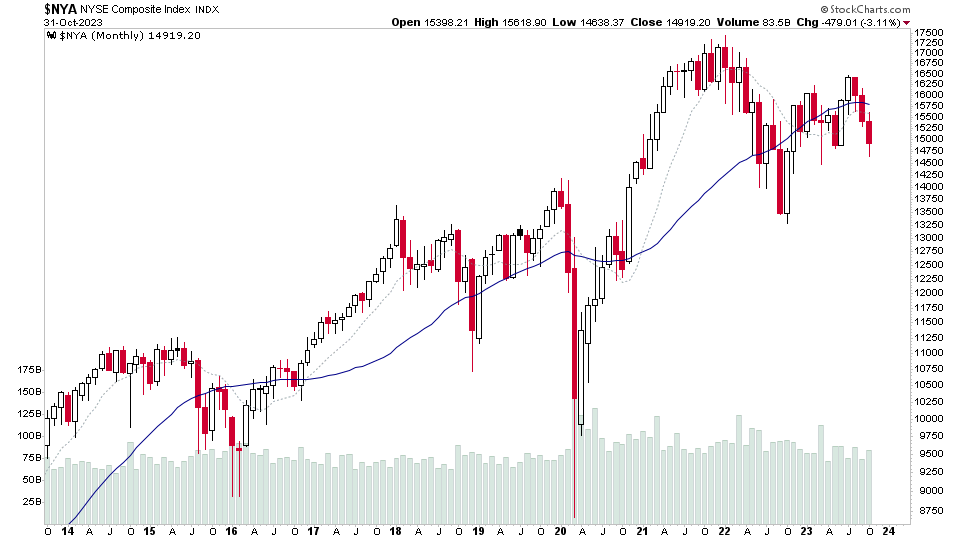
Monthly Charts: Nasdaq 100, S&P 500, Russell 2000 and NYSE
On the monthly charts, the Nasdaq 100 is the only major US index still above its long-term 30 month MA, and it has continued to show the most relative strength in the market, while the majority of indexes and stocks have dipped into Stage 4 territory.
Watchlist Stocks
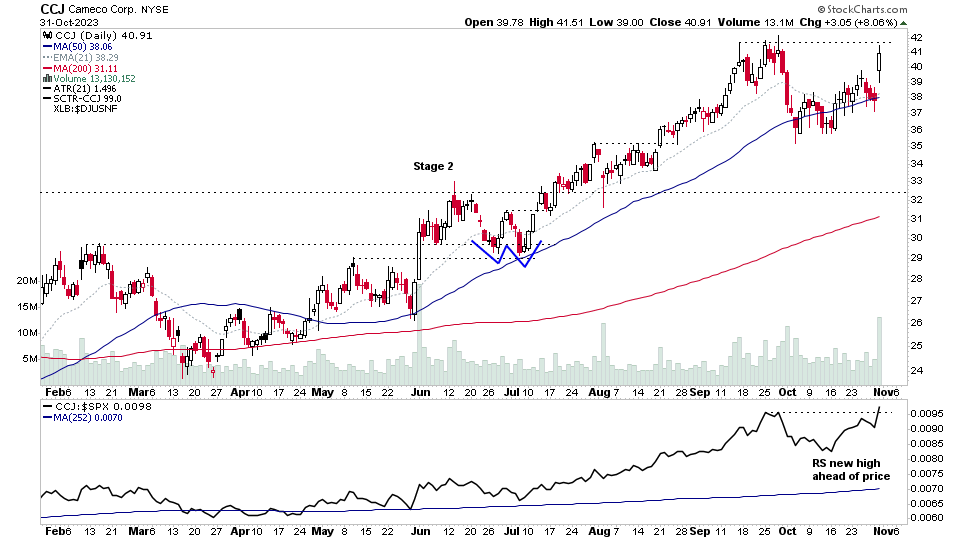
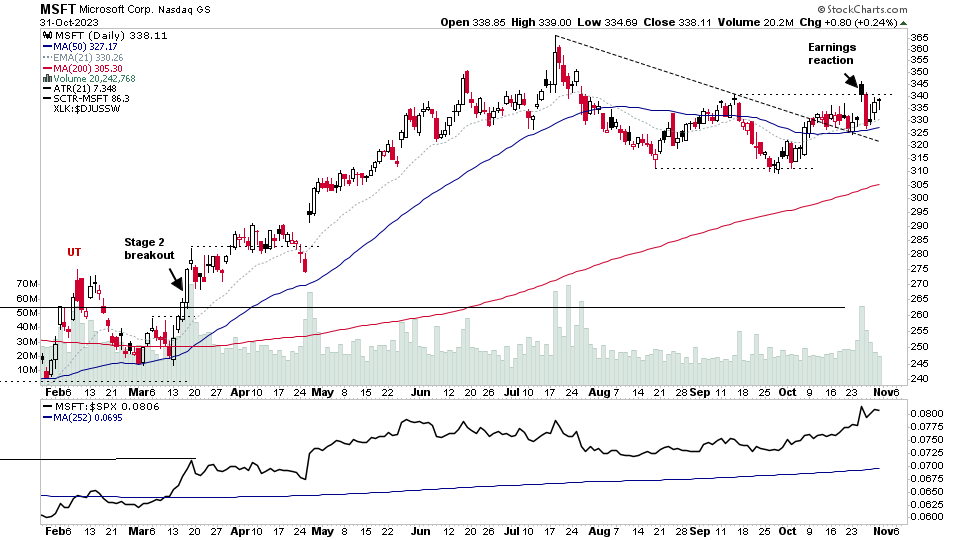
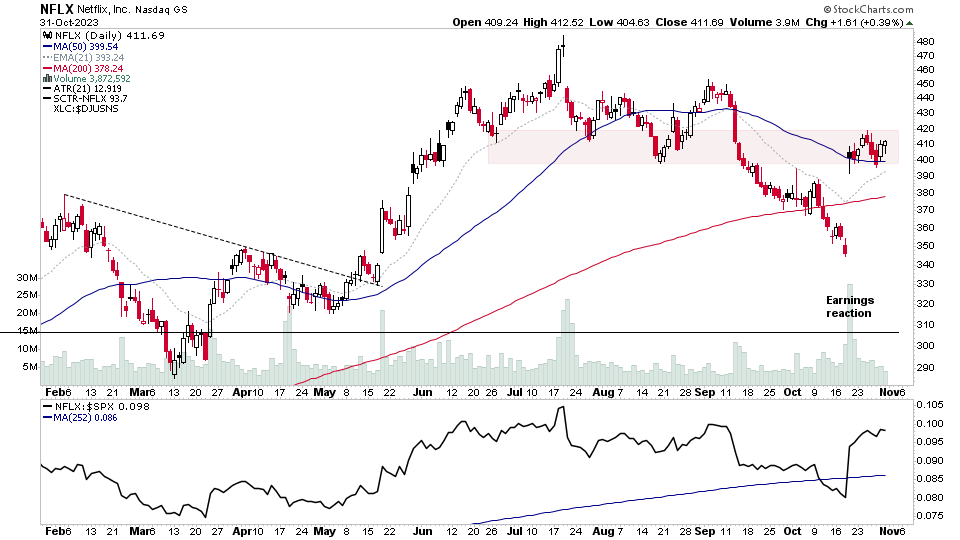
There were 24 stocks highlighted from the US stocks watchlist scans today
CCJ, NFLX, MSFT + 21 more...
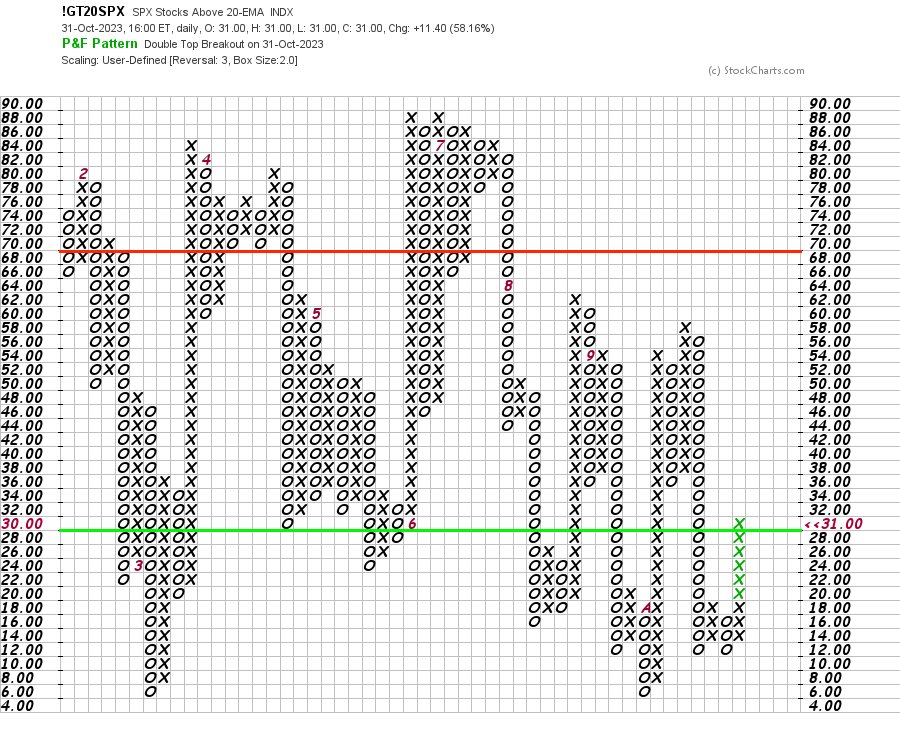
Market Breadth: Percentage of stocks above 20 day EMA
The S&P 500 and Nasdaq 100 percentage of stocks above their 20 day EMA point and figure charts both made double top breakouts today in the lower zone, and so change status to a tentative Bull Confirmed status. But a reminder that these are very short-term breadth measures, so the P&F signals are much more frequent.
Become a Stage Analysis Member:
To see more like this – US Stocks watchlist posts, detailed videos each weekend, use our unique Stage Analysis tools, such as the US Stocks & ETFs Screener, Charts, Market Breadth, Group Relative Strength and more...
Join Today
Disclaimer: For educational purpose only. Not investment advice. Seek professional advice from a financial advisor before making any investing decisions.