
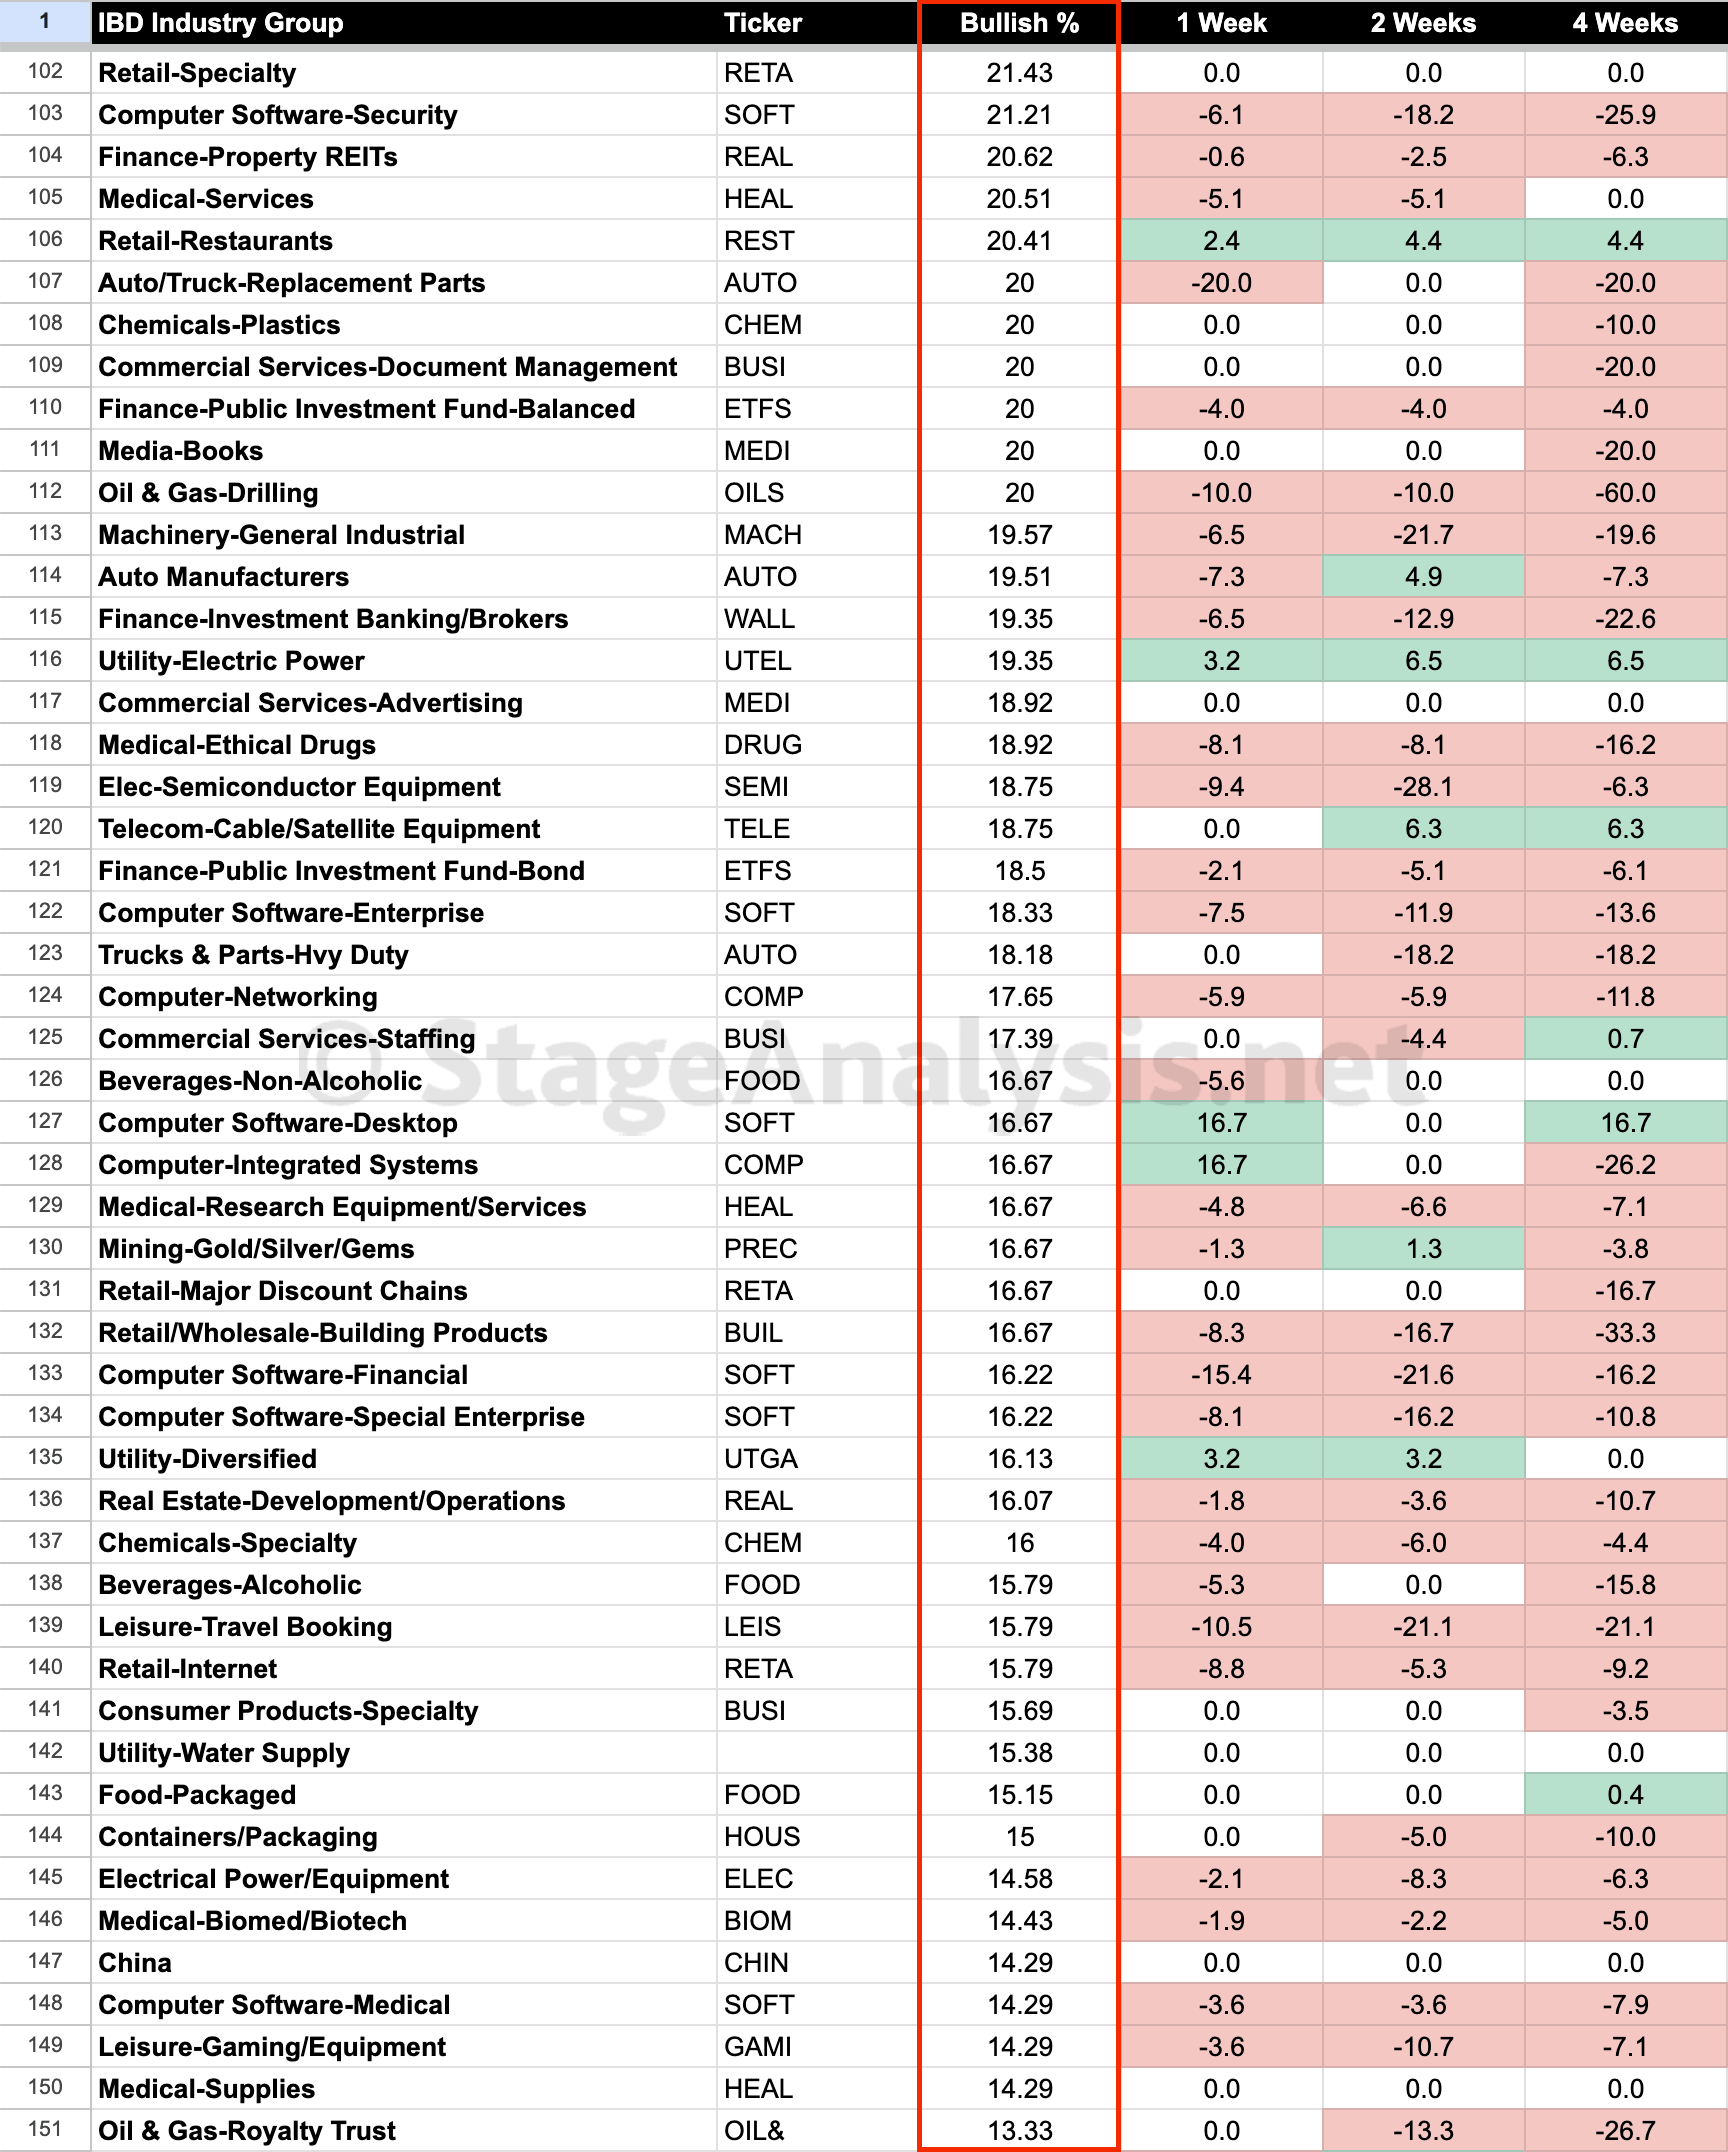
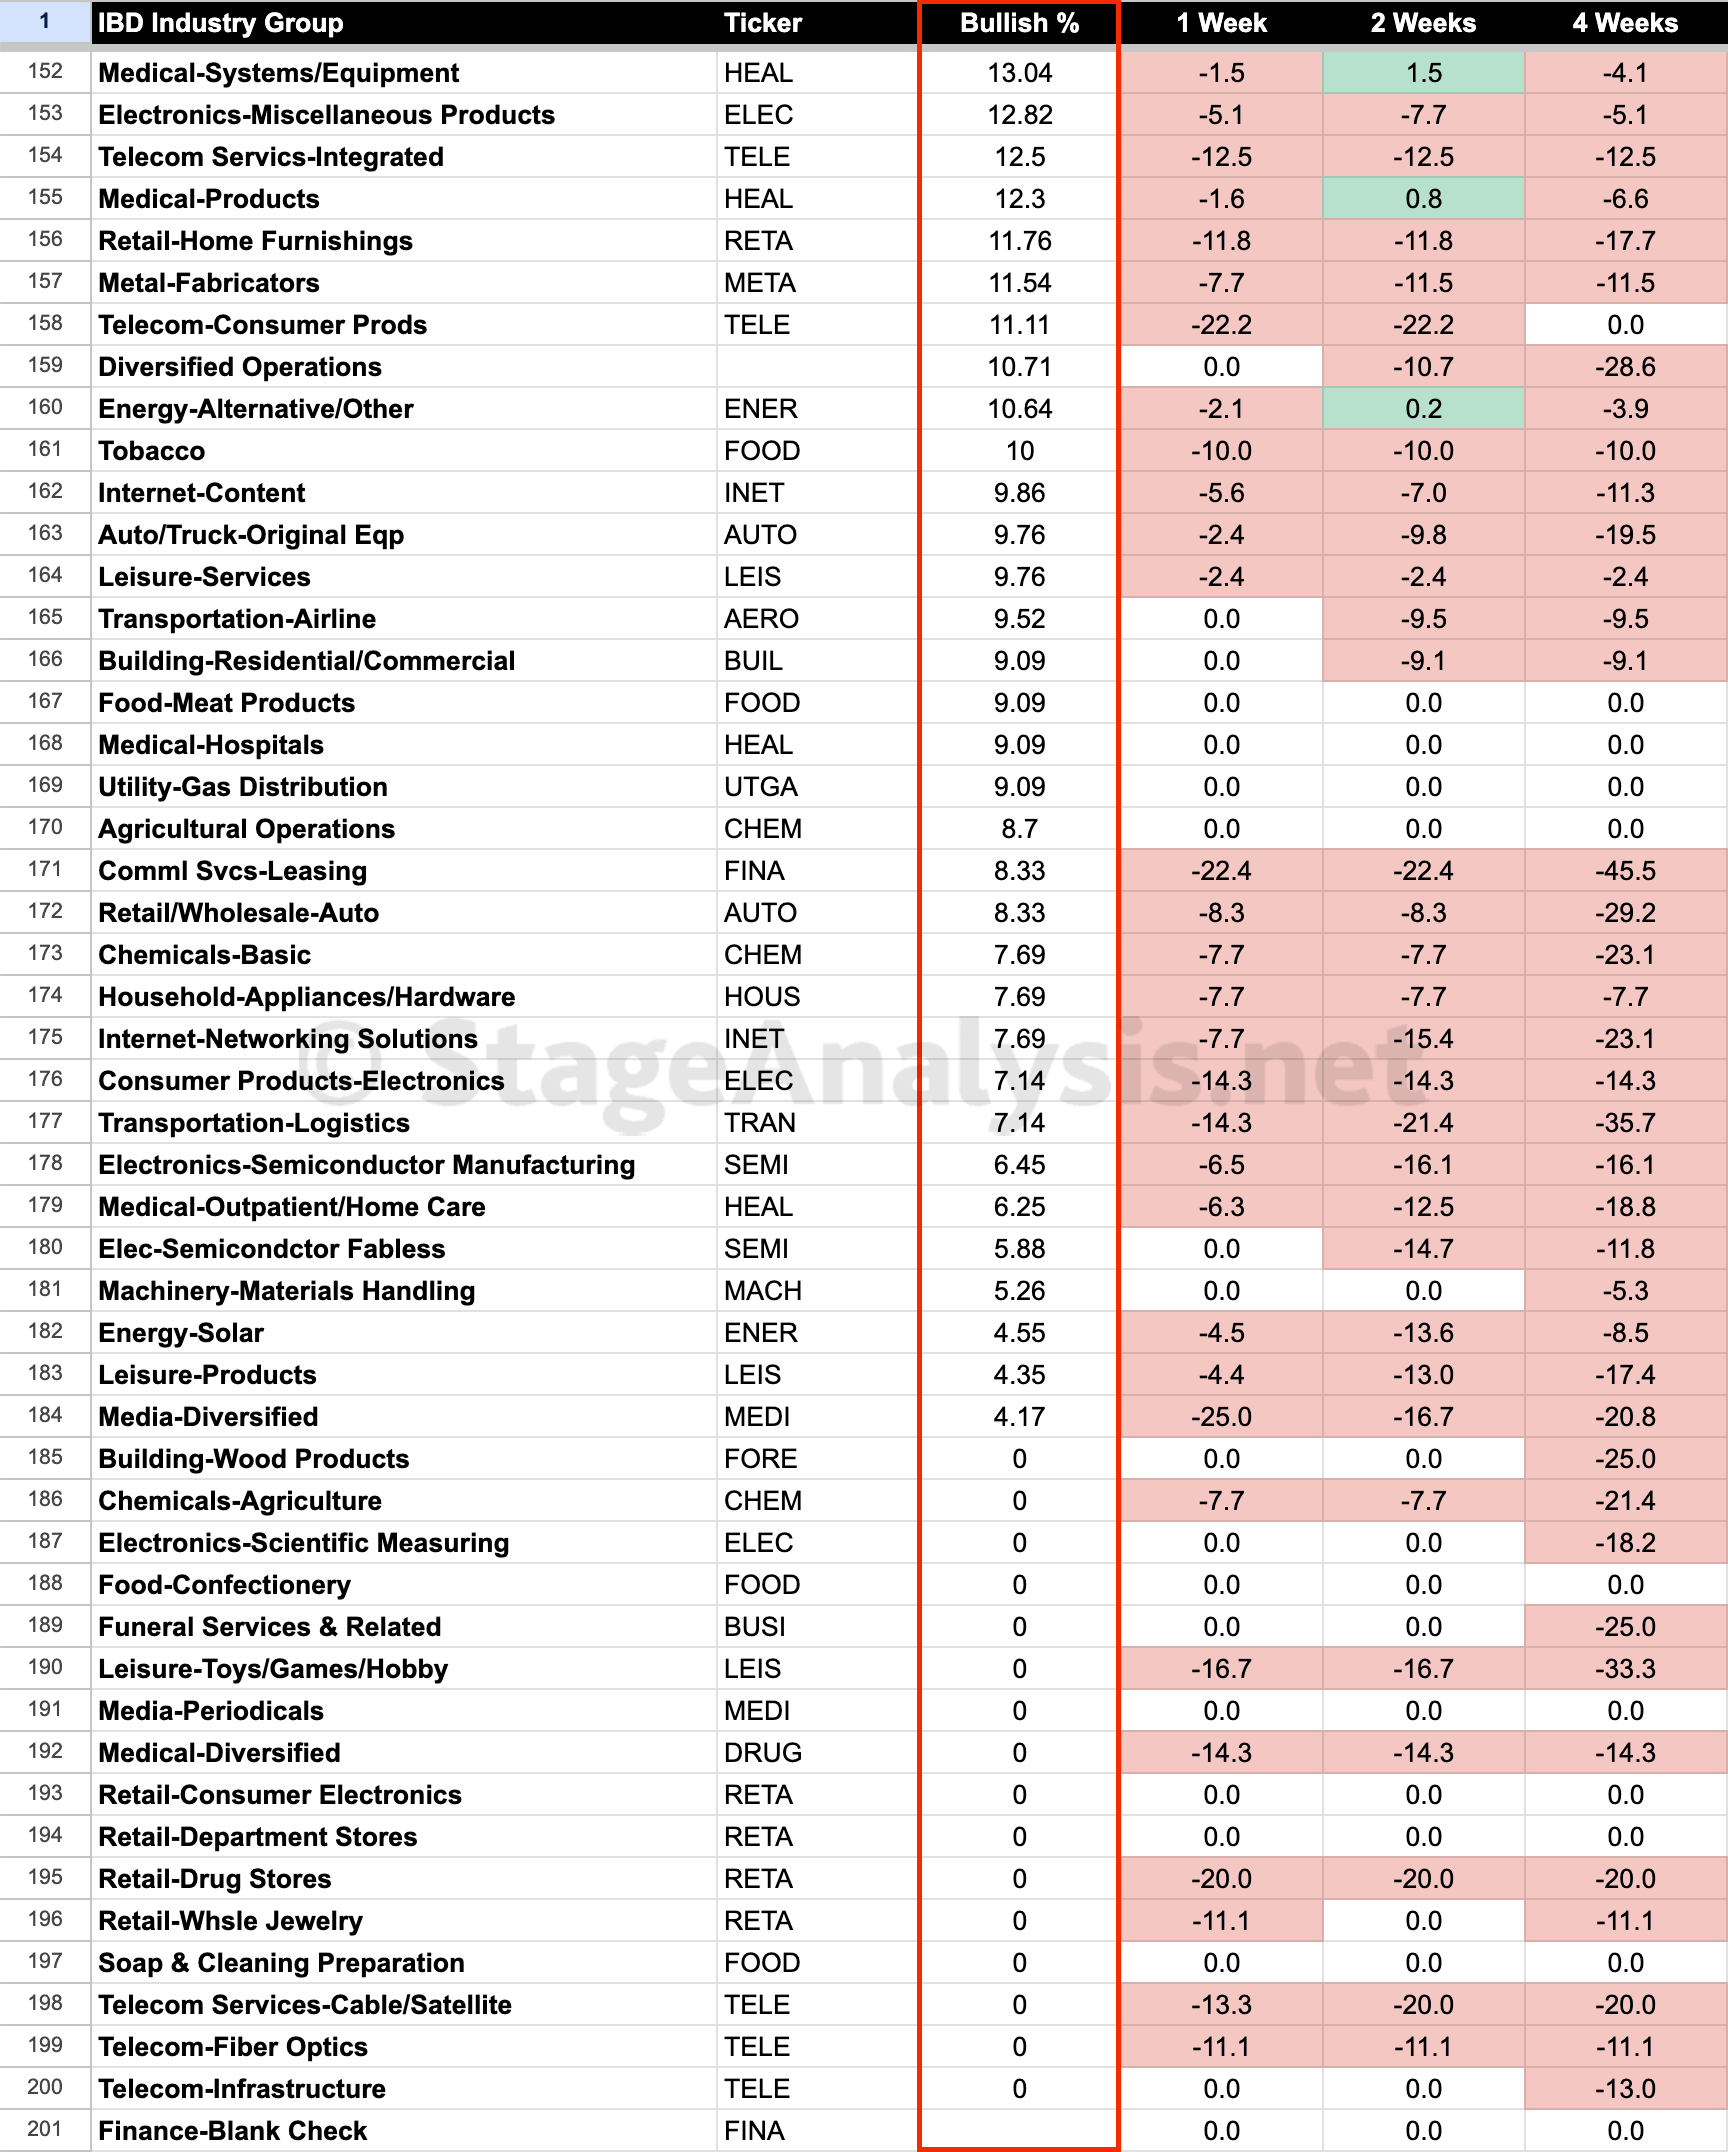
IBD Industry Groups Bell Curve – Bullish Percent
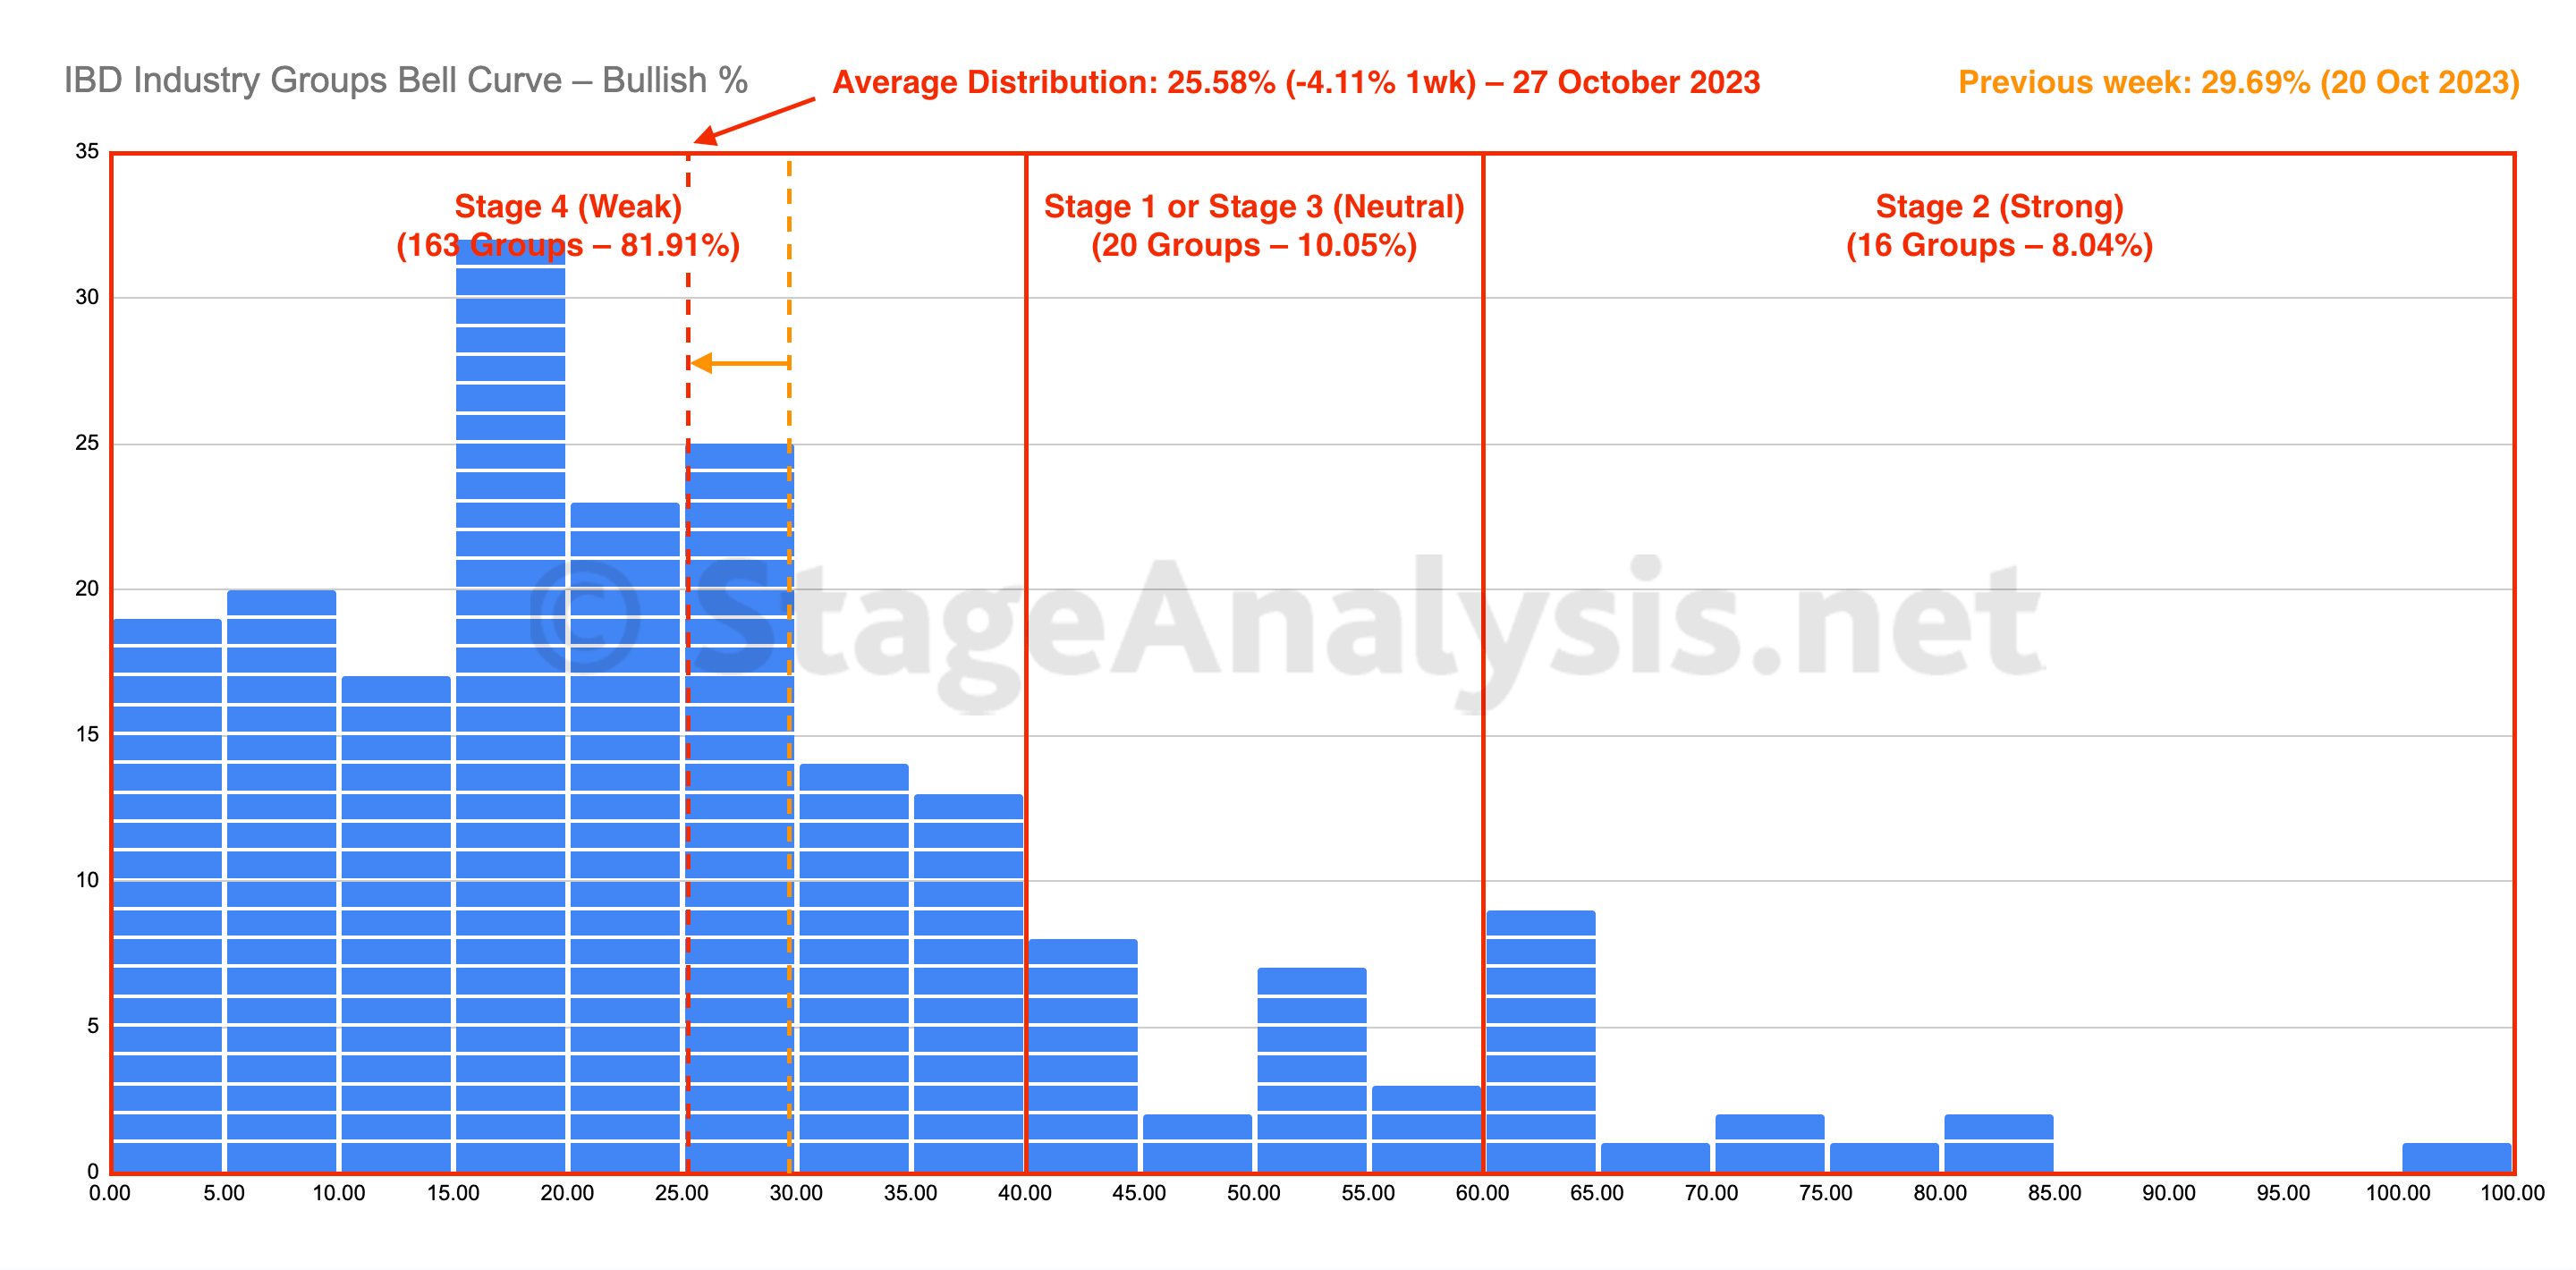
Average Distribution: 25.58% (-4.11% 1wk)
- 163 Groups (81.91%) are in the Stage 4 zone (Weak)
- 20 Groups (10.05%) are in the Stage 1 or Stage 3 zone (Neutral)
- 16 Groups (8.04%) are in the Stage 2 zone (Strong)
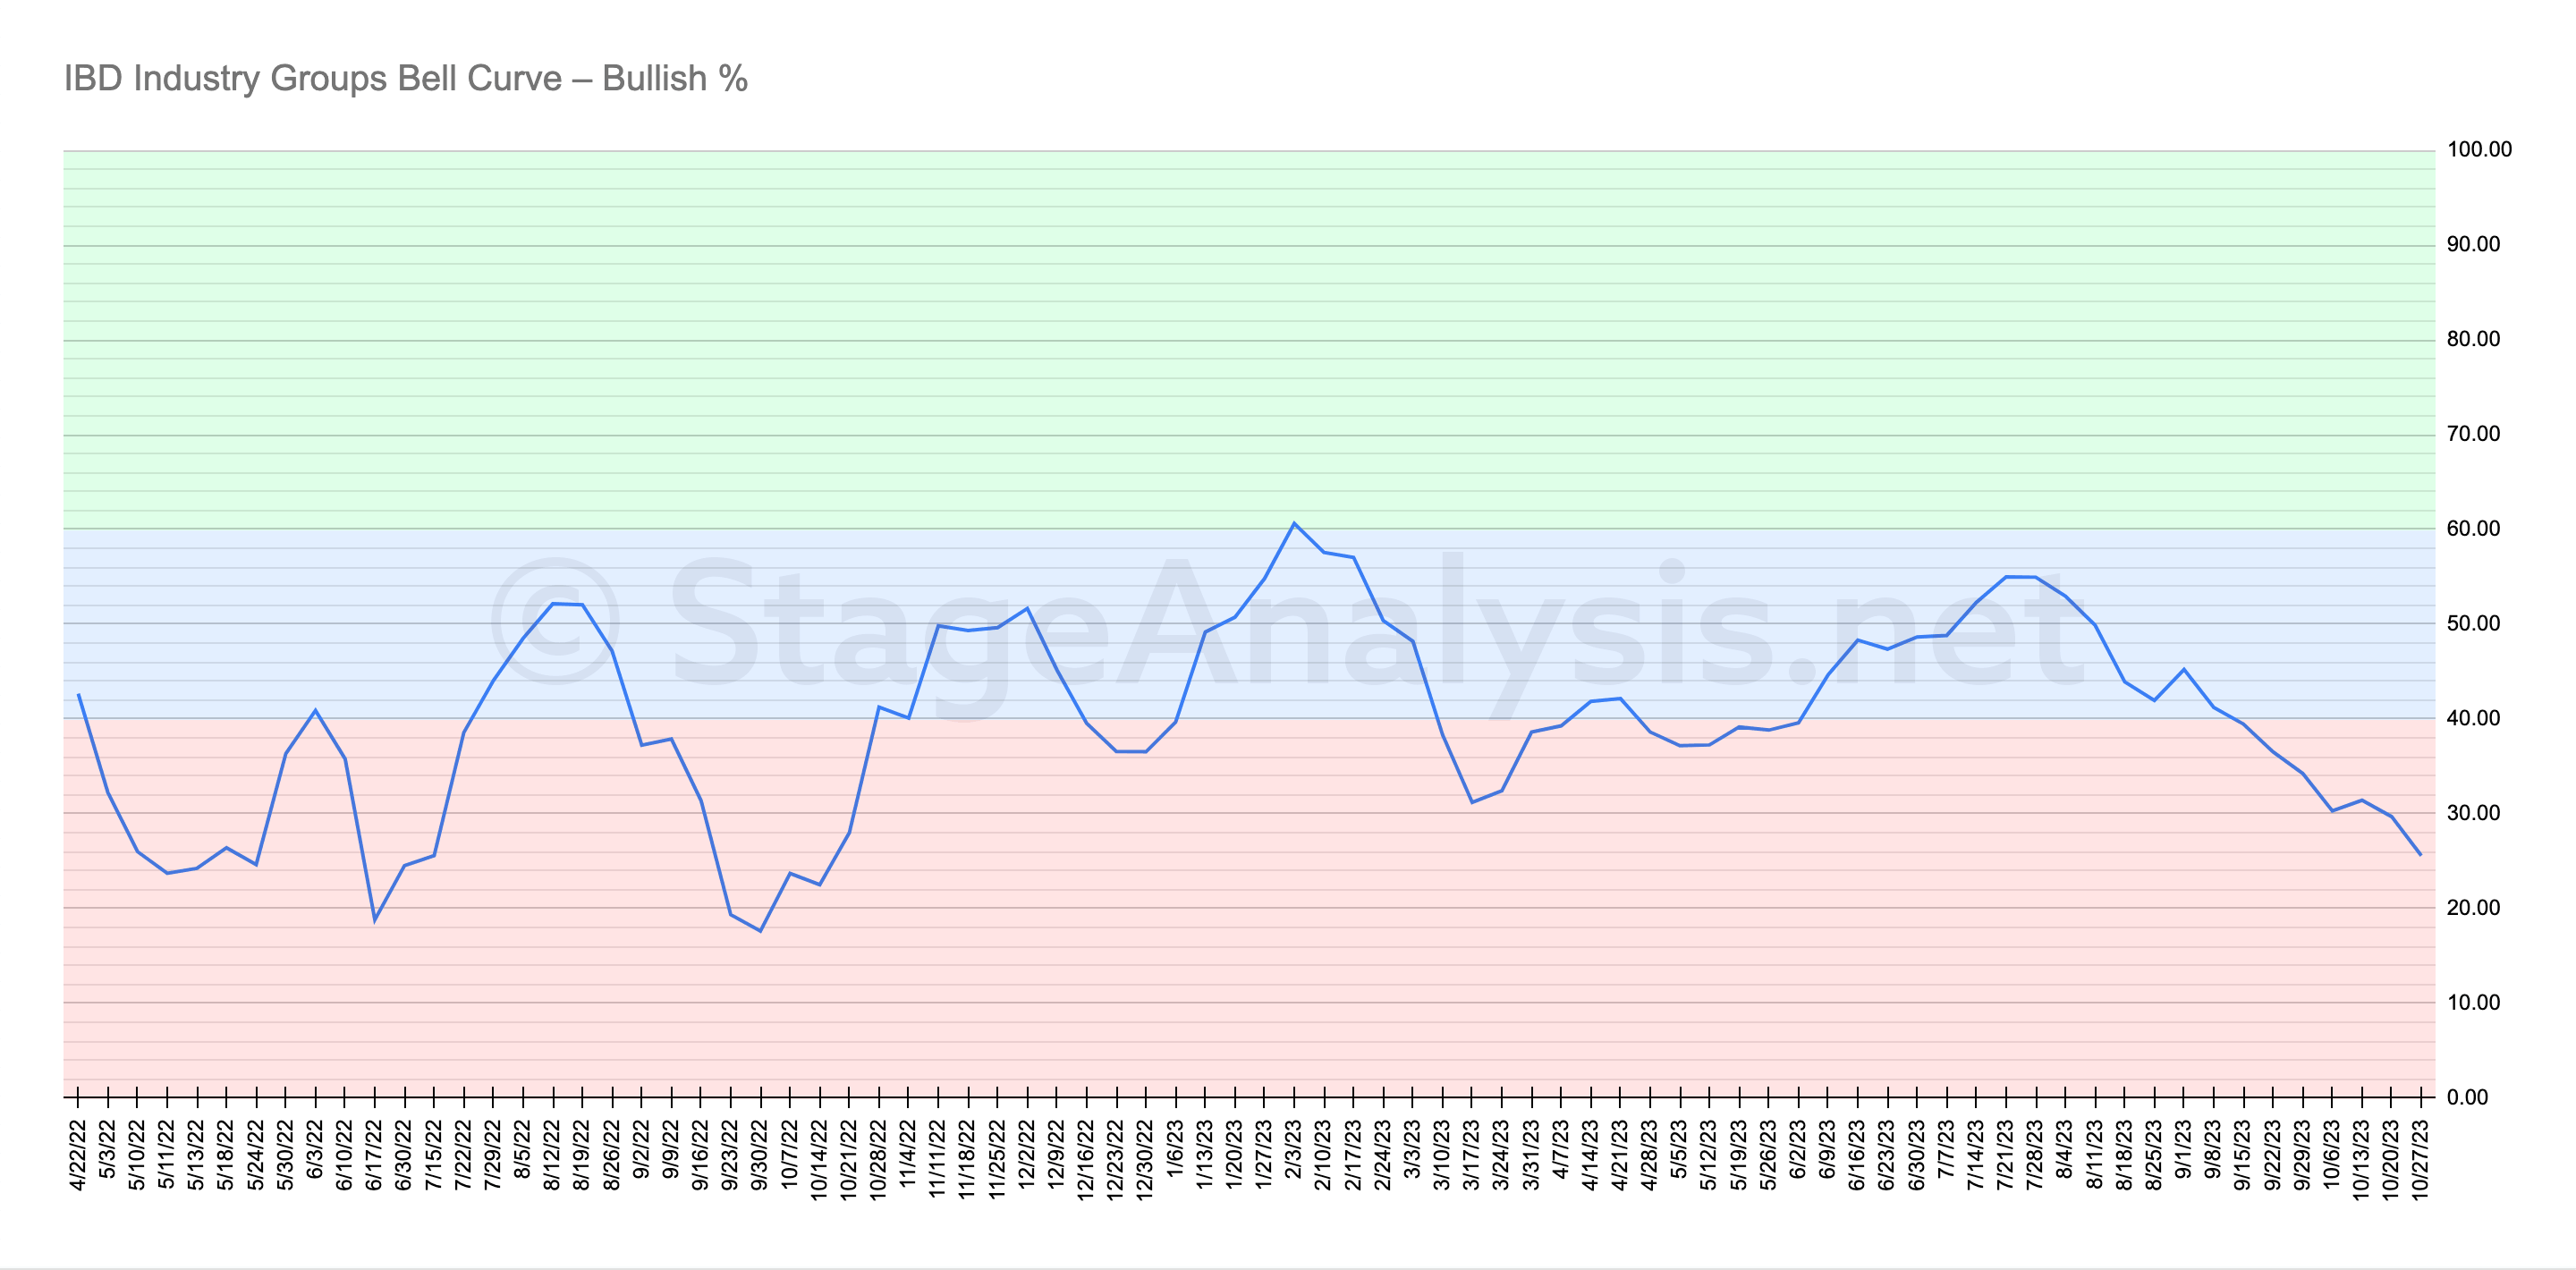
The IBD Industry Groups Bell Curve decreased by -4.11% this week to finish at 25.58% overall.
The amount of groups in Stage 4 (Weak) increased by 15 (+7.5%), and the amount of groups in Stage 2 (Strong) decreased by 2 (-1%), while the amount groups in Stage 1 or Stage 3 (Neutral) decreased by 13 (-6.5%).
Therefore, the overall distribution of the bell curve has continued deeper into the lower zone, which means the overall weighting is tilted strongly to the negative side of the spectrum, with 4 out of 5 industry groups with less than 40% of their component stocks on point and figure buy signals, and 10.19x as many groups in the Stage 4 zone than Stage 2 zone.
Hence it remains a very difficult trading environment, but it is starting to approach the lower extreme with the vast majority of groups on the negative side of the scales, but it is still around 8% to 10% stronger than the levels at which the June and October 2022 major swing lows occurred for reference.
To compare against the previous blog post: IBD Industry Groups Bell Curve – Bullish Percent (20 October 2023).
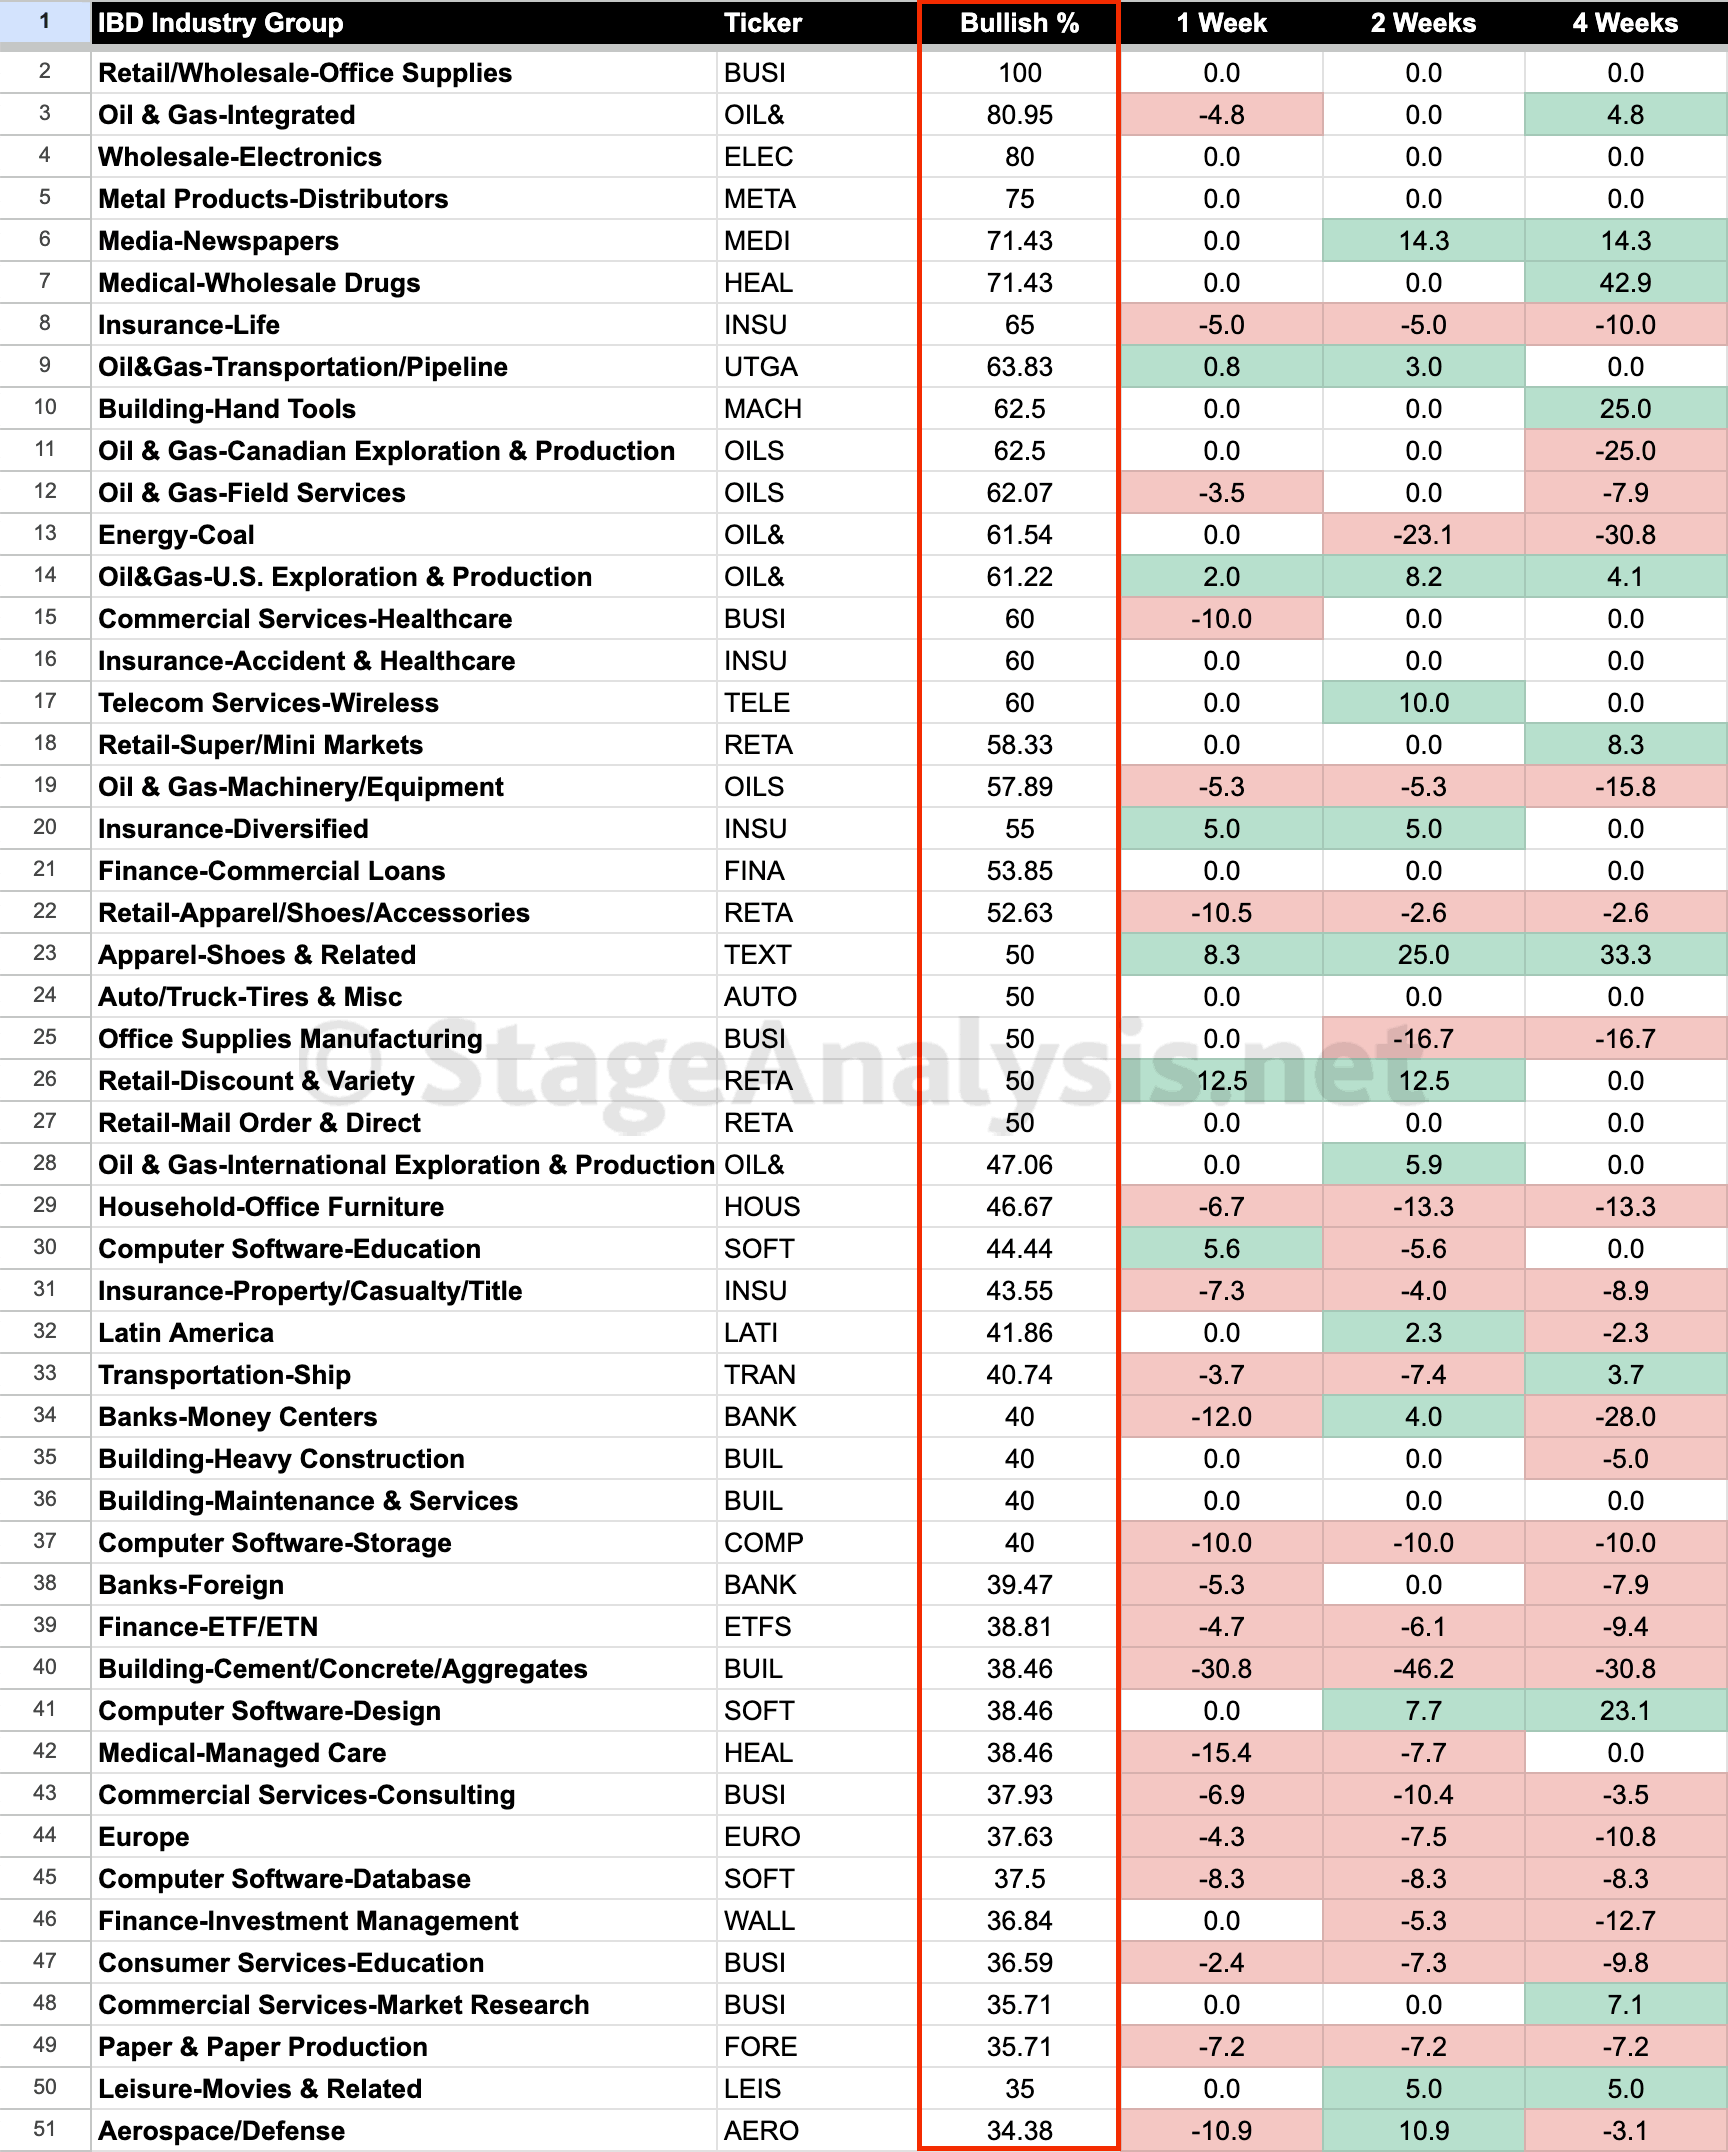
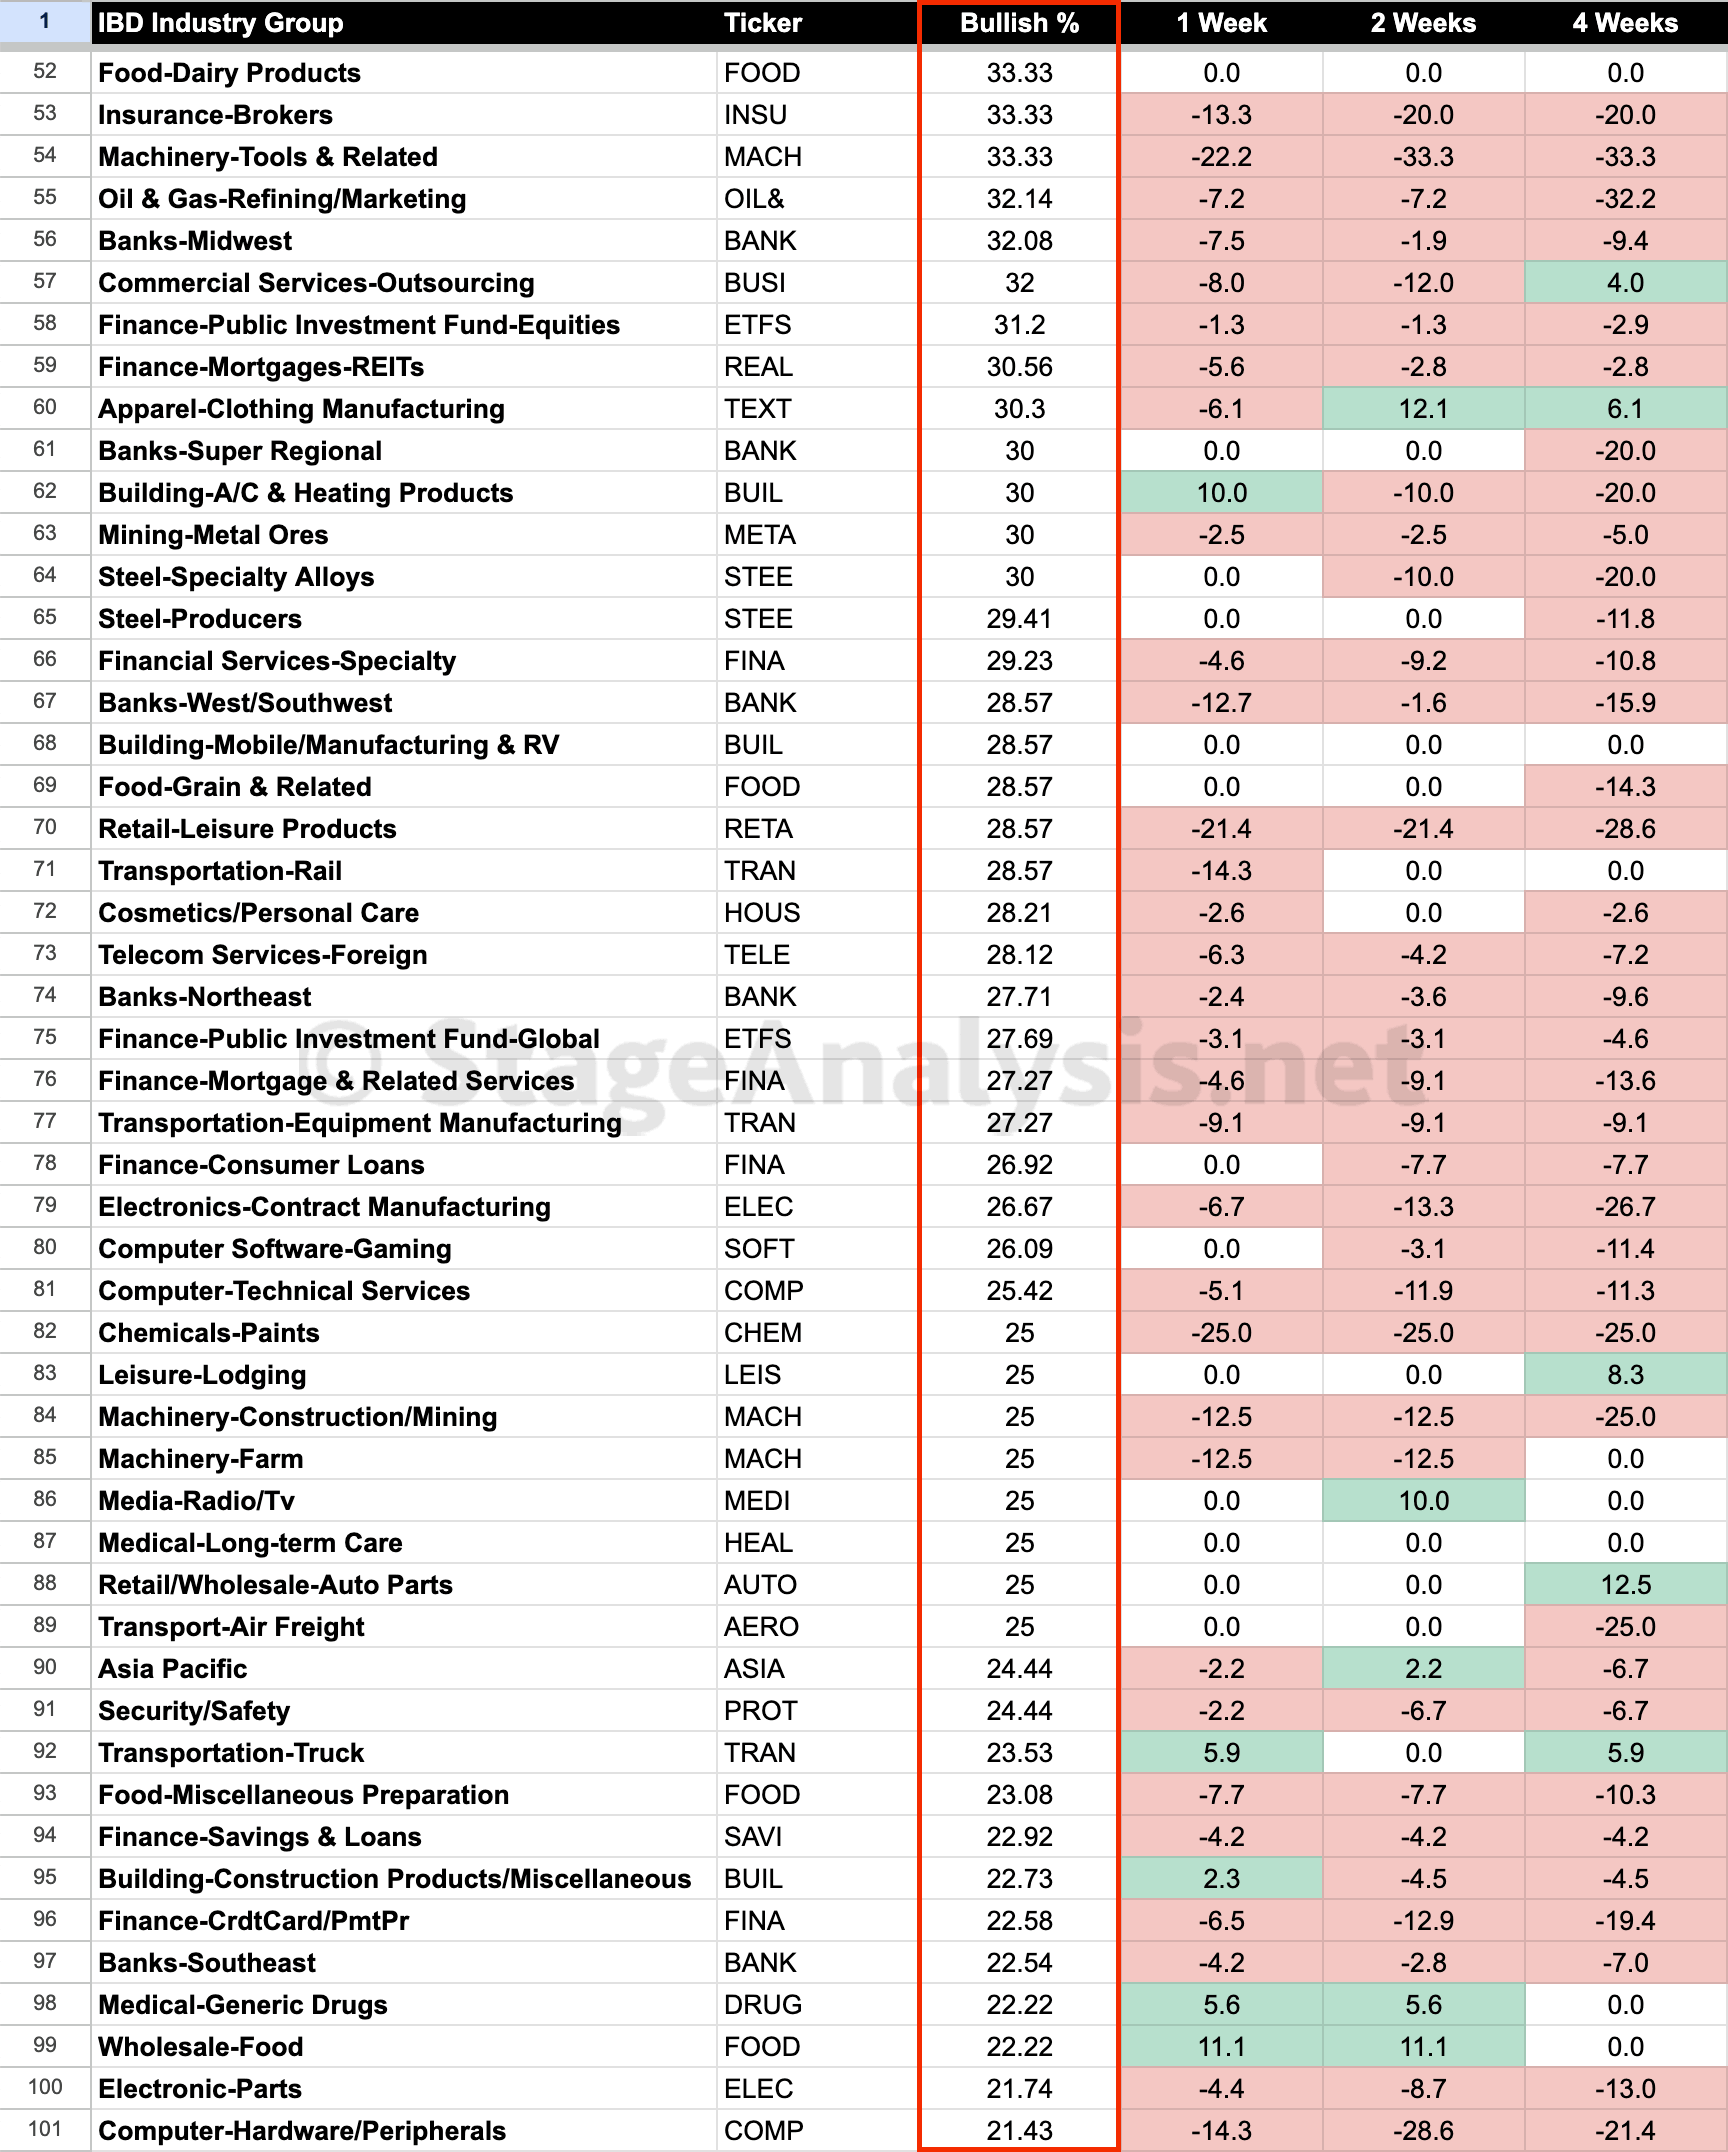
Below is the Bell Curve line chart and the data tables of the IBD groups bullish percent in order of relative strength and the position changes over the last 1, 2 and 4 weeks.
Become a Stage Analysis Member:
To see more like this – US Stocks watchlist posts, detailed videos each weekend, use our unique Stage Analysis tools, such as the US Stocks & ETFs Screener, Charts, Market Breadth, Group Relative Strength and more...
Join Today
Disclaimer: For educational purpose only. Not investment advice. Seek professional advice from a financial advisor before making any investing decisions.