
Stage Analysis Technical Attributes Scores – Nasdaq 100
The Stage Analysis Technical Attributes (SATA) score is our proprietary indicator that helps to identify the four stages from Stan Weinstein's Stage Analysis method, using a scoring system from 0 to 10 that rates ten of the key technical characteristics that we look for when analysing the weekly charts.
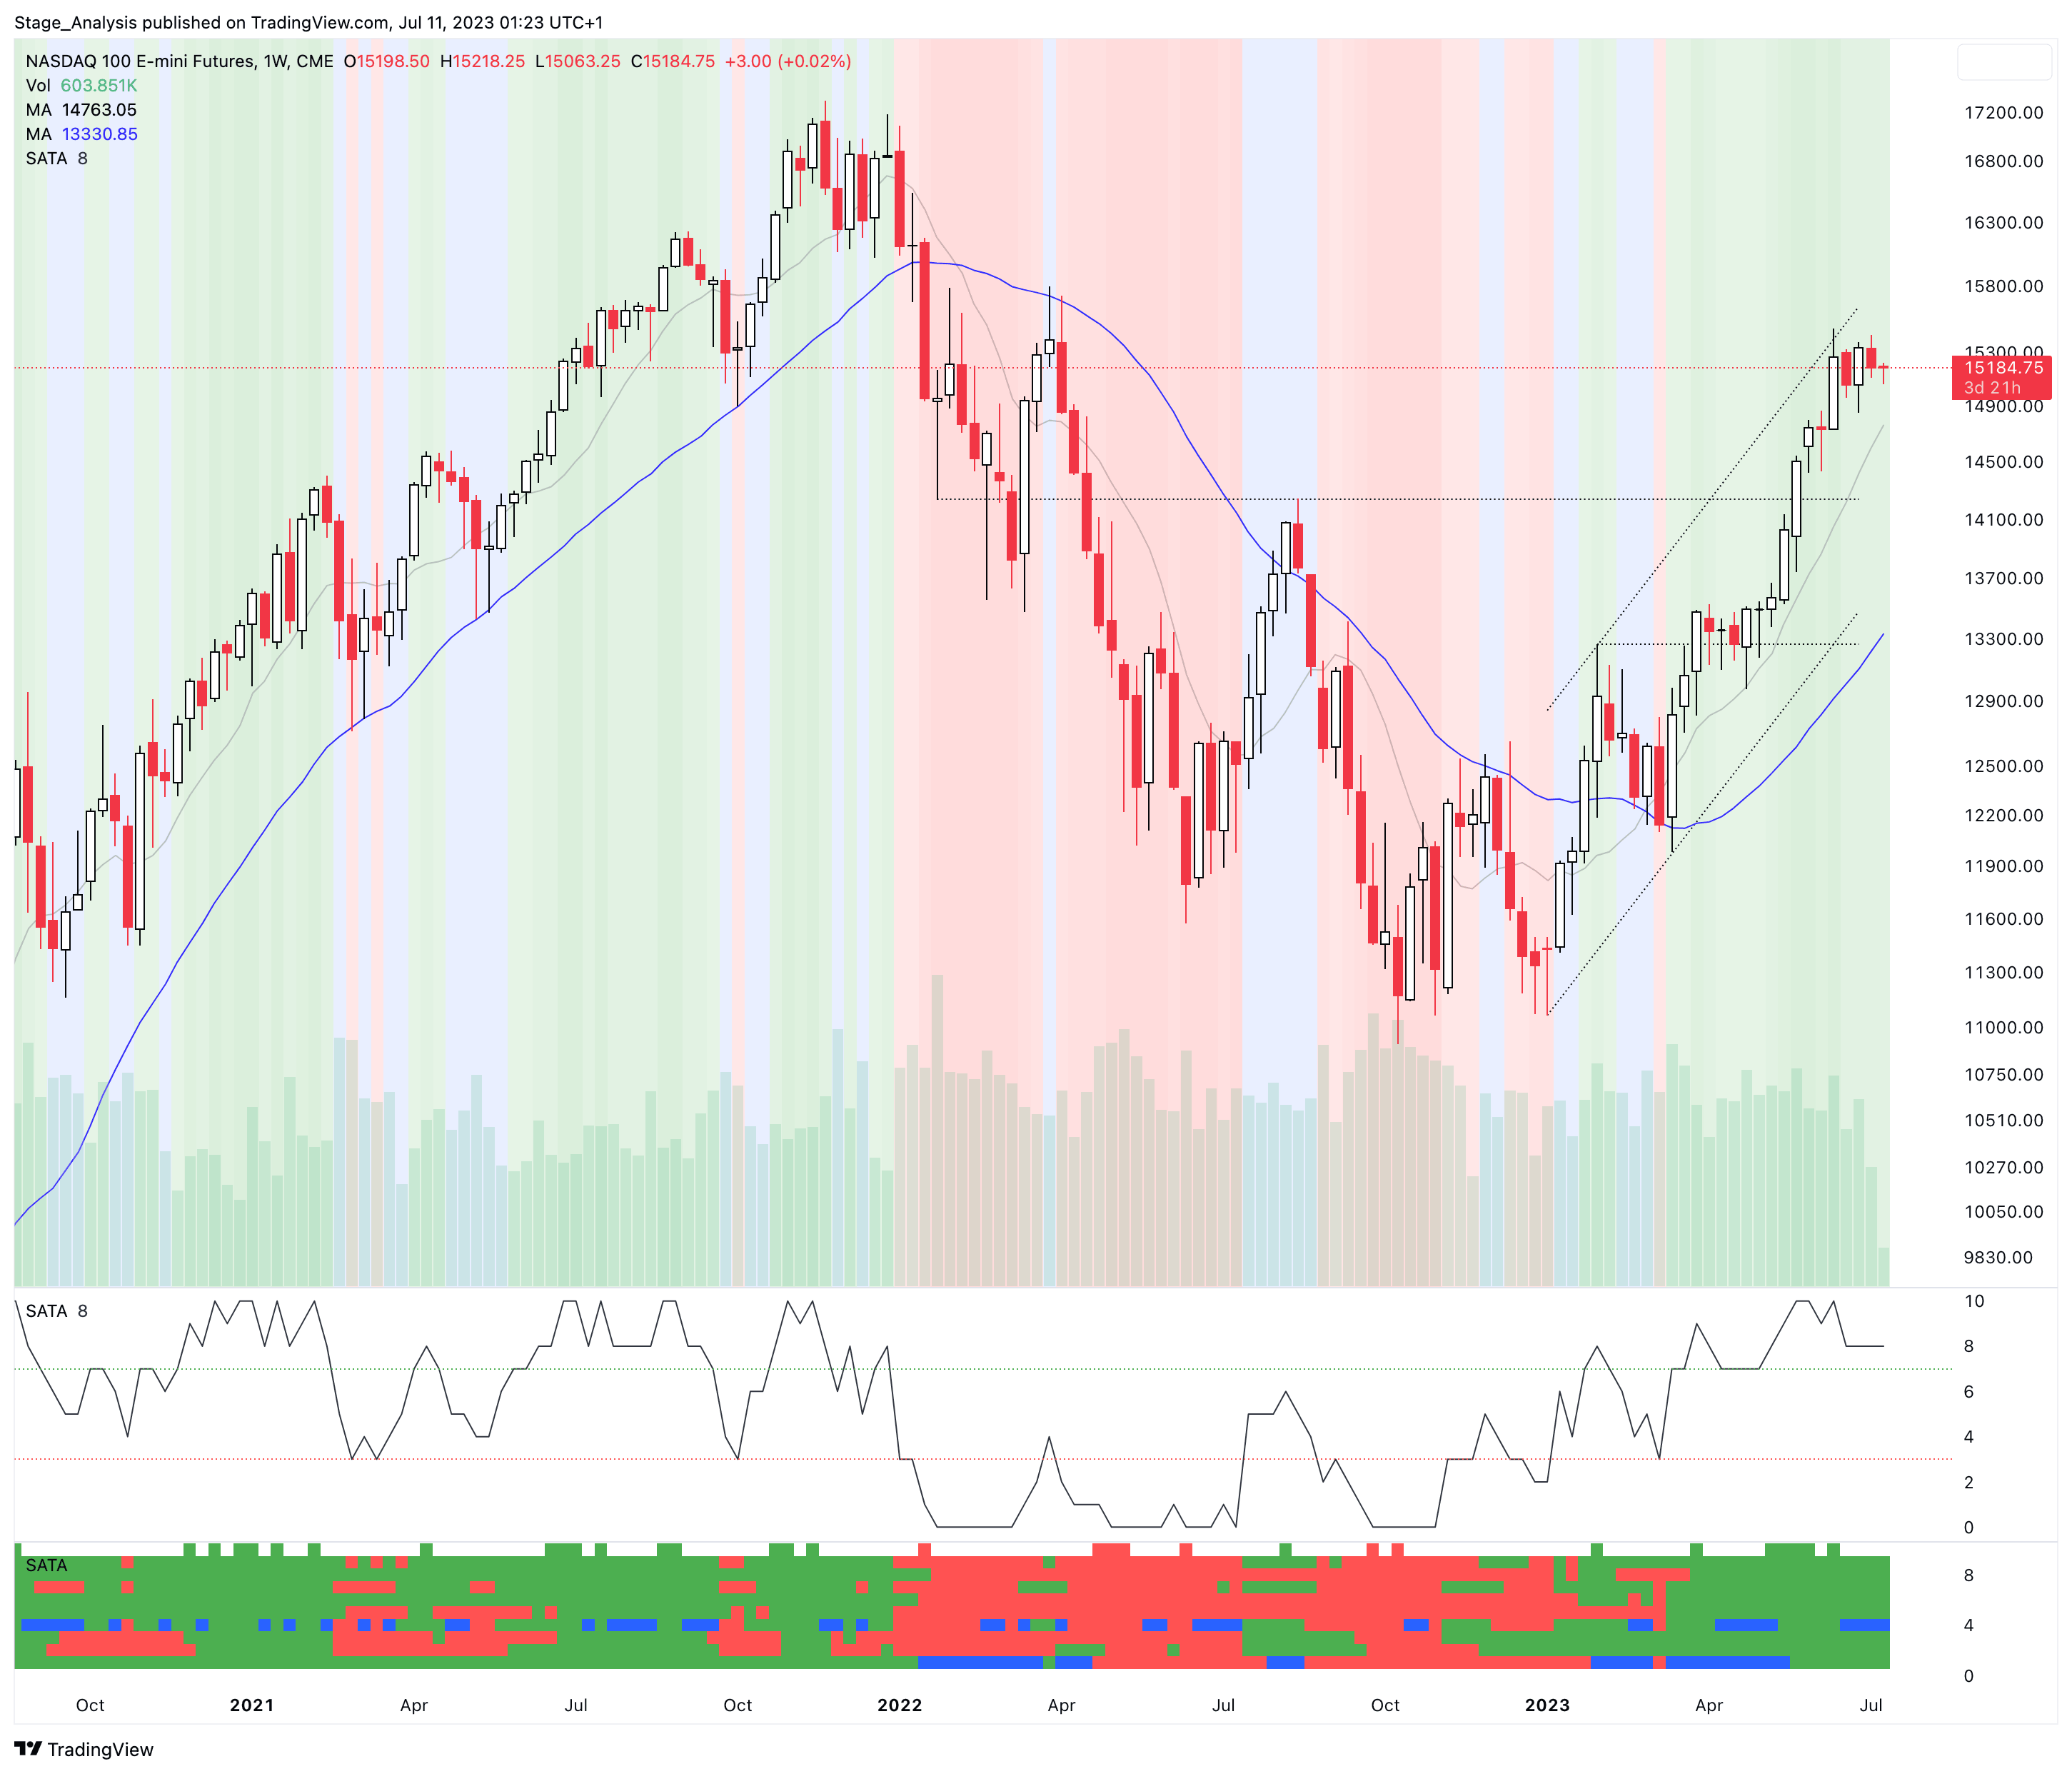
We last covered the weekly SATA scores for the Nasdaq 100 back on 10th April (three weeks after the Stage 2 breakout), which gives a rough guide of the Stages of the individual stocks within the Nasdaq 100. i.e. everything above a 7 would be considered in the Stage 2 zone (Strong), 4-6 in the Stage 1 or Stage 3 zone (Neutral), and 3 or below is the Stage 4 zone (Weak).
Currently the Nasdaq 100 consists of:
- 56% Stage 2 zone (Strong)
- 22% Stage 1 or Stage 3 zone (Neutral)
- 22% Stage 4 zone (Weak)
Nasdaq 100 weekly SATA Score: 8 (Strong), daily SATA Score: 5 (Neutral)
Percentage of stocks with a technically healthy SATA Score (6+): 66%
Compared to the 10th April post there are +12% more stocks in the Stage 2 zone, -6% less stocks in the Stage 1 or Stage 3 zone, and -6% less stocks in the Stage 4 zone, and so the weighting has continued to shift to the positive side of the bell curve, with more than double the amount of stocks in Stage 2 now than Stage 4 in the Nasdaq 100.
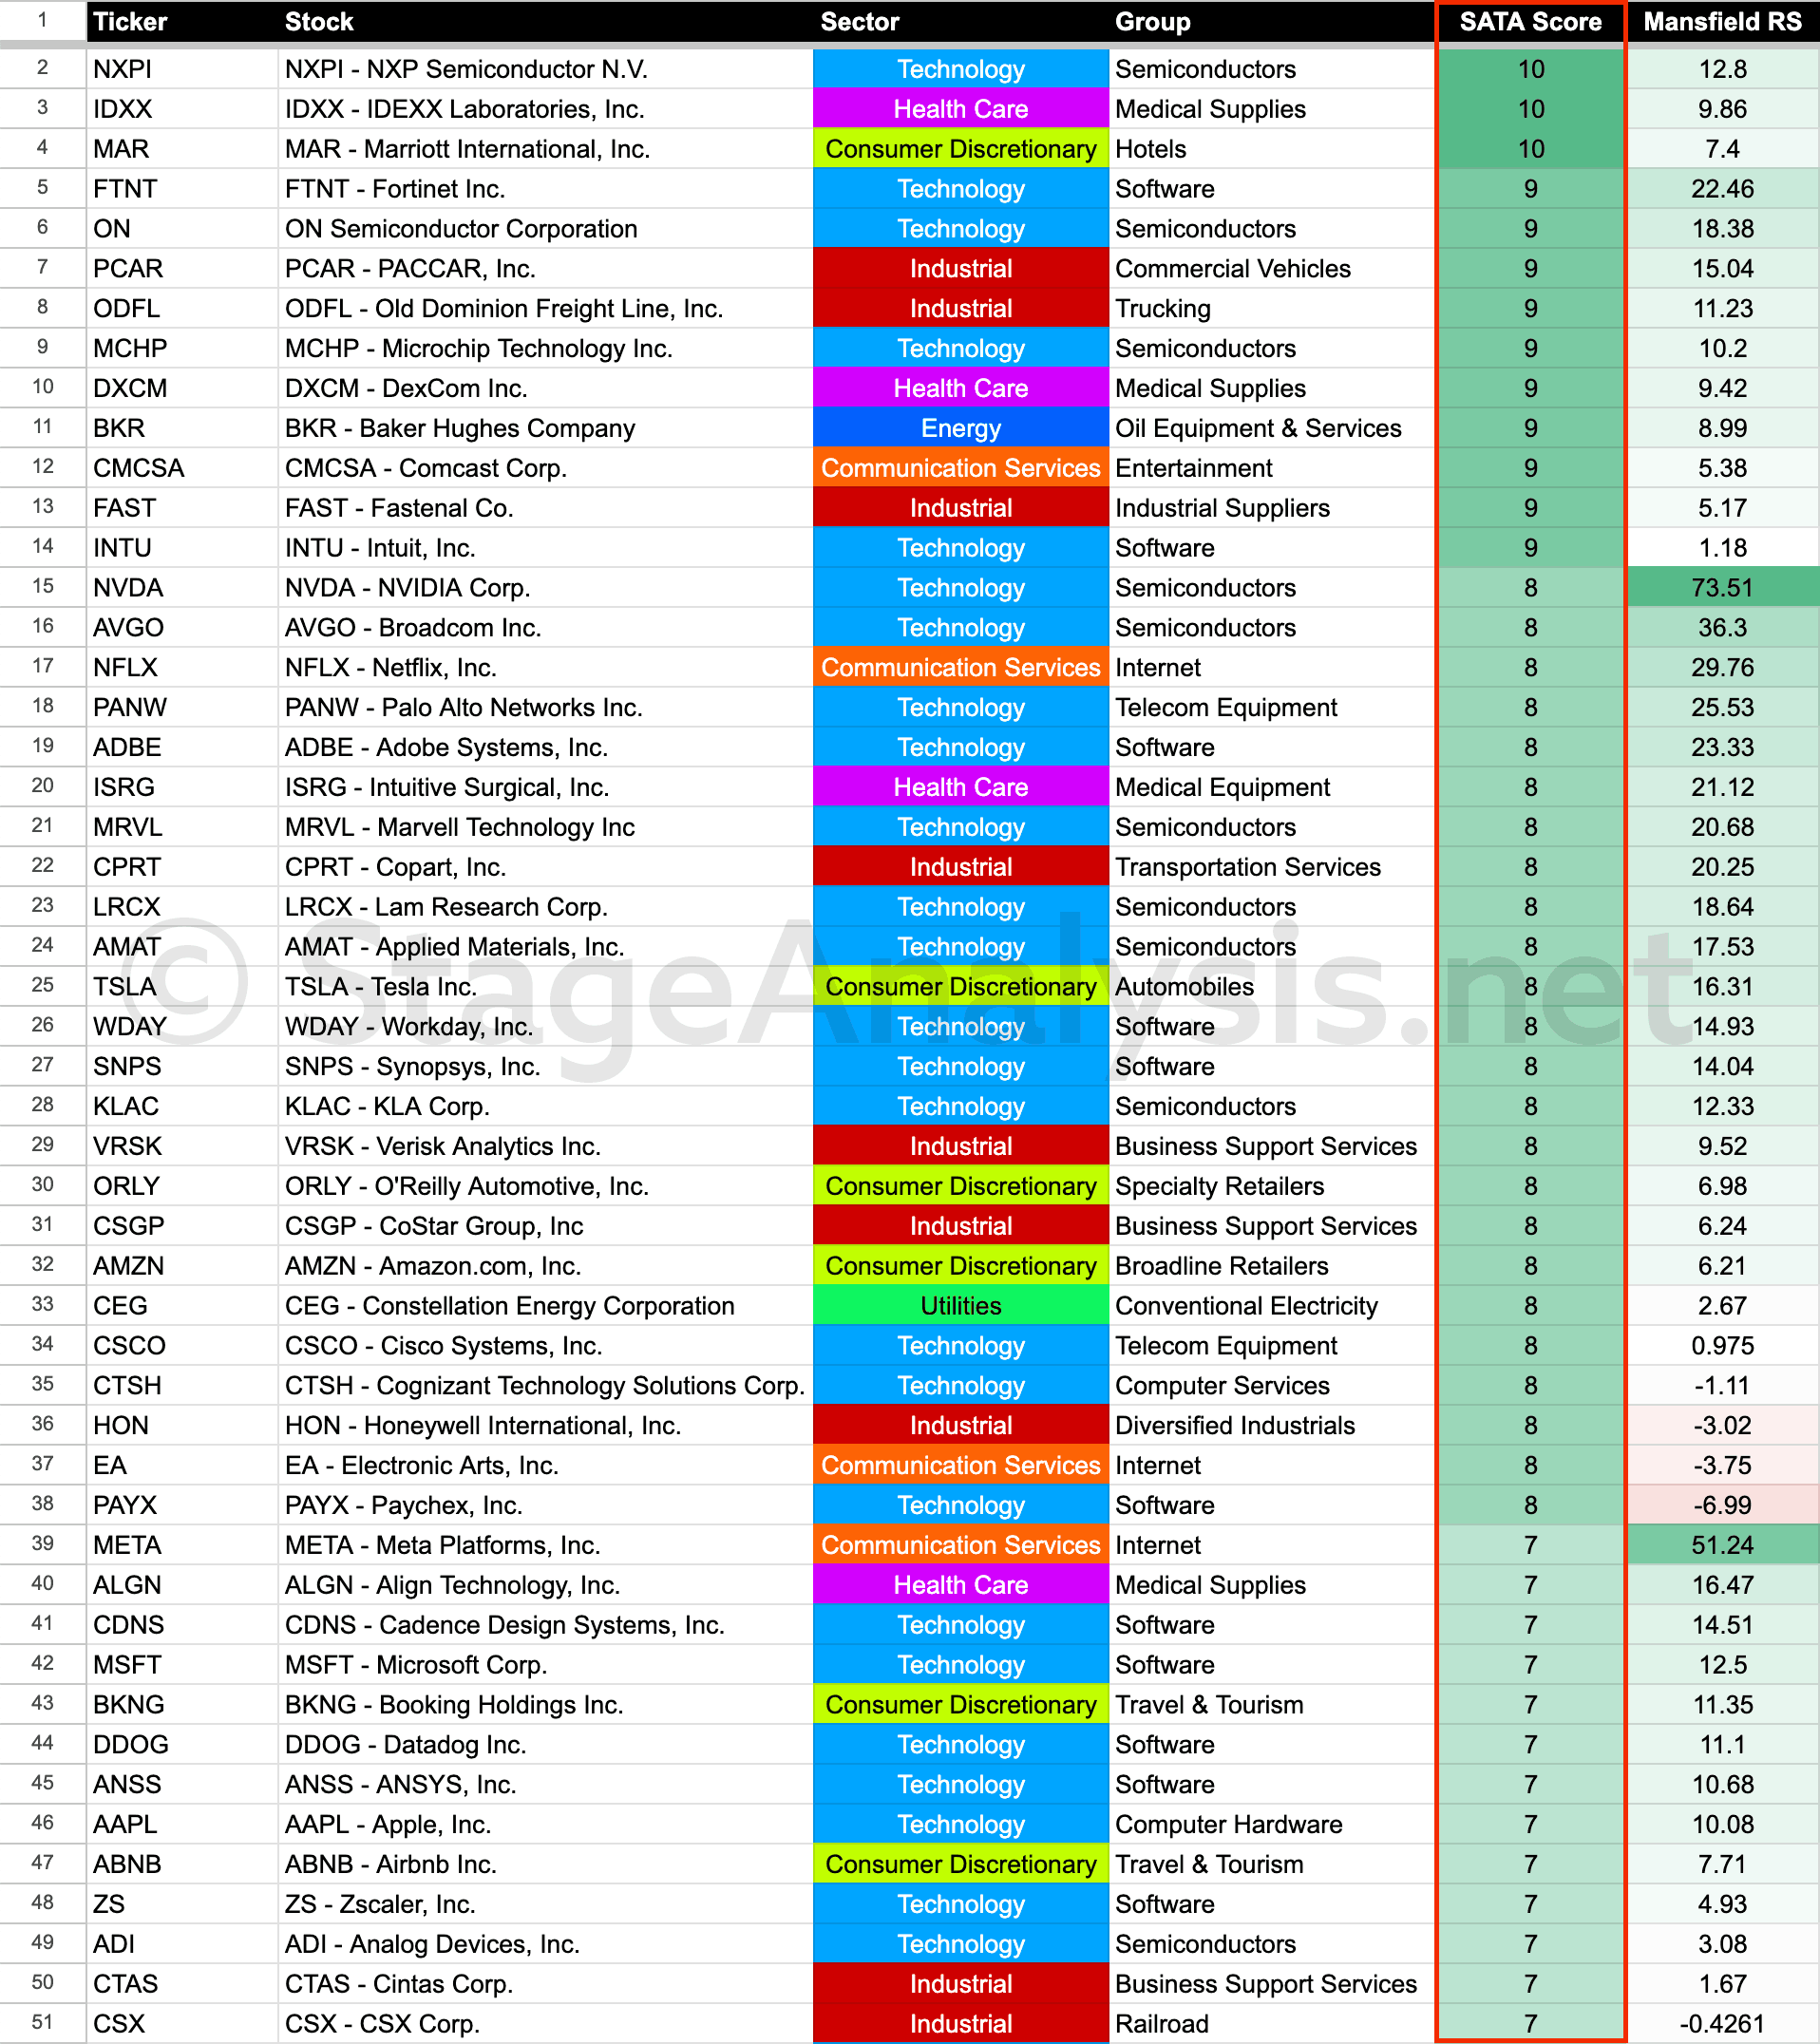
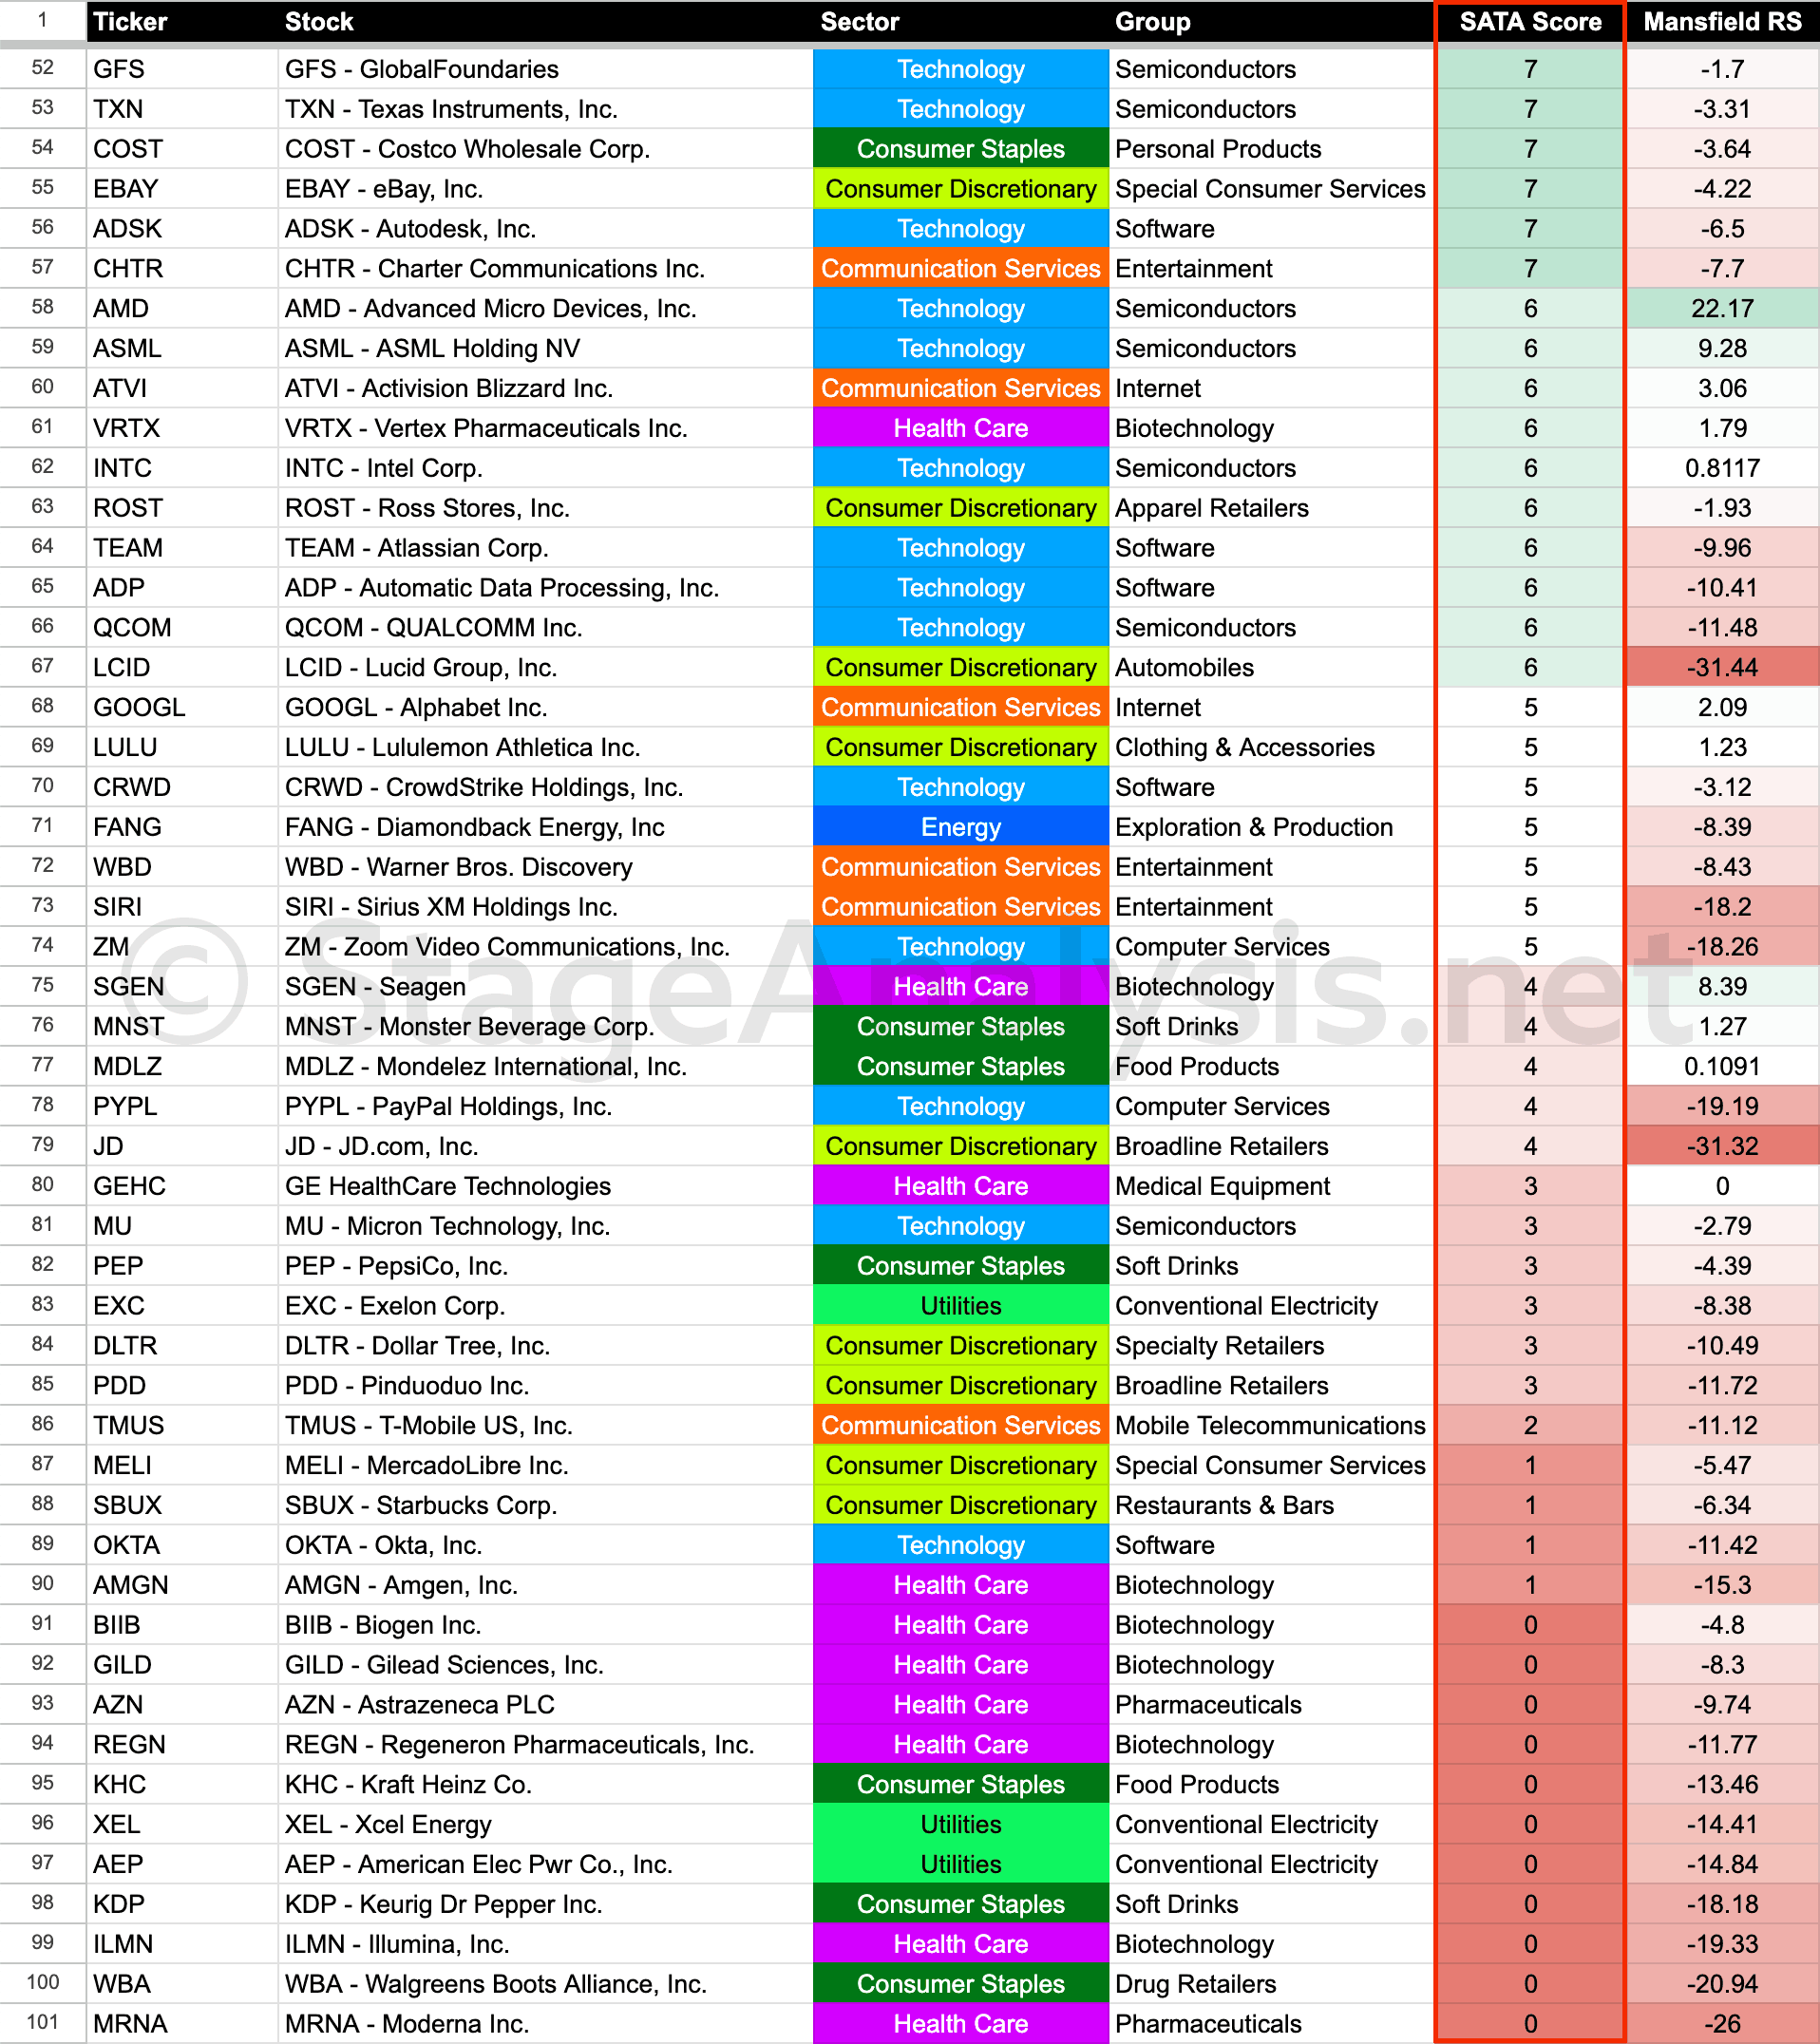
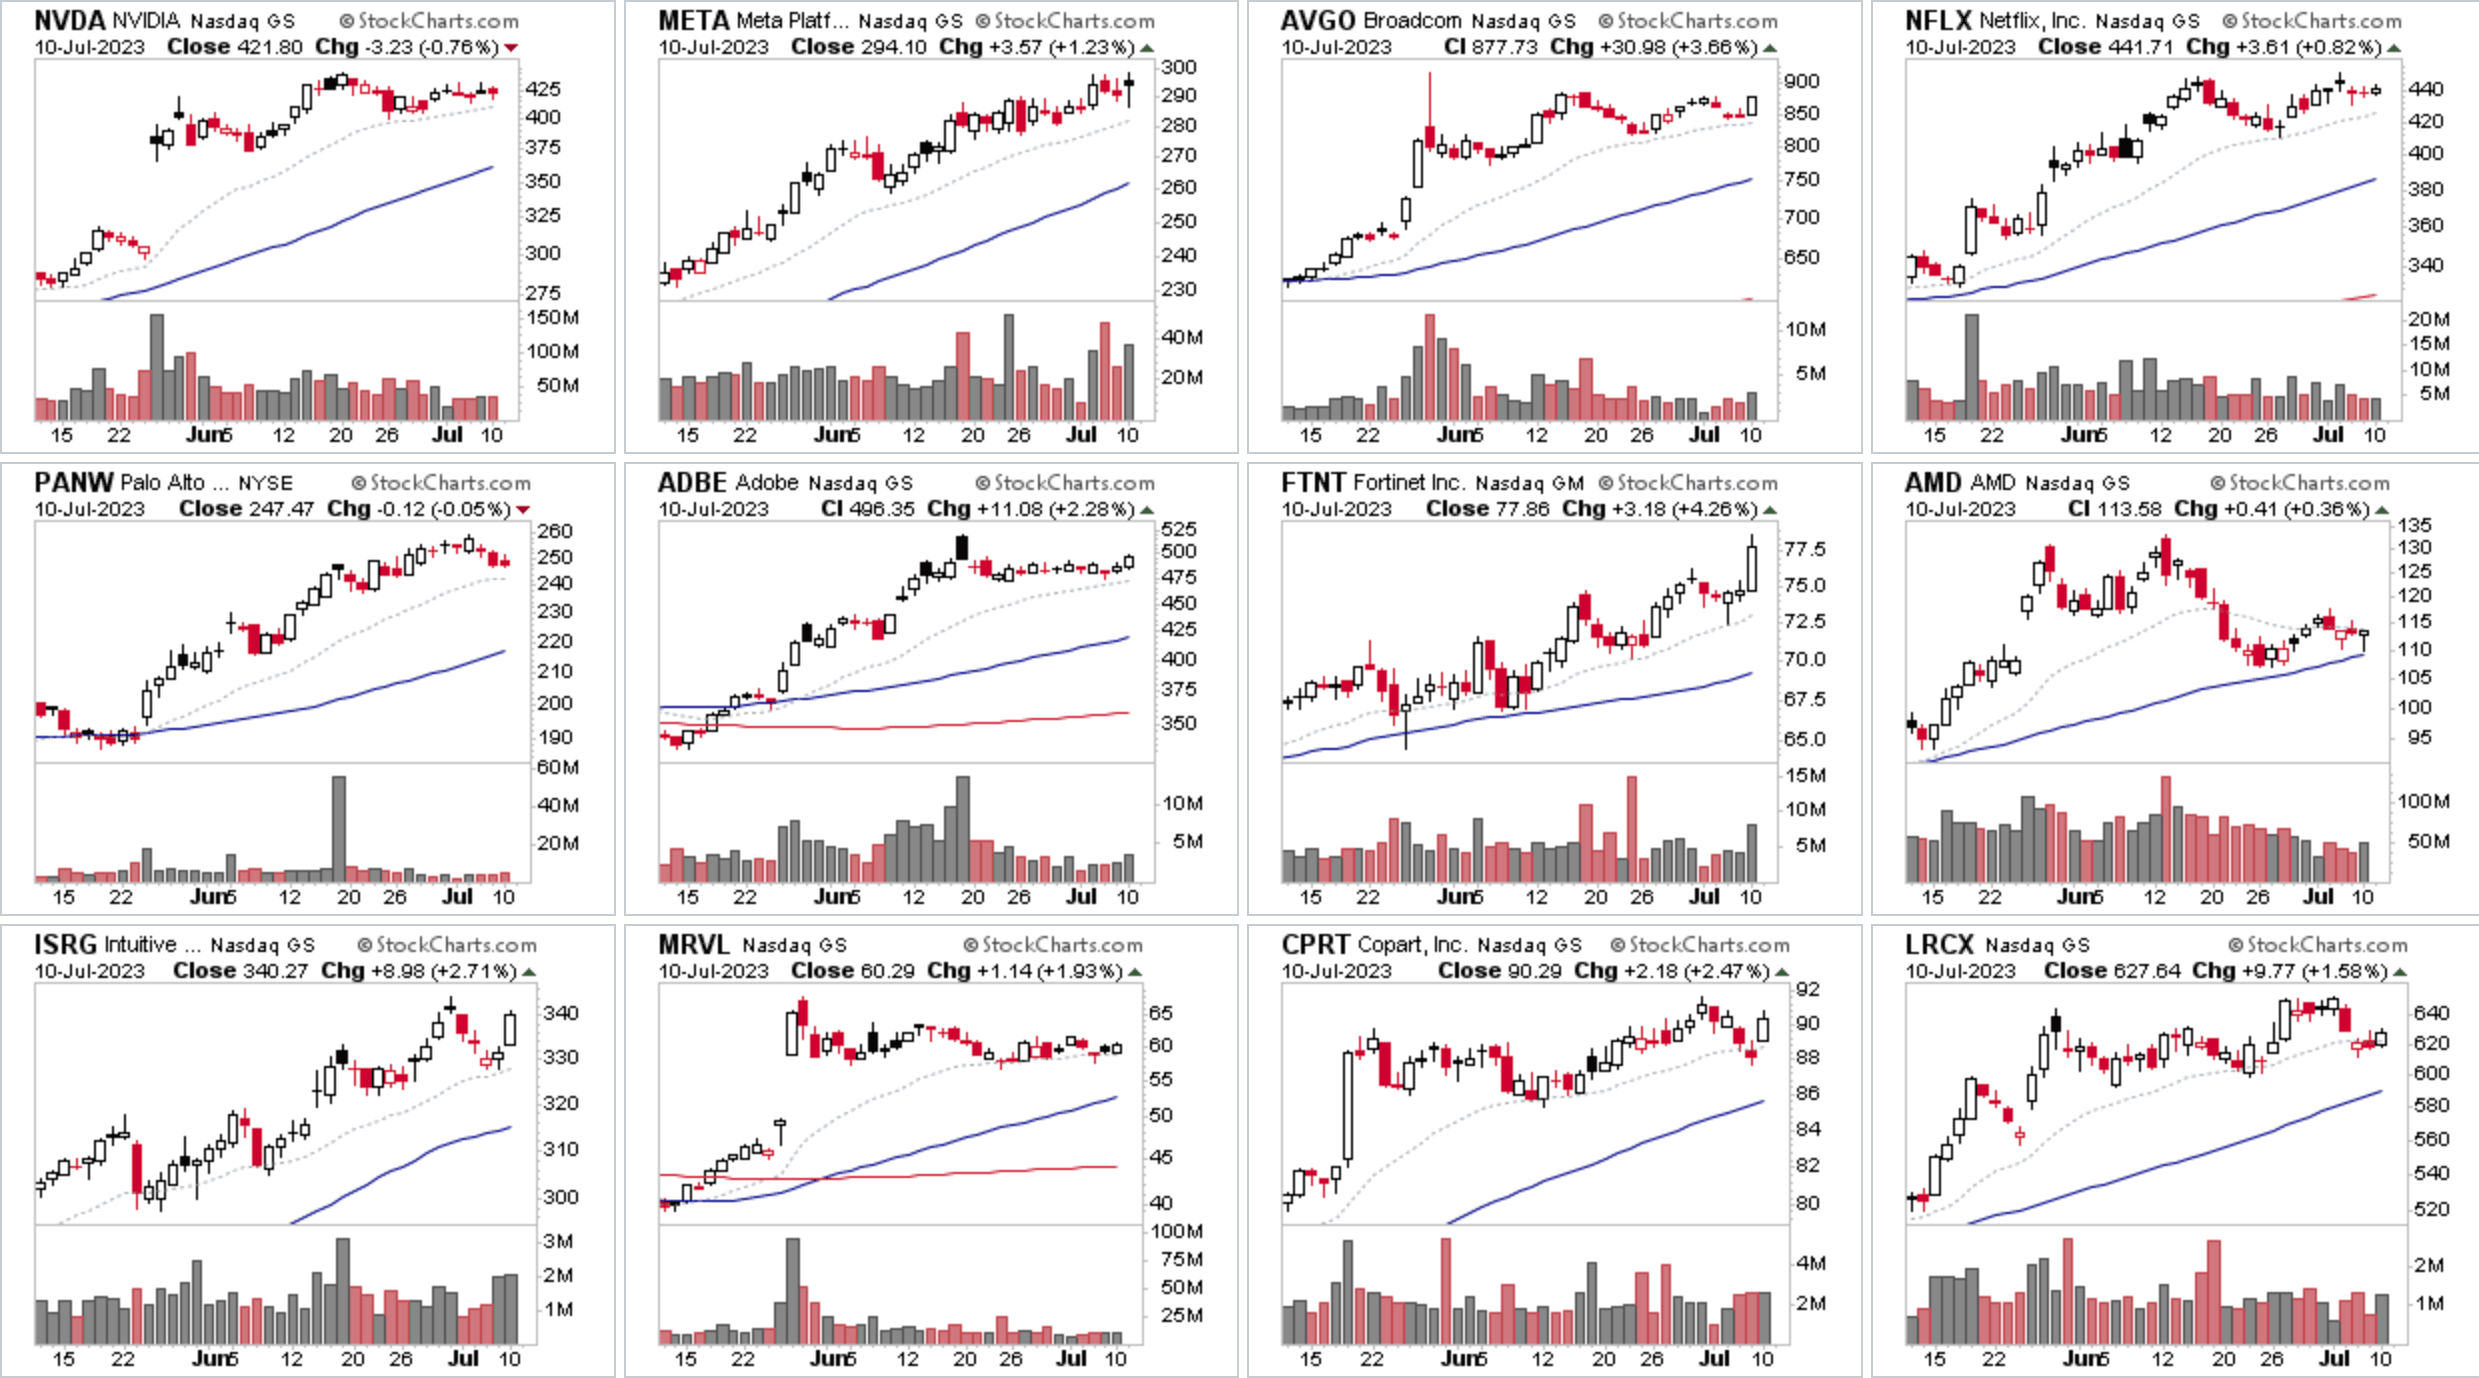
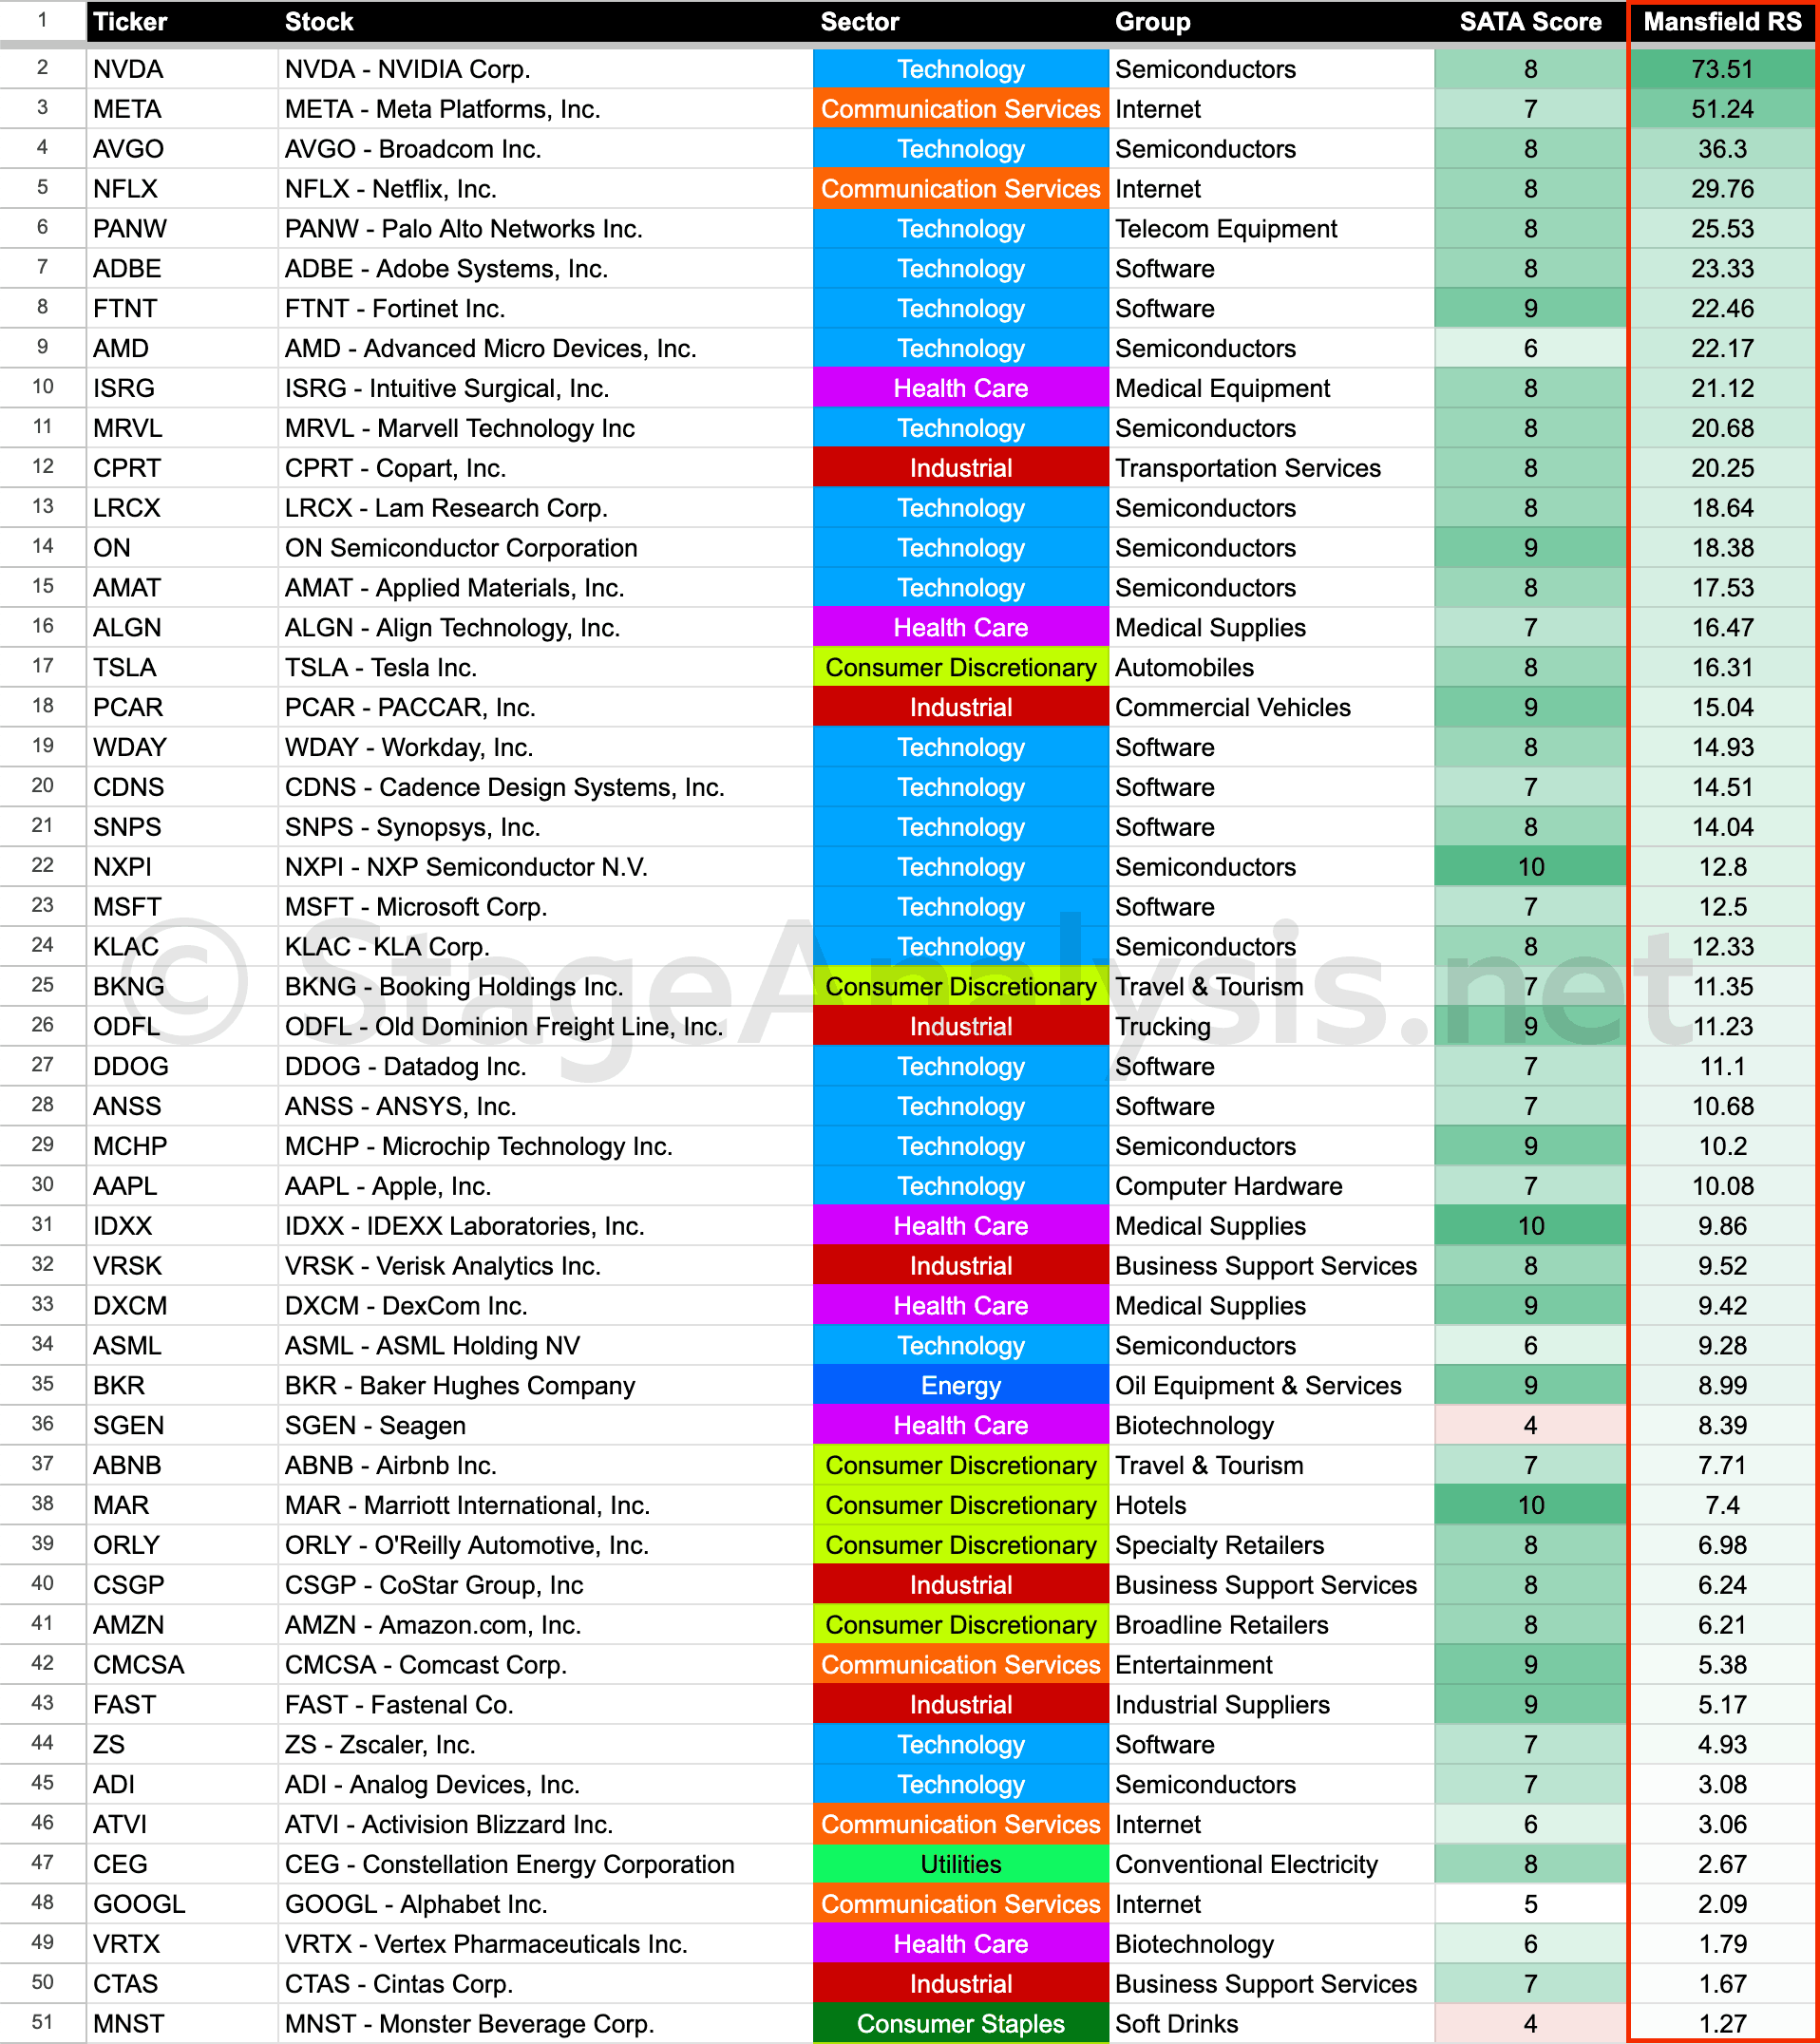
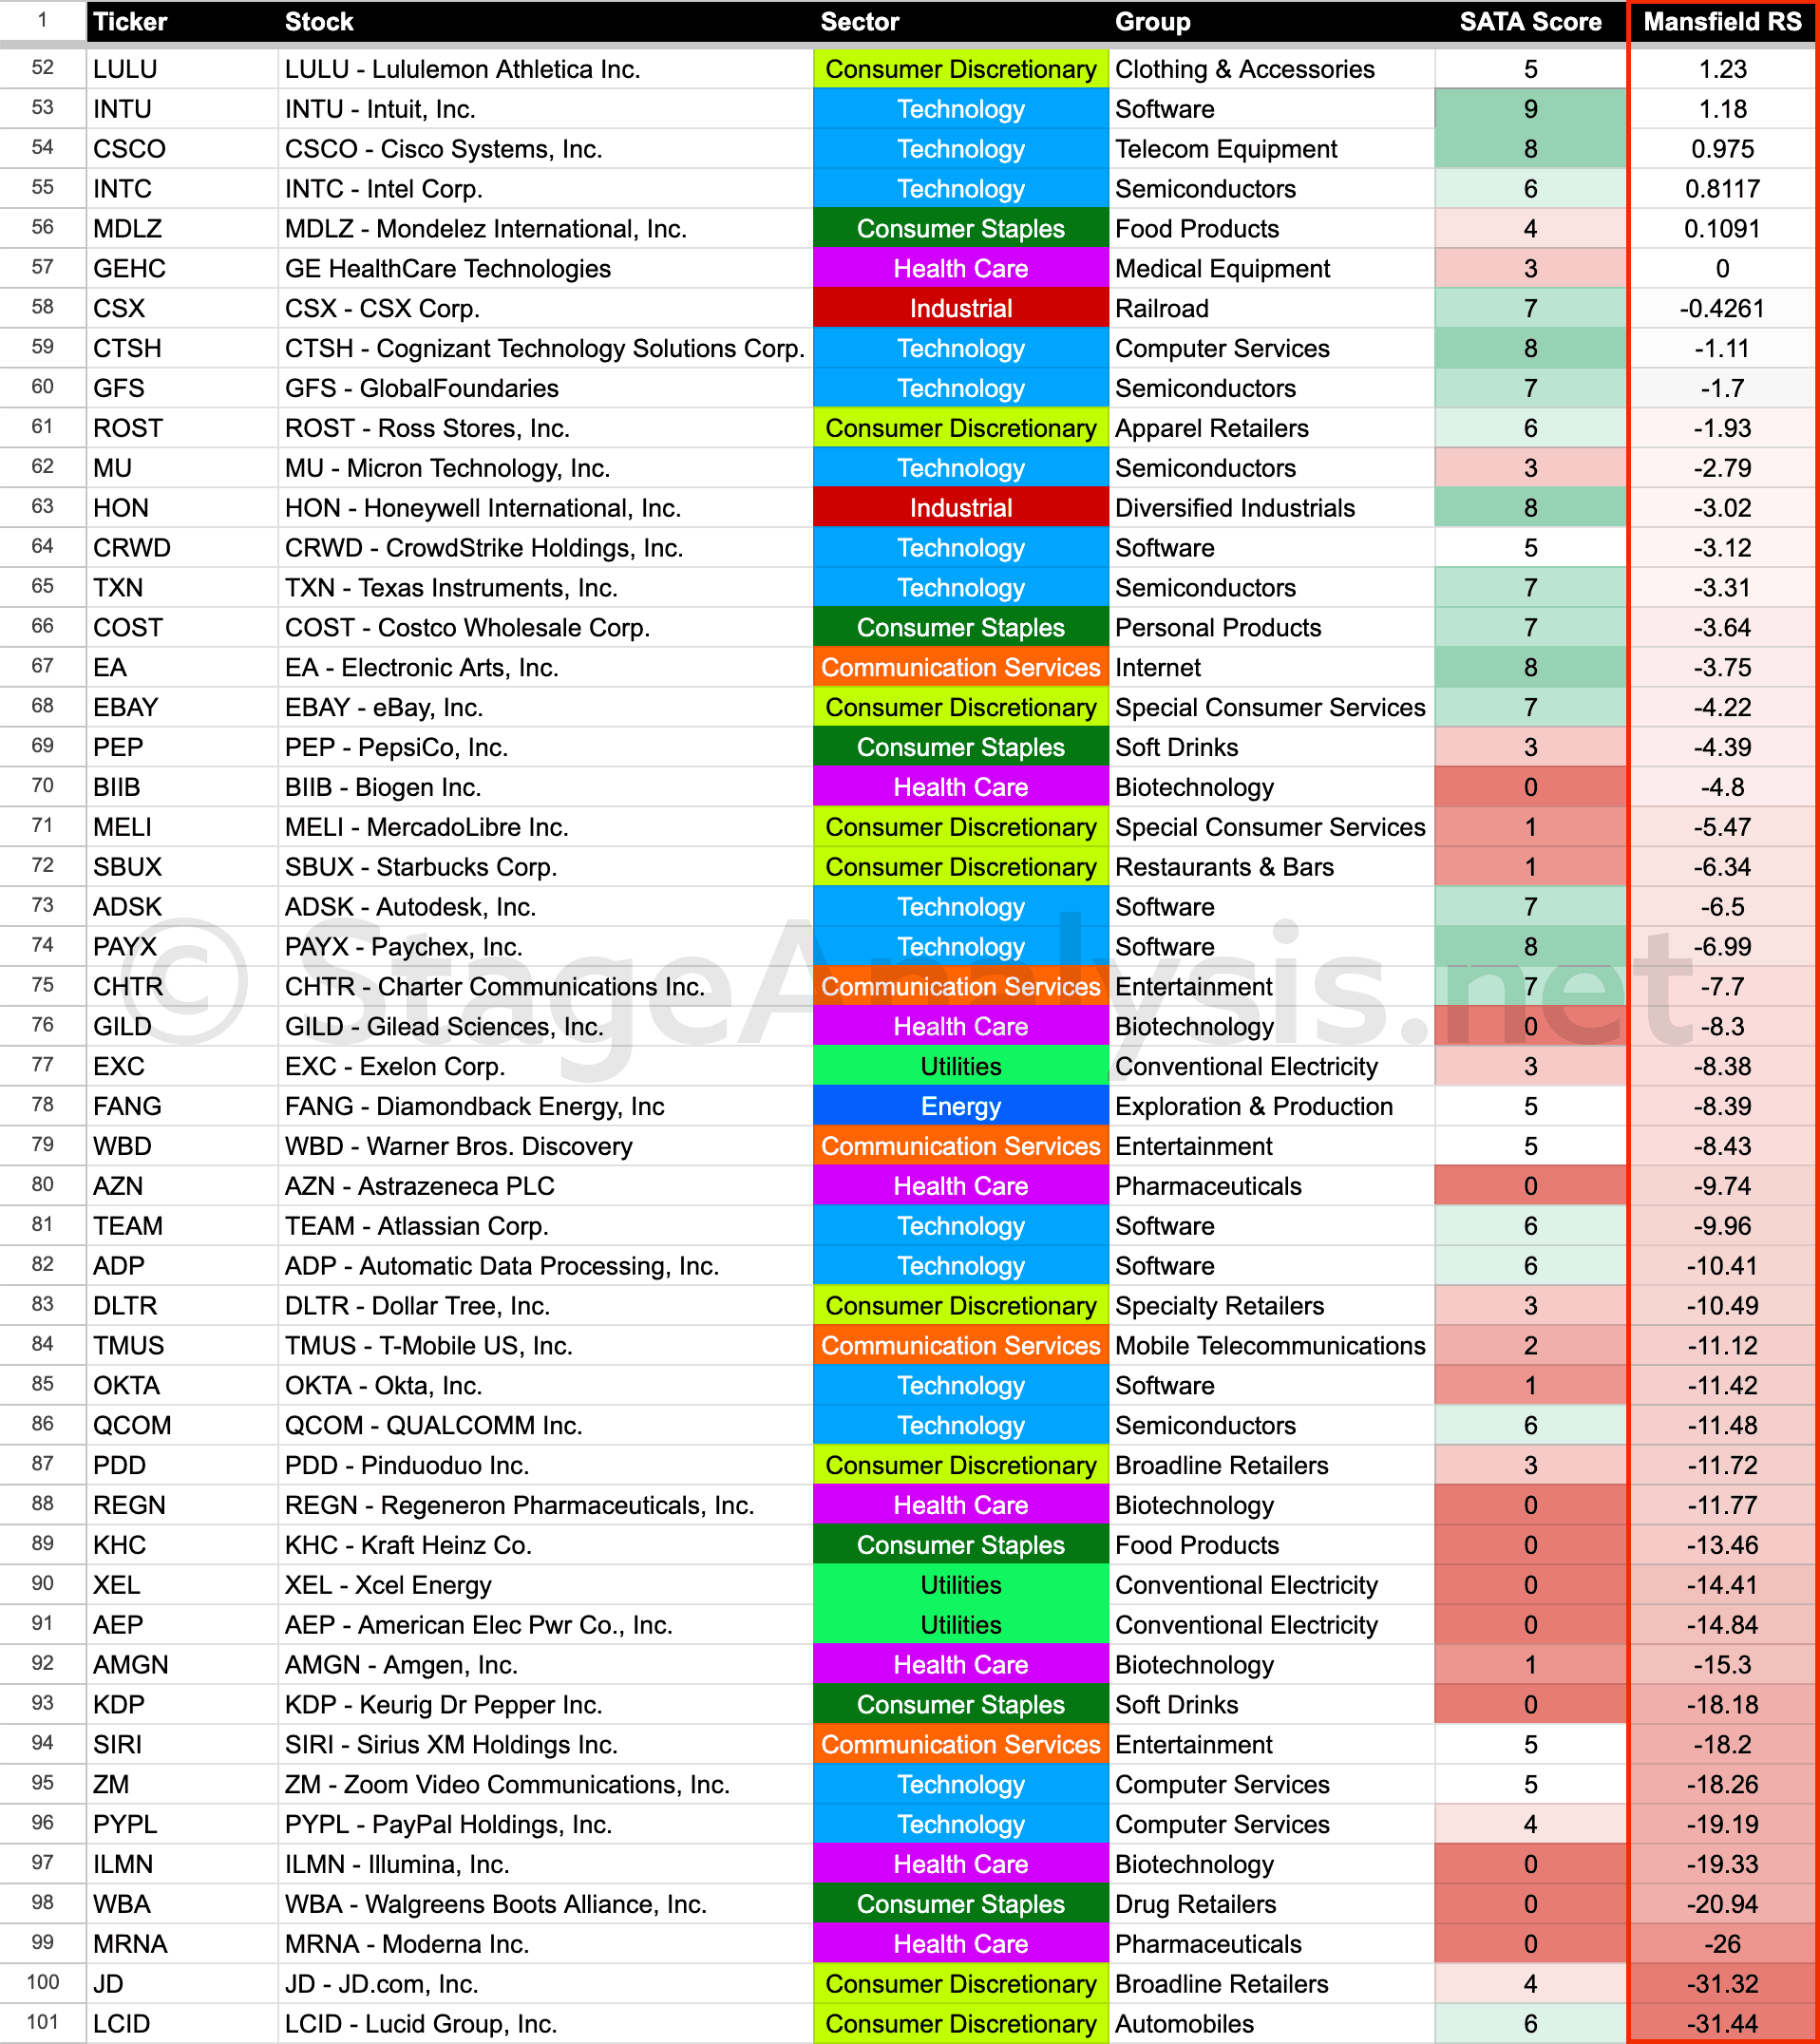
Below is the data tables of the Nasdaq 100 stocks in order of SATA Score and Mansfield Relative Strength, which gives slightly different perspectives of the data.
Ordered by Highest SATA Score
Ordered by Mansfield Relative Strength (RS) Score
Coming Soon – SATA Scores on the Website
We have been continuing to work hard since the start of the year developing a new tool for the website, so that we can hopefully make the SATA scores available for the whole US market on the Stage Analysis website, and in time potentially other markets too. Which will give Stage Analysis members the ability to see the SATA scores and changes on a daily basis and then make use of that information.
There's multiple ways that this data could be useful on both the long and short side of the market and also as market breadth data and charts. So we are excited to get it up and running on the website. So stay tuned for more info about it the coming months.
Become a Stage Analysis Member:
To see more like this – US Stocks watchlist posts, detailed videos each weekend, use our unique Stage Analysis tools, such as the US Stocks & ETFs Screener, Charts, Market Breadth, Group Relative Strength and more...
Join Today
Disclaimer: For educational purpose only. Not investment advice. Seek professional advice from a financial advisor before making any investing decisions.