
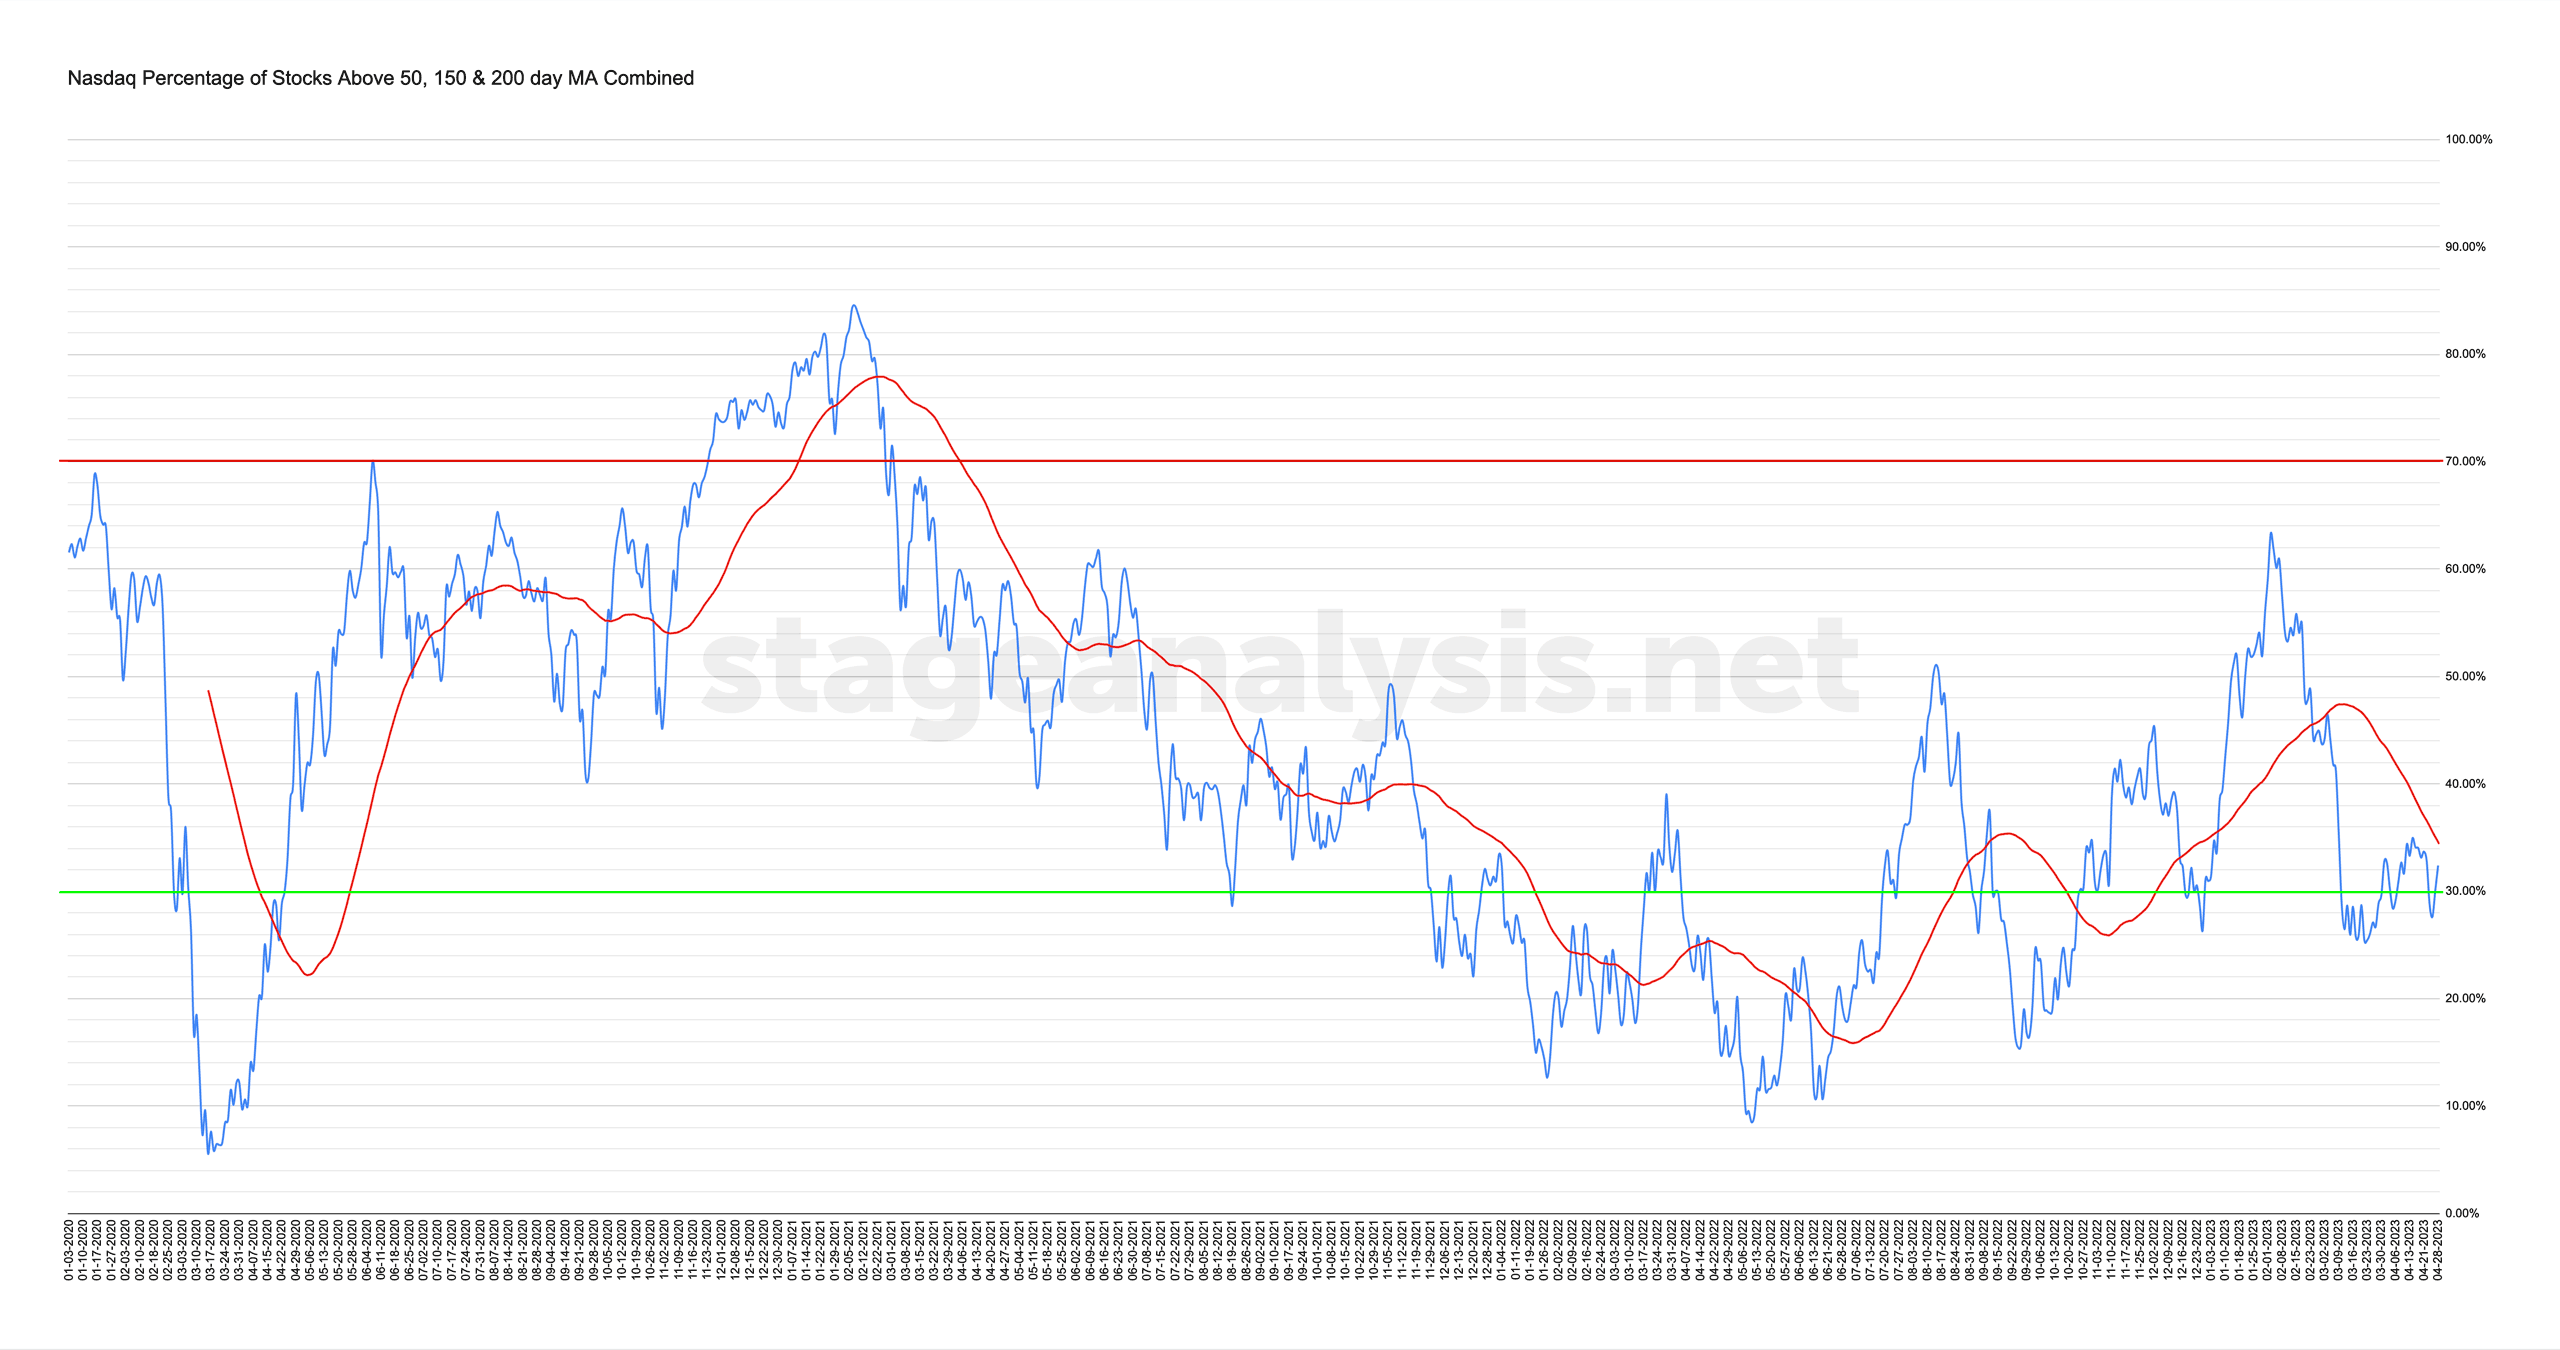
Market Breadth: Percentage of Stocks Above their 50 Day, 150 Day & 200 Day Moving Averages Combined
The full post is available to view by members only. For immediate access:
41.71% (-0.65% 1wk)
Status: Neutral Environment – Stage 1 zone
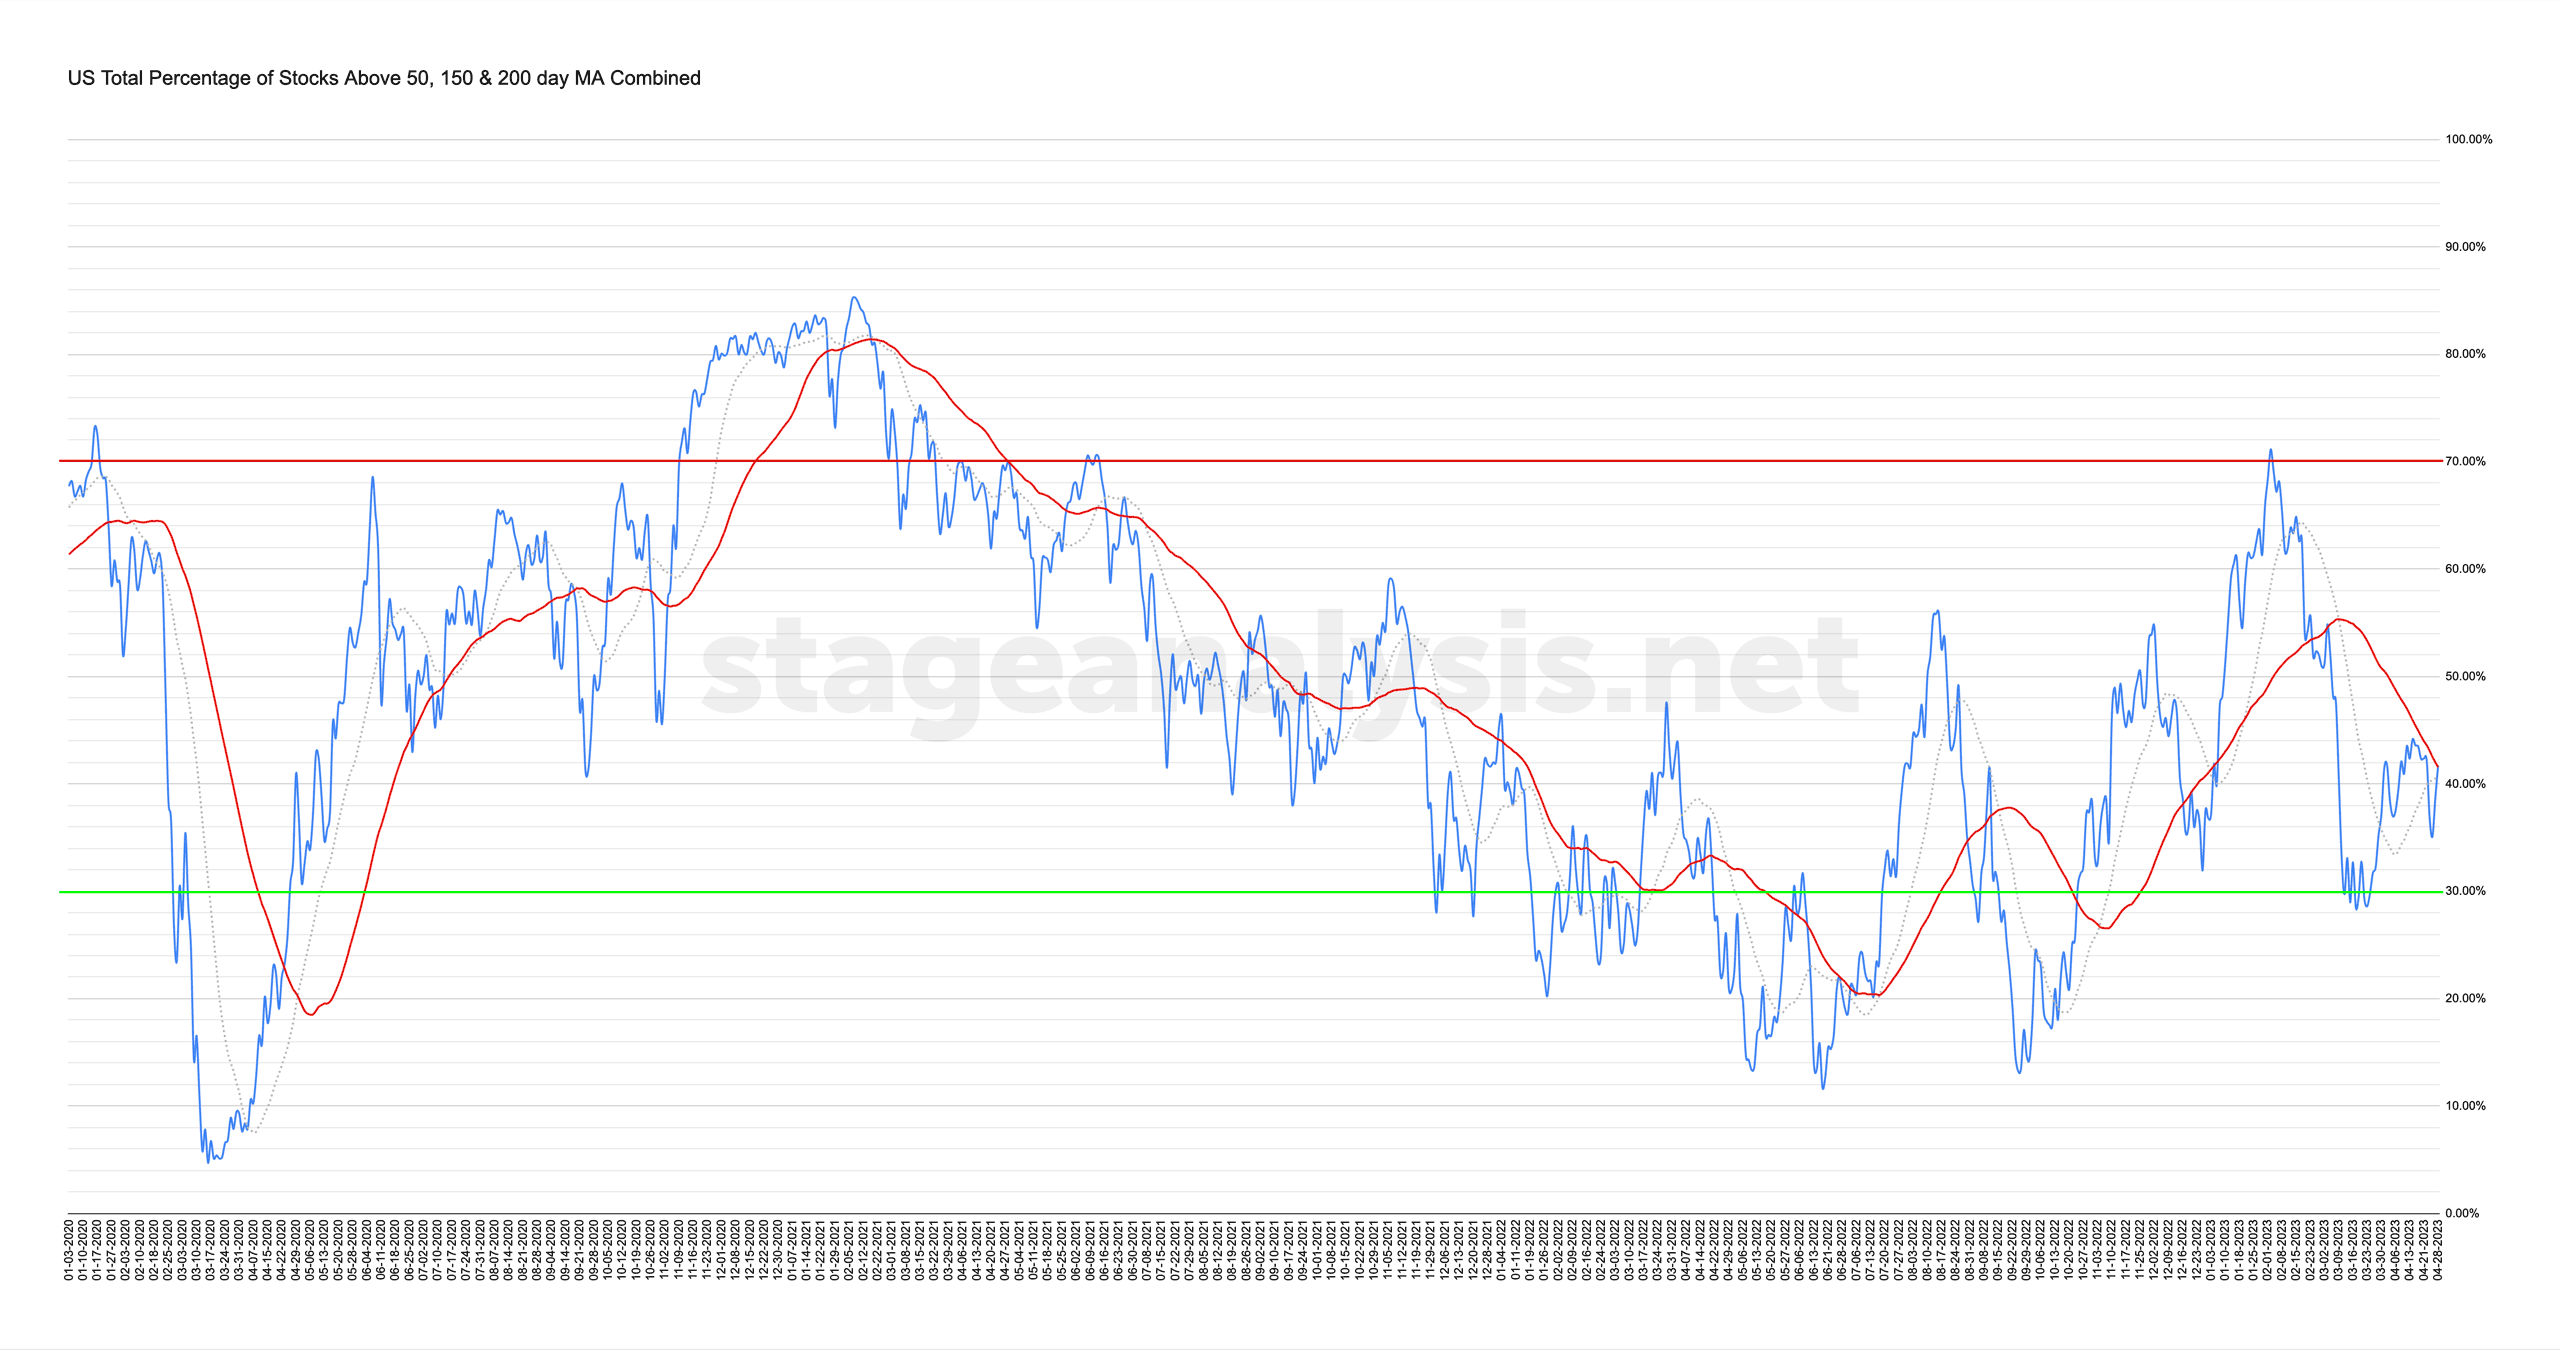
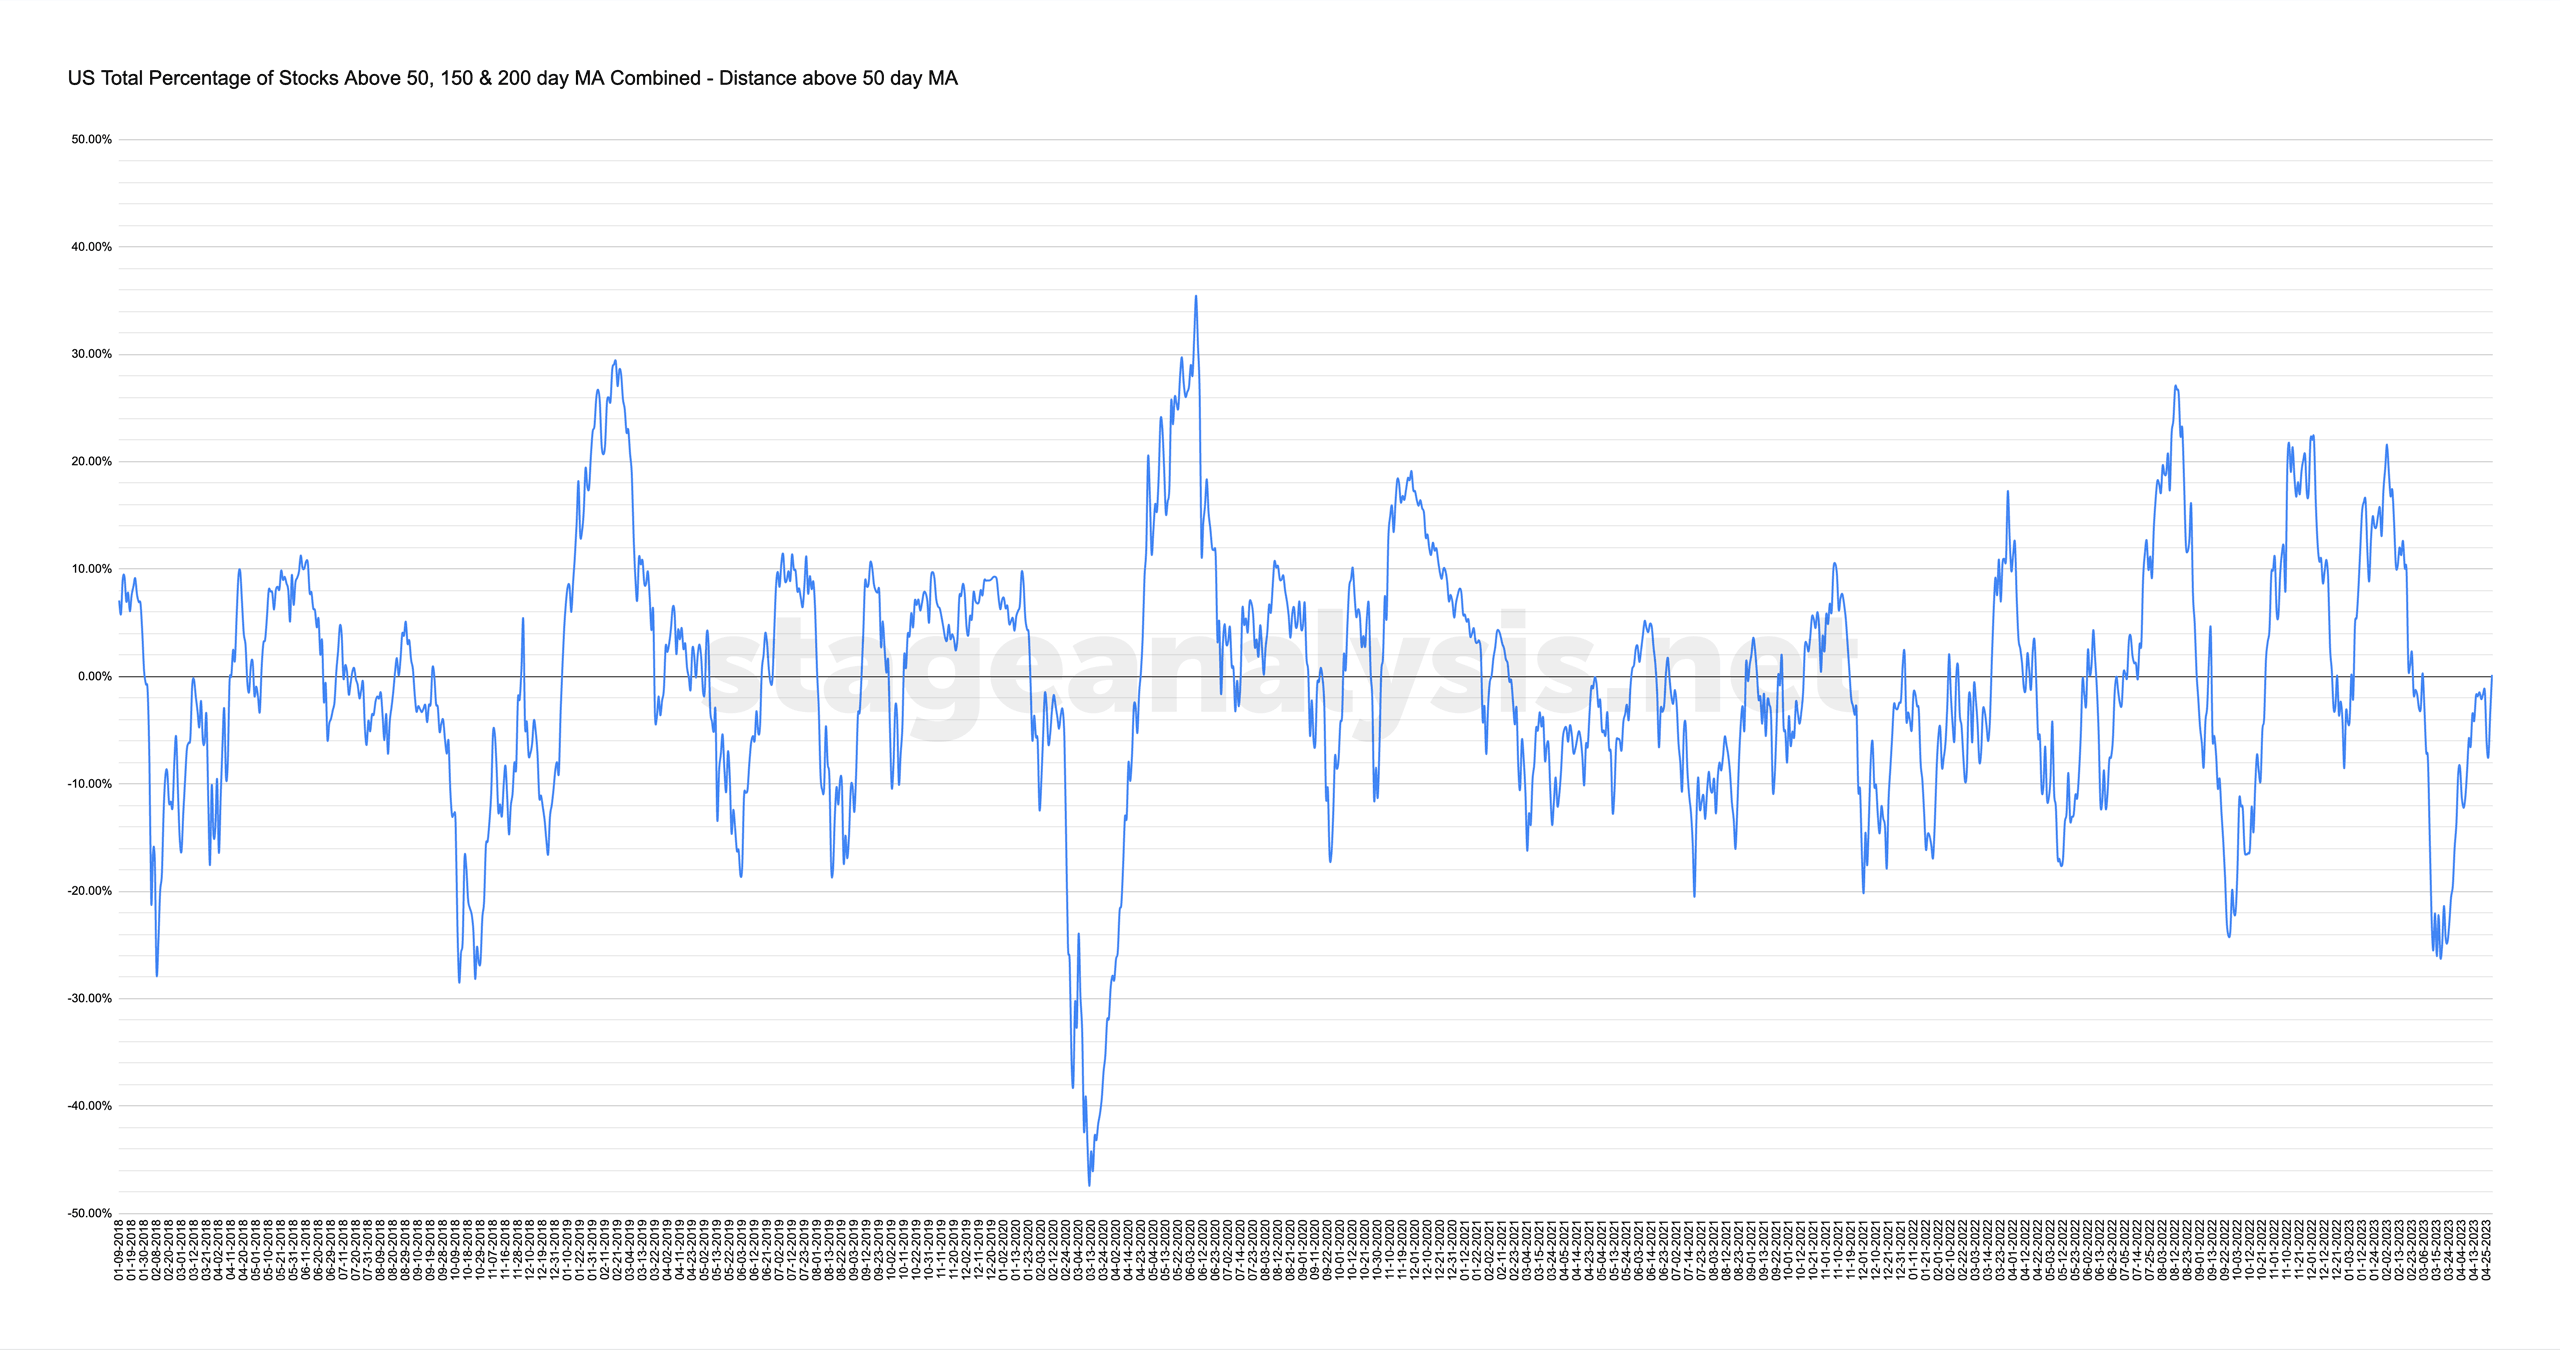
The US Total Percentage of Stocks above their 50 Day, 150 Day & 200 Day Moving Averages (shown above) declined by -0.65% this week. However, it did rebound strongly from a sharp drop during the week.
Therefore, the overall combined average is at 41.71% in the US market (NYSE and Nasdaq markets combined) above their short, medium and long term moving averages, which is in lower-middle zone.
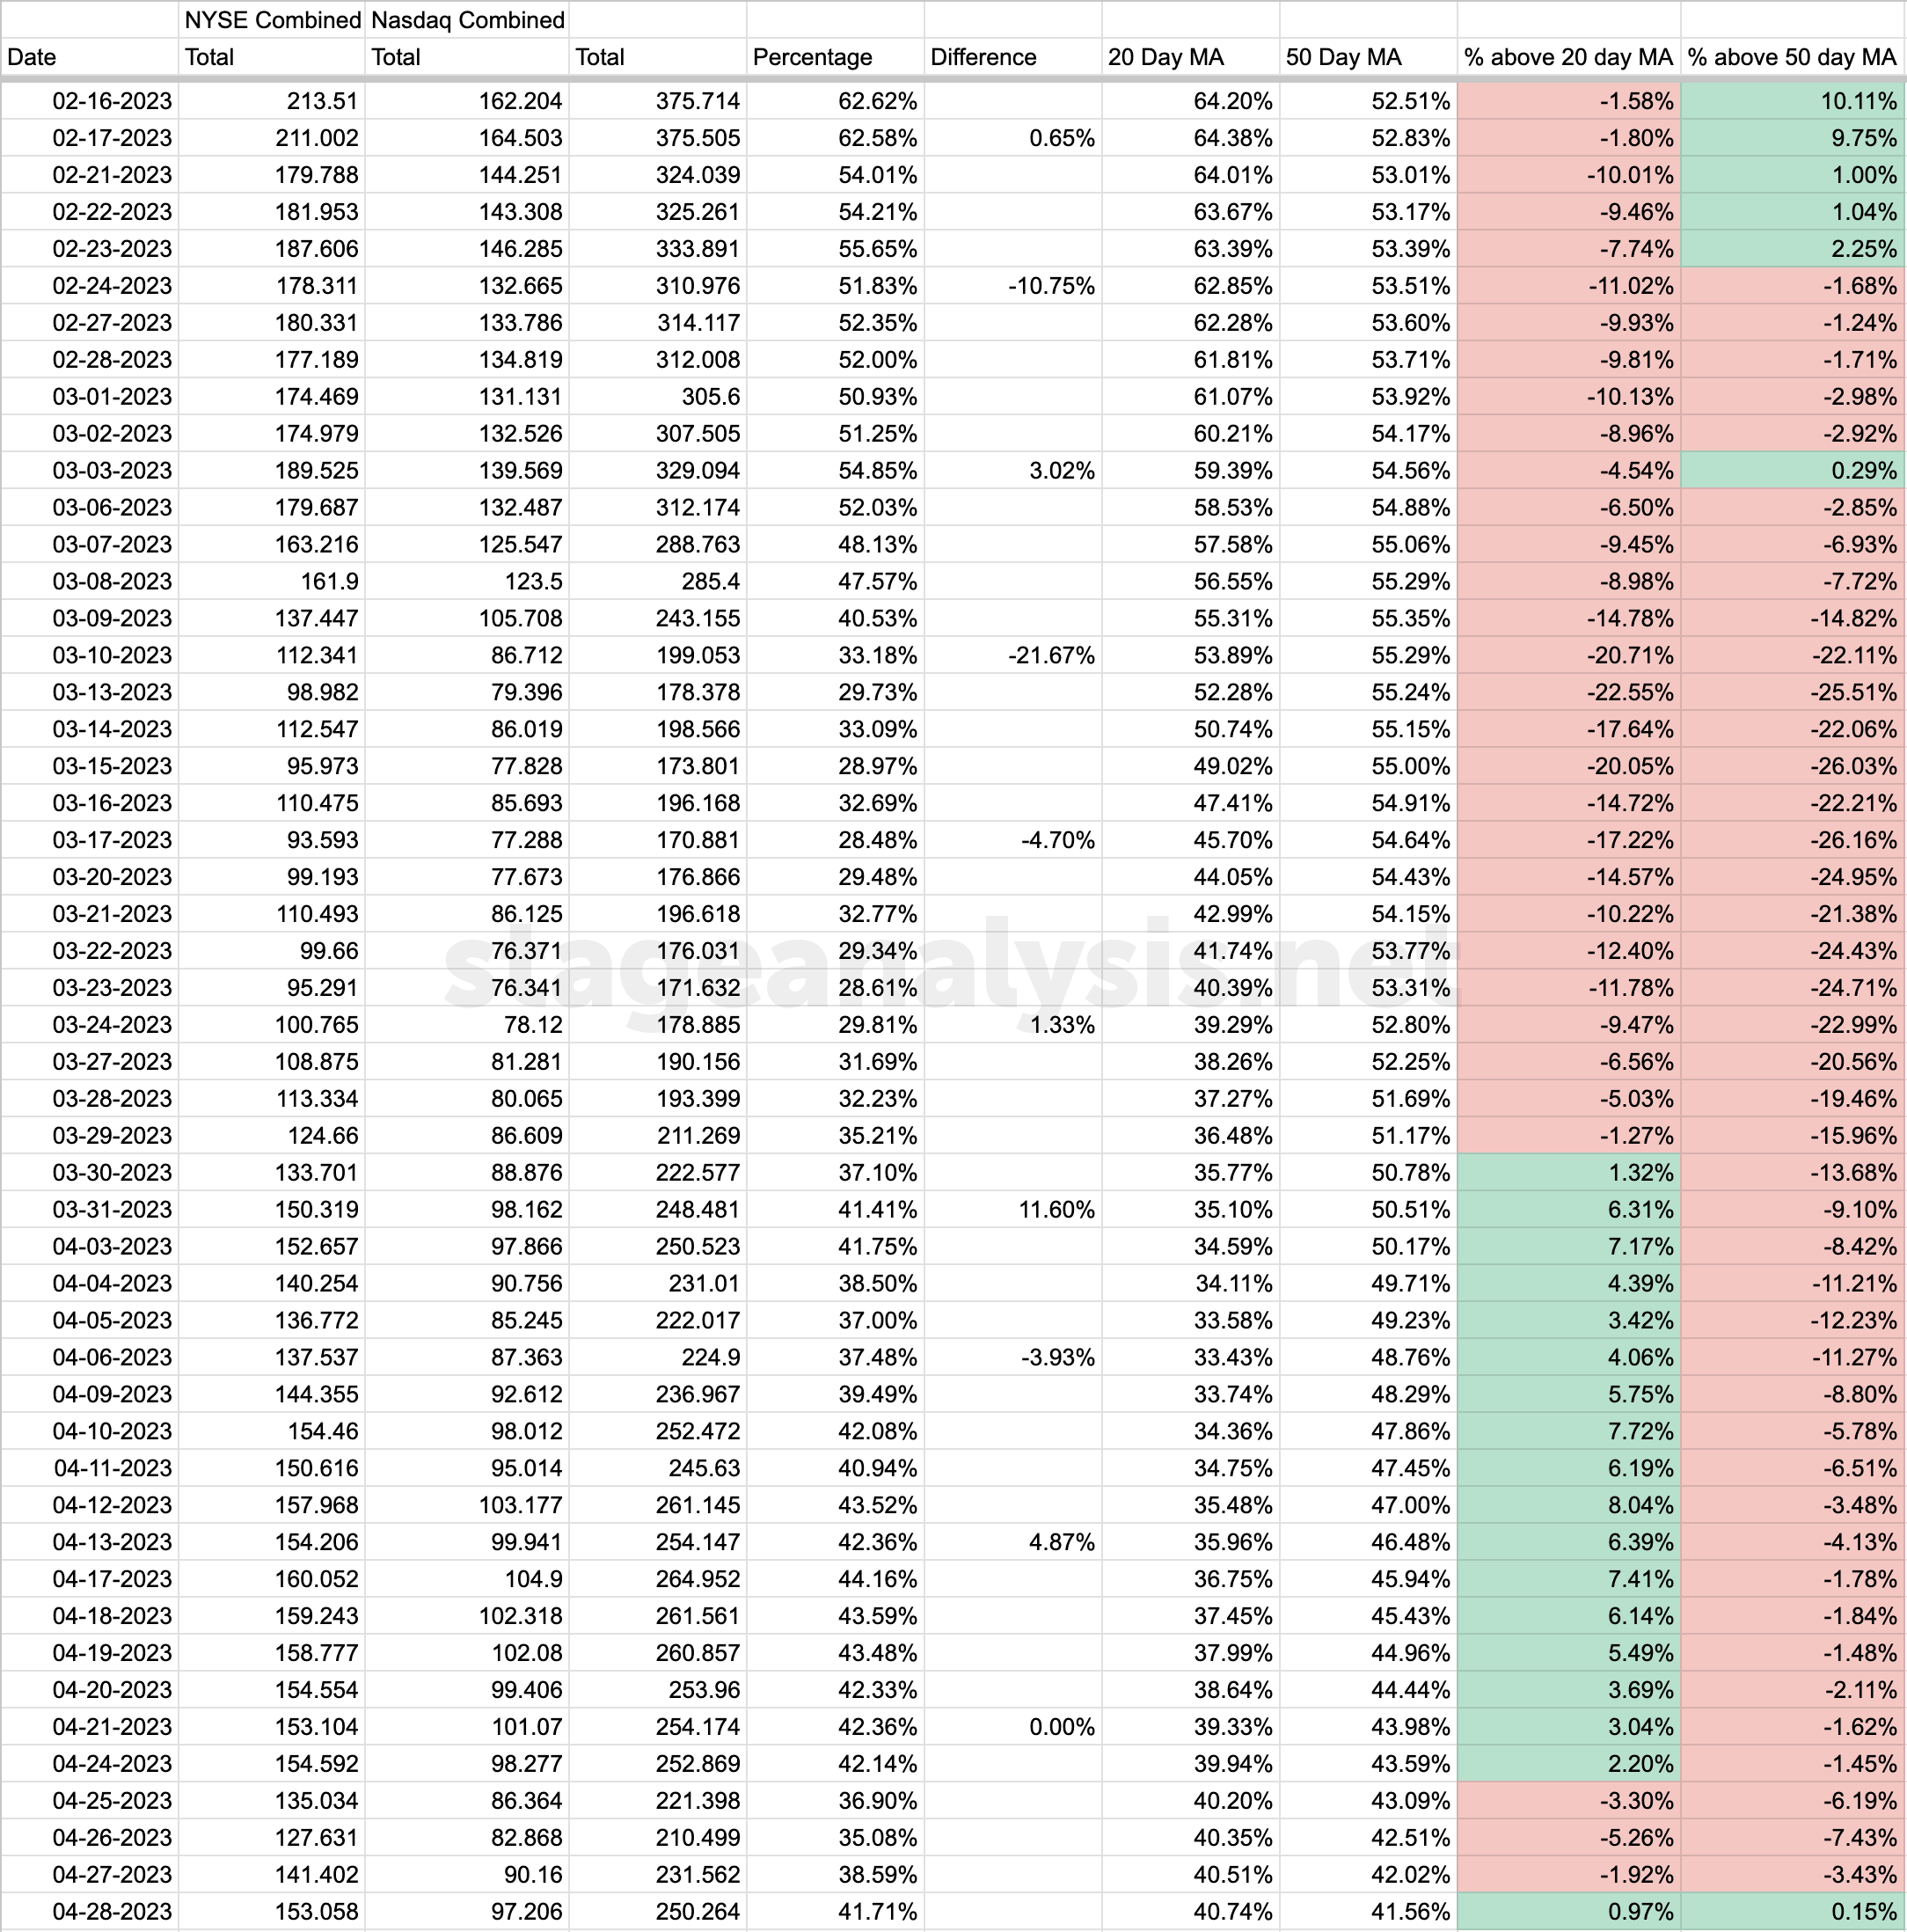
The overall average moved sharply below its 20 day MA during the week by -5.26%, which would have put it back to a Difficult Environment status if it had remained below it at weeks end. But it recovered on Friday to +0.97% above it, and also moved slightly above its own 50 day MA signal line by +0.15%, and so it is attempting to move to a Postive Environment status (but needs to be strongly above both MAs, and ideally the recent swing high in the data at 44.16%), and so the status remains unchanged as a Neutral environment currently.
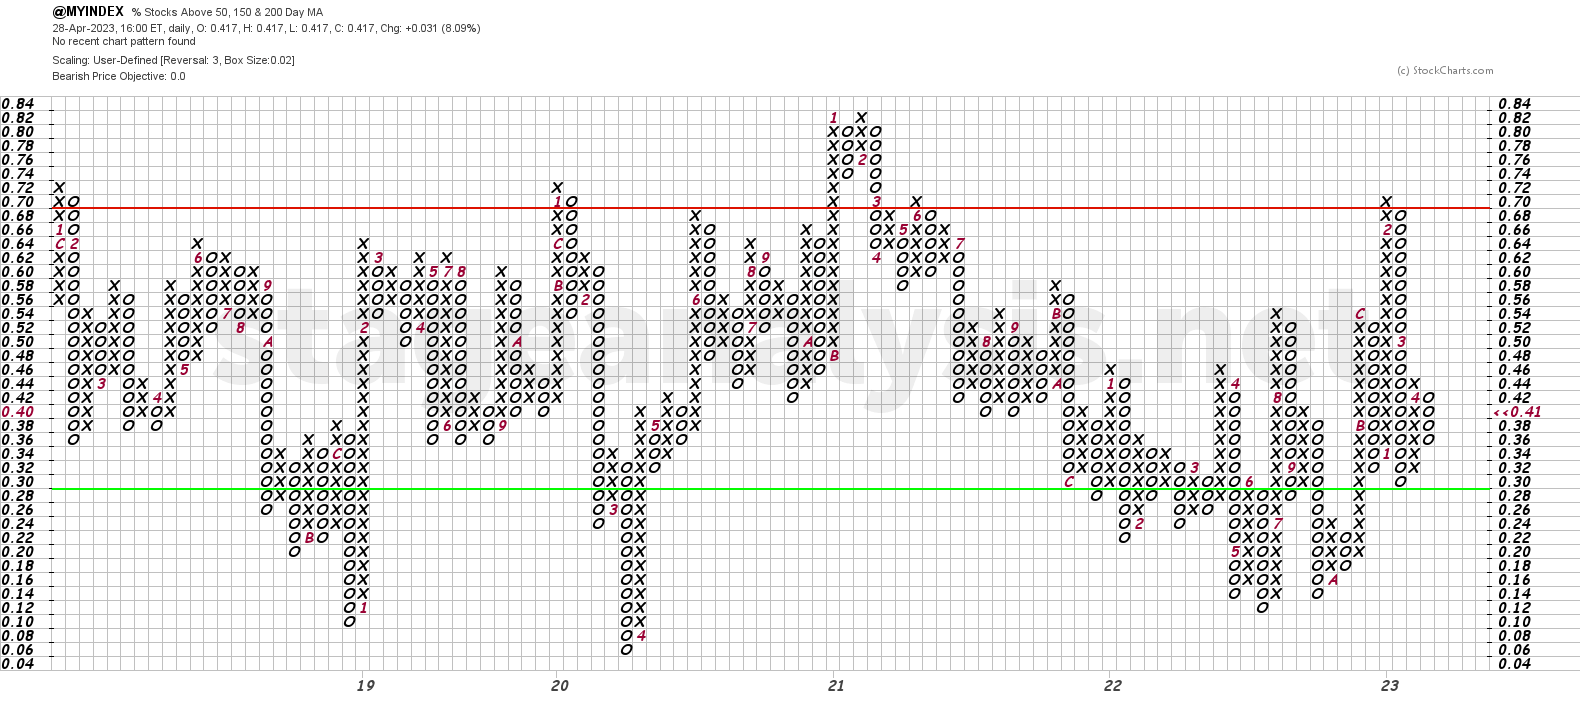
The Point and Figure (P&F) chart (shown above) reversed to a column of Os on Tuesday 25th April, and the strength on Friday did not recover the reversal, and so it ended the week in a column of Os, which changes the strategy to Defense and P&F status returns to Bear Confirmed status.
So the defensive team returns to the field once more, and hence risk management is the main focus at the start of the week.
To learn more about the automatic P&F statuses, read our Bullish Percent article that explains what they mean.
Status on Neutral Environment with P&F column in Os in the lower-middle zone.
- Defensive posture
- Point & Figure Bear Confirmed Status
- ETFs can be a lower-risk way to get exposure to certain groups, sectors or indexes if setups in individual stocks are lacking, and a way to increase exposure more quickly if market conditions improve, or as a way to hedge and to short via inverse funds.
- Progressive Exposure – only if testing the market on the long side. But only increasing exposure if account progress is made. i.e. no need to get more invested unless positive account progress is giving you a reason to increase your exposure.
- Focus on stocks with strong technical attributes (i.e. looking for A+ characteristics when analysing base structures / potential setups)
- Focus on strong and strengthening Relative Strength Industry Groups
- Looking for Stage 2 Breakouts and Backups, Stage 2 Continuation Breakouts, Earnings Gap Significant Bars, constructive pullbacks, consolidation, Volatility Contraction Patterns (VCP), springs, and tight action in re-accumulation bases
- Hold leaders
- Sell laggards
- Set price alerts at key levels in stocks developing Stage 1 bases and re-accumulation base in Stage 2 with the strongest characteristics.
- Watch for signs of developing relative strength (i.e. groups moving strongly up the RS rankings table).
- Build watchlists in groups showing signs of accumulation and building constructive bases with strong volume coming into the stocks in the group. So that you are ready to act when the stocks reach proper entry zones in Phases C to E of the bases. Or late Stage 1 / early Stage 2
- Focus on risk management
- The combined percentage of stocks status closed the week +0.97% above its 20 day MA and +0.15% above its declining 50 day MA, and so remains on a Neutral Environment status.
- Overall strategy (based only this breadth data) changed to Defense this week, with the sharp drop earlier in the week, which was mostly recovered on Friday, but not enough to reverse the P&F column back to Xs, and so the field position continues to be poor at only 41.71%, while a few major indexes are hovering around Stage 2 levels. Hence, with another big week of earnings results coming up, including AAPL – caution remains prudent. As even if the market does manage to breakout into Stage 2, then the breadth data shows that there's a majority of stocks still below their key MAs.
*Not a recommendation to buy or sell securities. Information is for educational purposes only. See full terms and conditions.
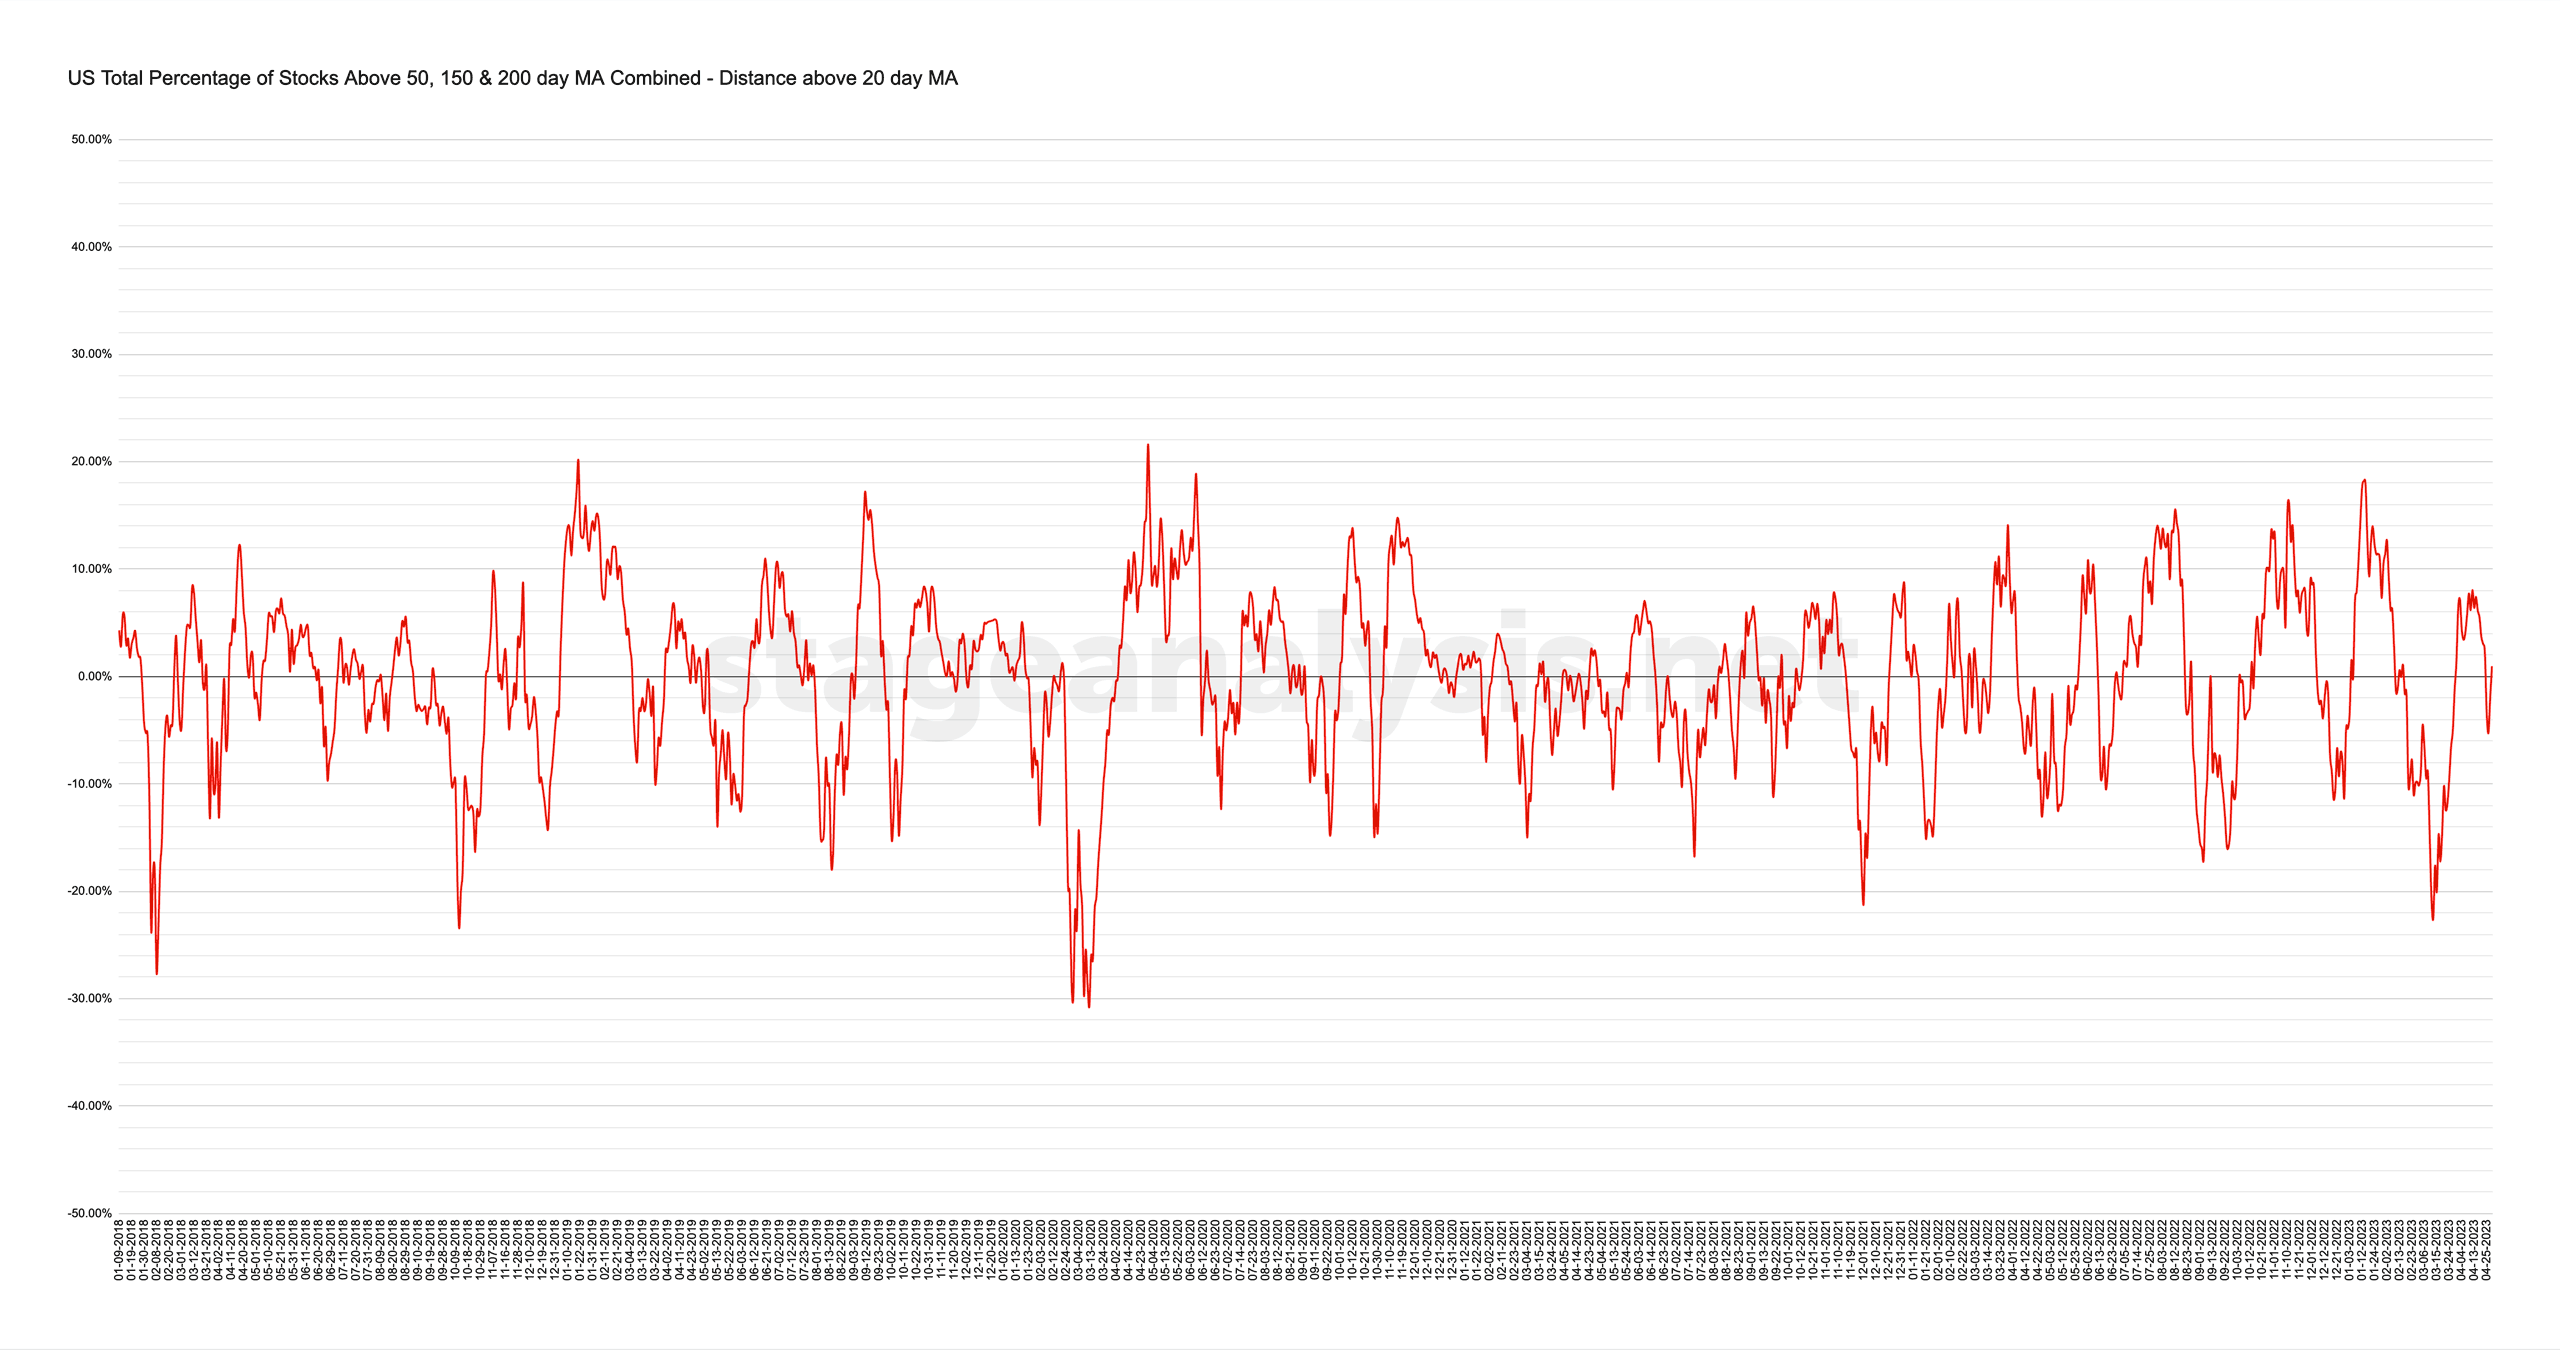
20 and 50-day Oscillator
These show the distance that the combined chart is from the 20-day MA and 50-day MA on the chart. Above zero is a positive environment and below is a difficult/negative environment.
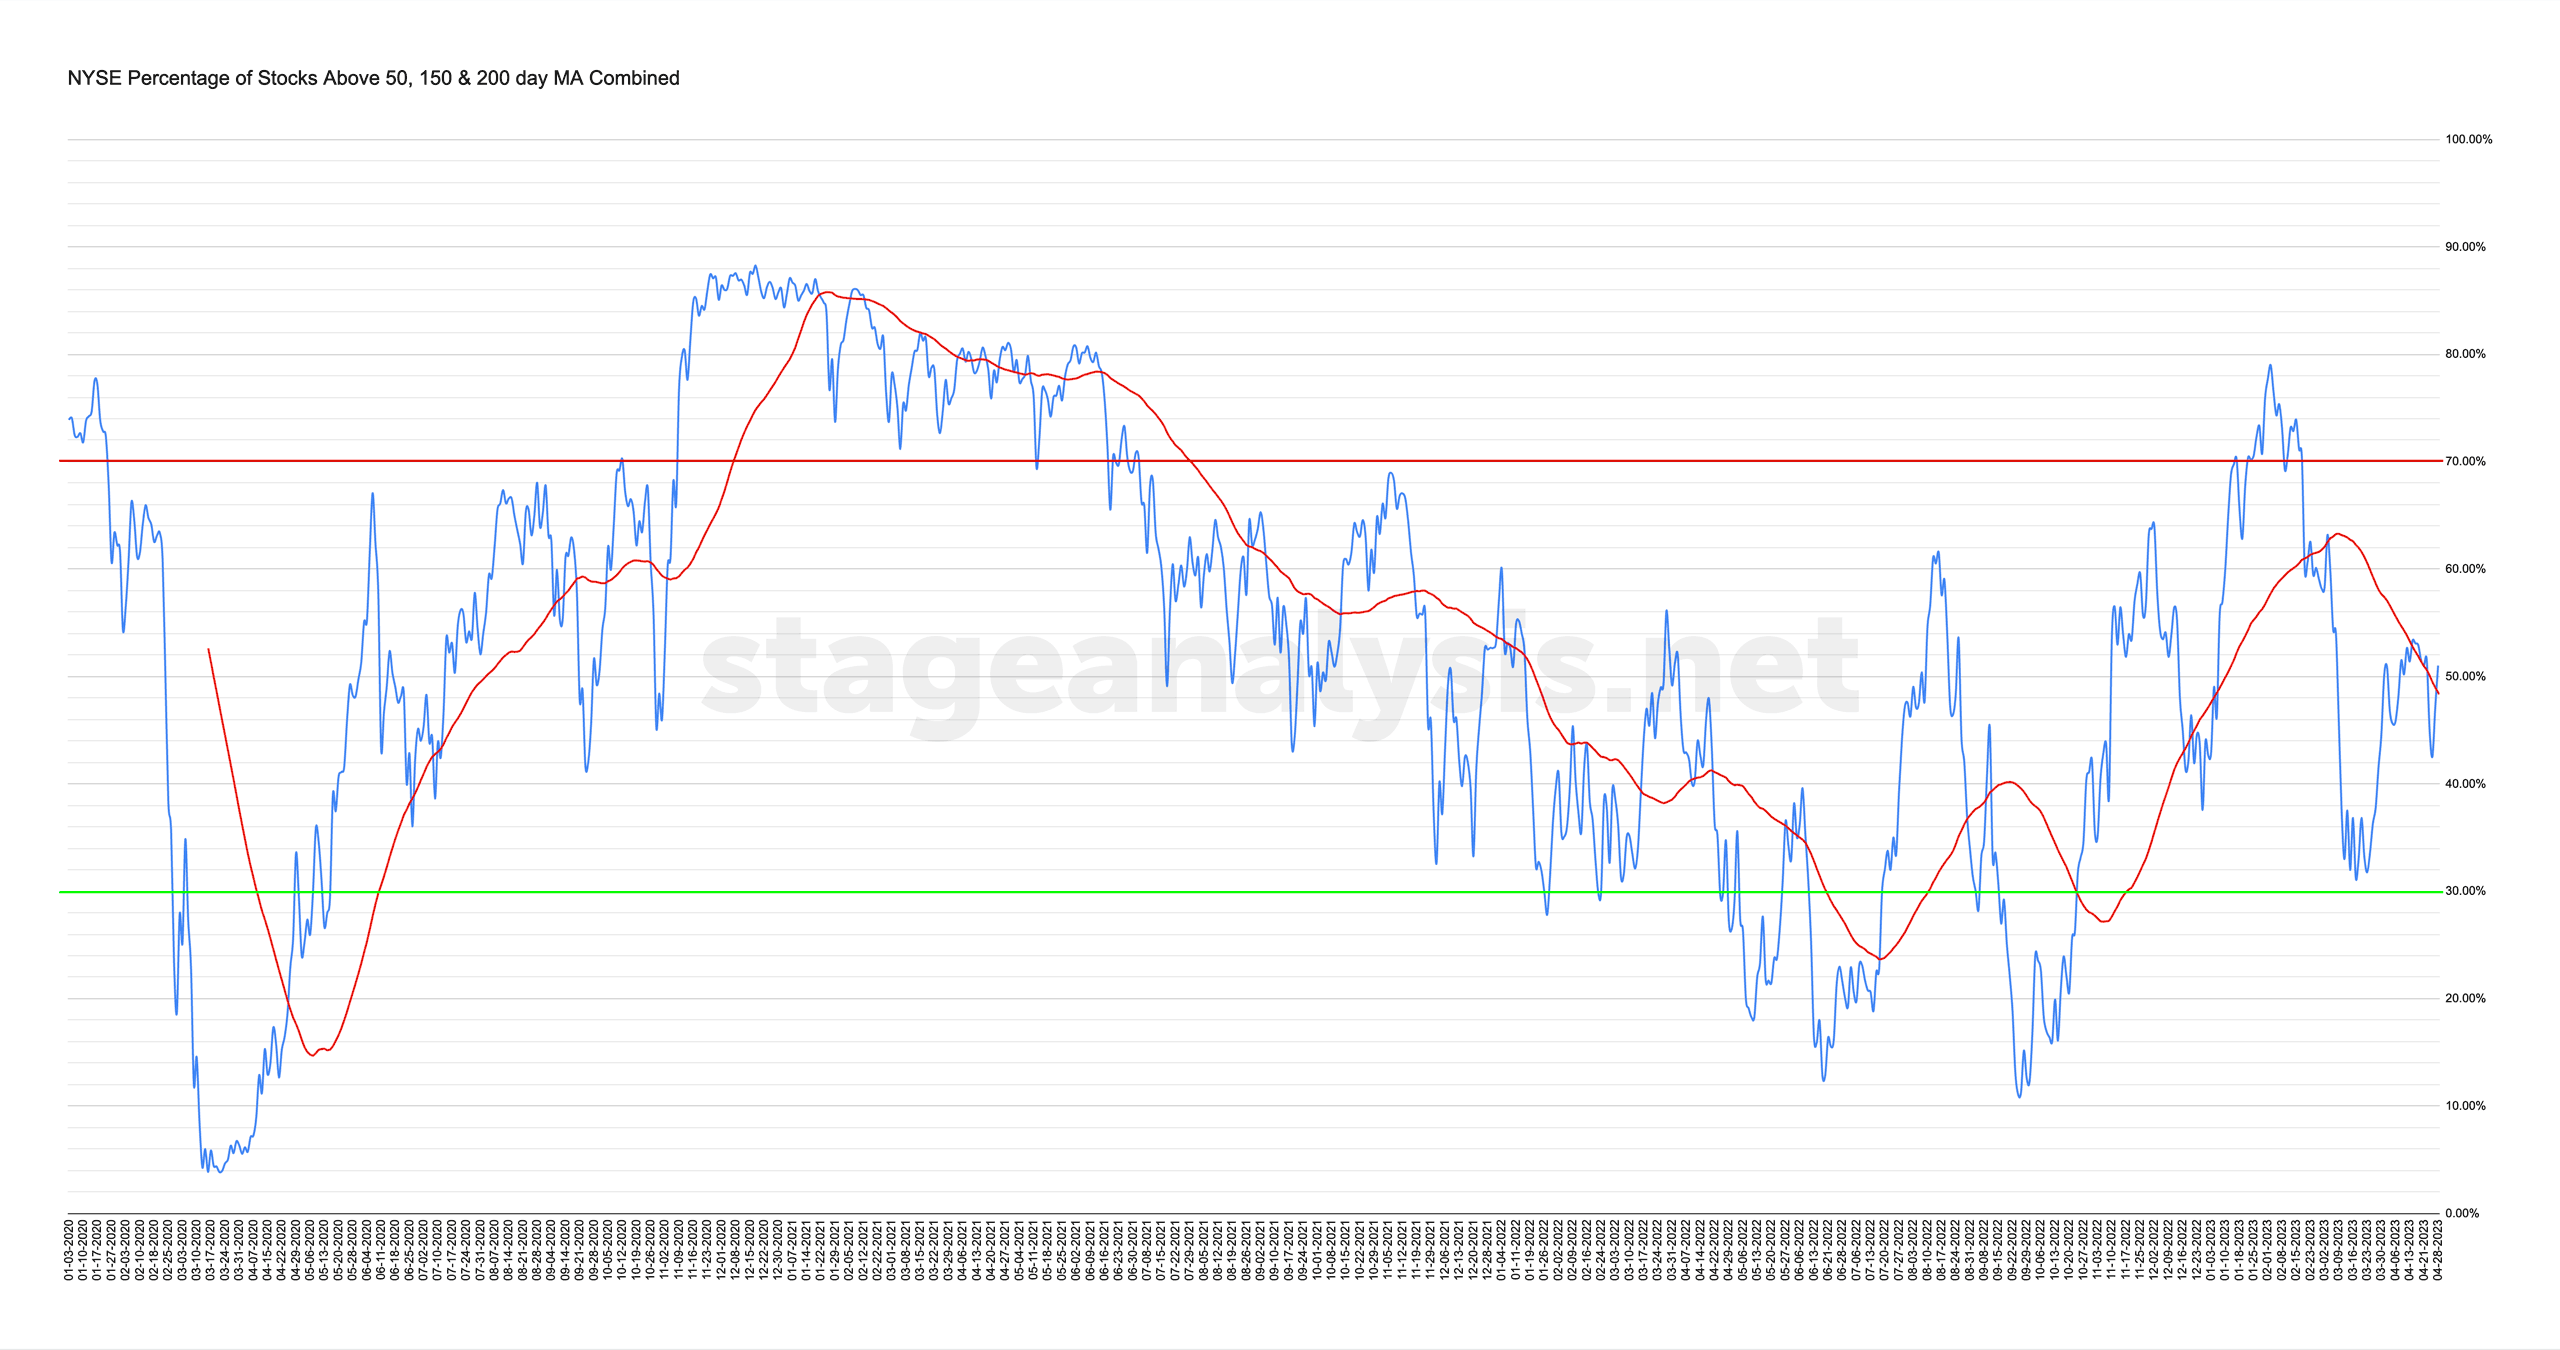
NYSE Total % Stocks Above their 50 Day, 150 Day & 200 Day Moving Averages Combined
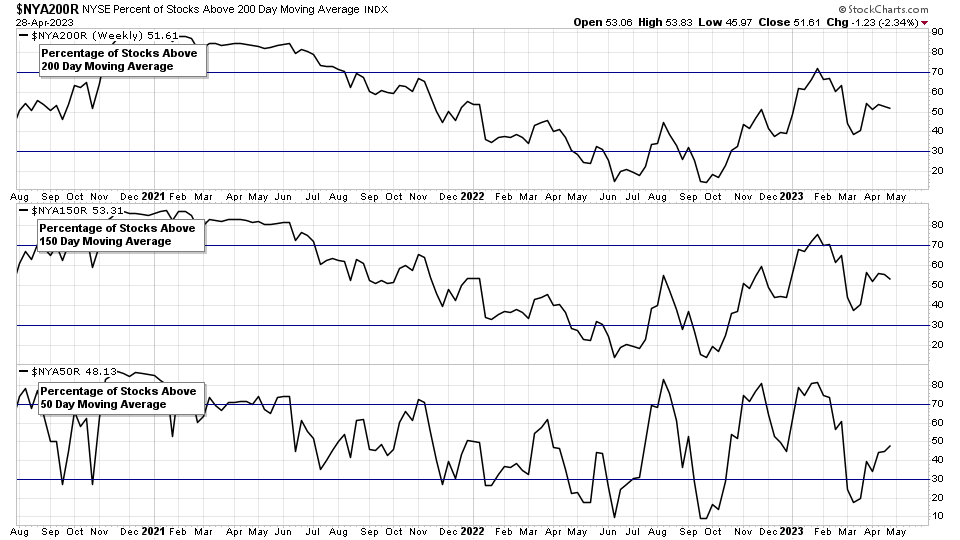
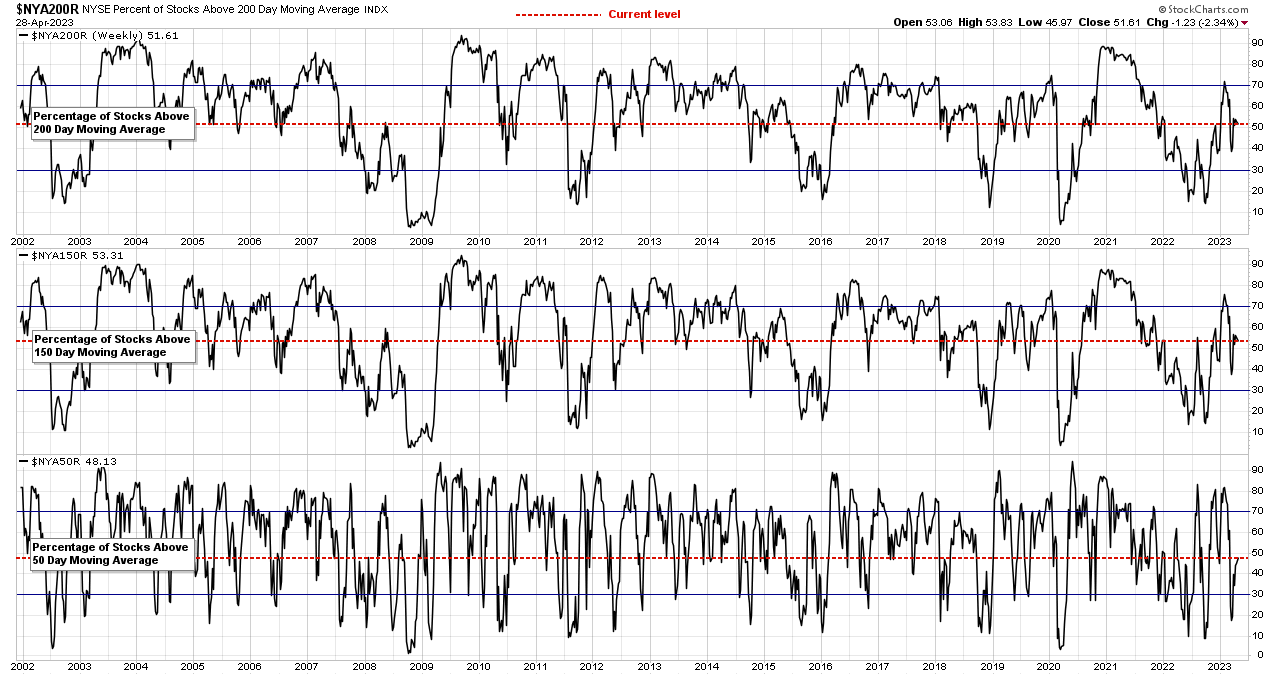
- Long Term: Stocks Above 200 Day MA: 51.61%
- Medium Term: Stocks Above 150 Day MA: 53.31%
- Short Term: Stocks Above 50 Day MA: 48.13%
51.02% (-0.02% 1wk)
Nasdaq Total % Stocks Above their 50 Day, 150 Day & 200 Day Moving Averages Combined
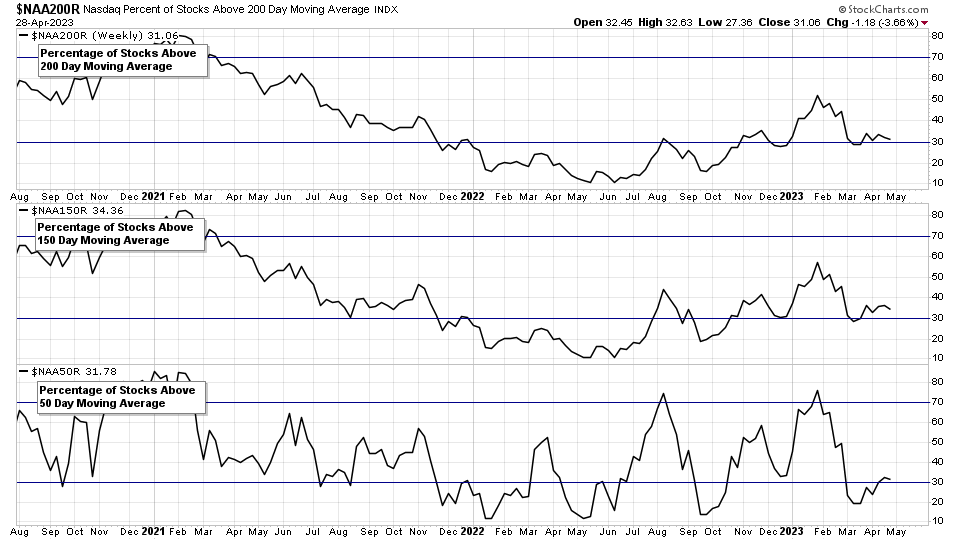
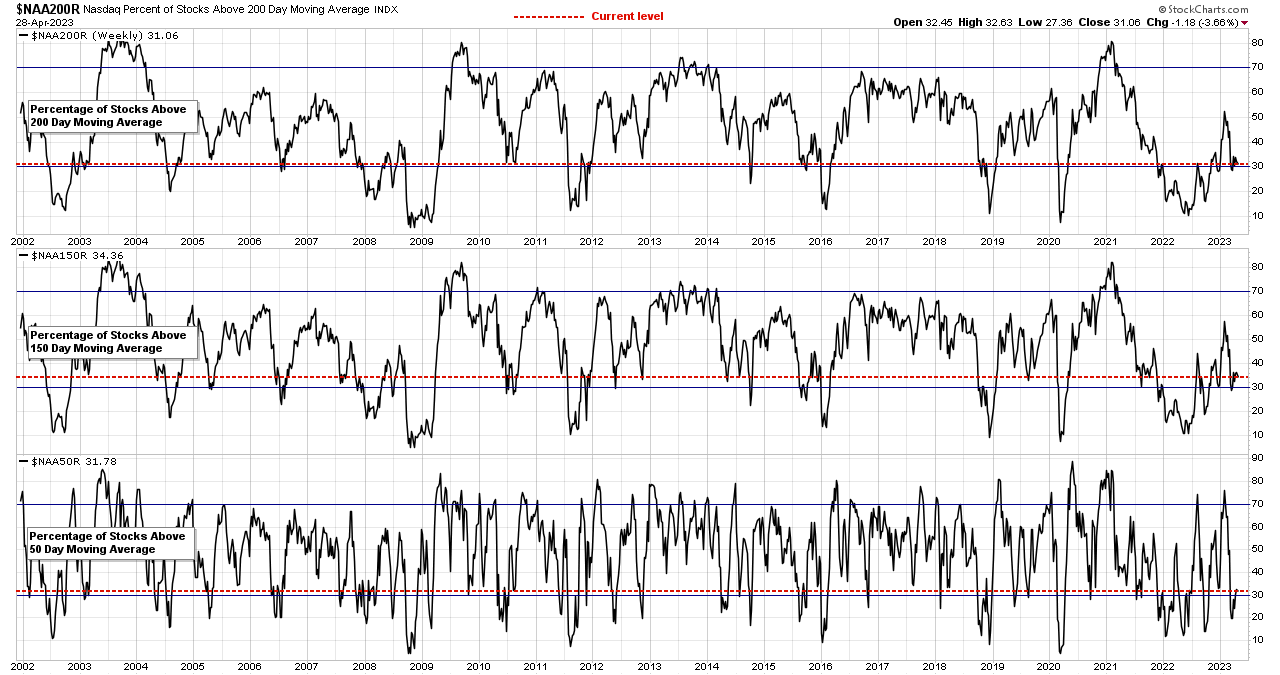
- Long Term: Stocks Above 200 Day MA: 31.06%
- Medium Term: Stocks Above 150 Day MA: 34.36%
- Short Term: Stocks Above 50 Day MA: 31.78%
32.40% (-1.29% 1wk)
Become a Stage Analysis Member:
To see more like this – US Stocks watchlist posts, detailed videos each weekend, use our unique Stage Analysis tools, such as the US Stocks & ETFs Screener, Charts, Market Breadth, Group Relative Strength and more...
Join Today
Disclaimer: For educational purpose only. Not investment advice. Seek professional advice from a financial advisor before making any investing decisions.