
US Stocks Industry Groups Relative Strength Rankings
The full post is available to view by members only. For immediate access:
US Industry Groups by Highest RS Score
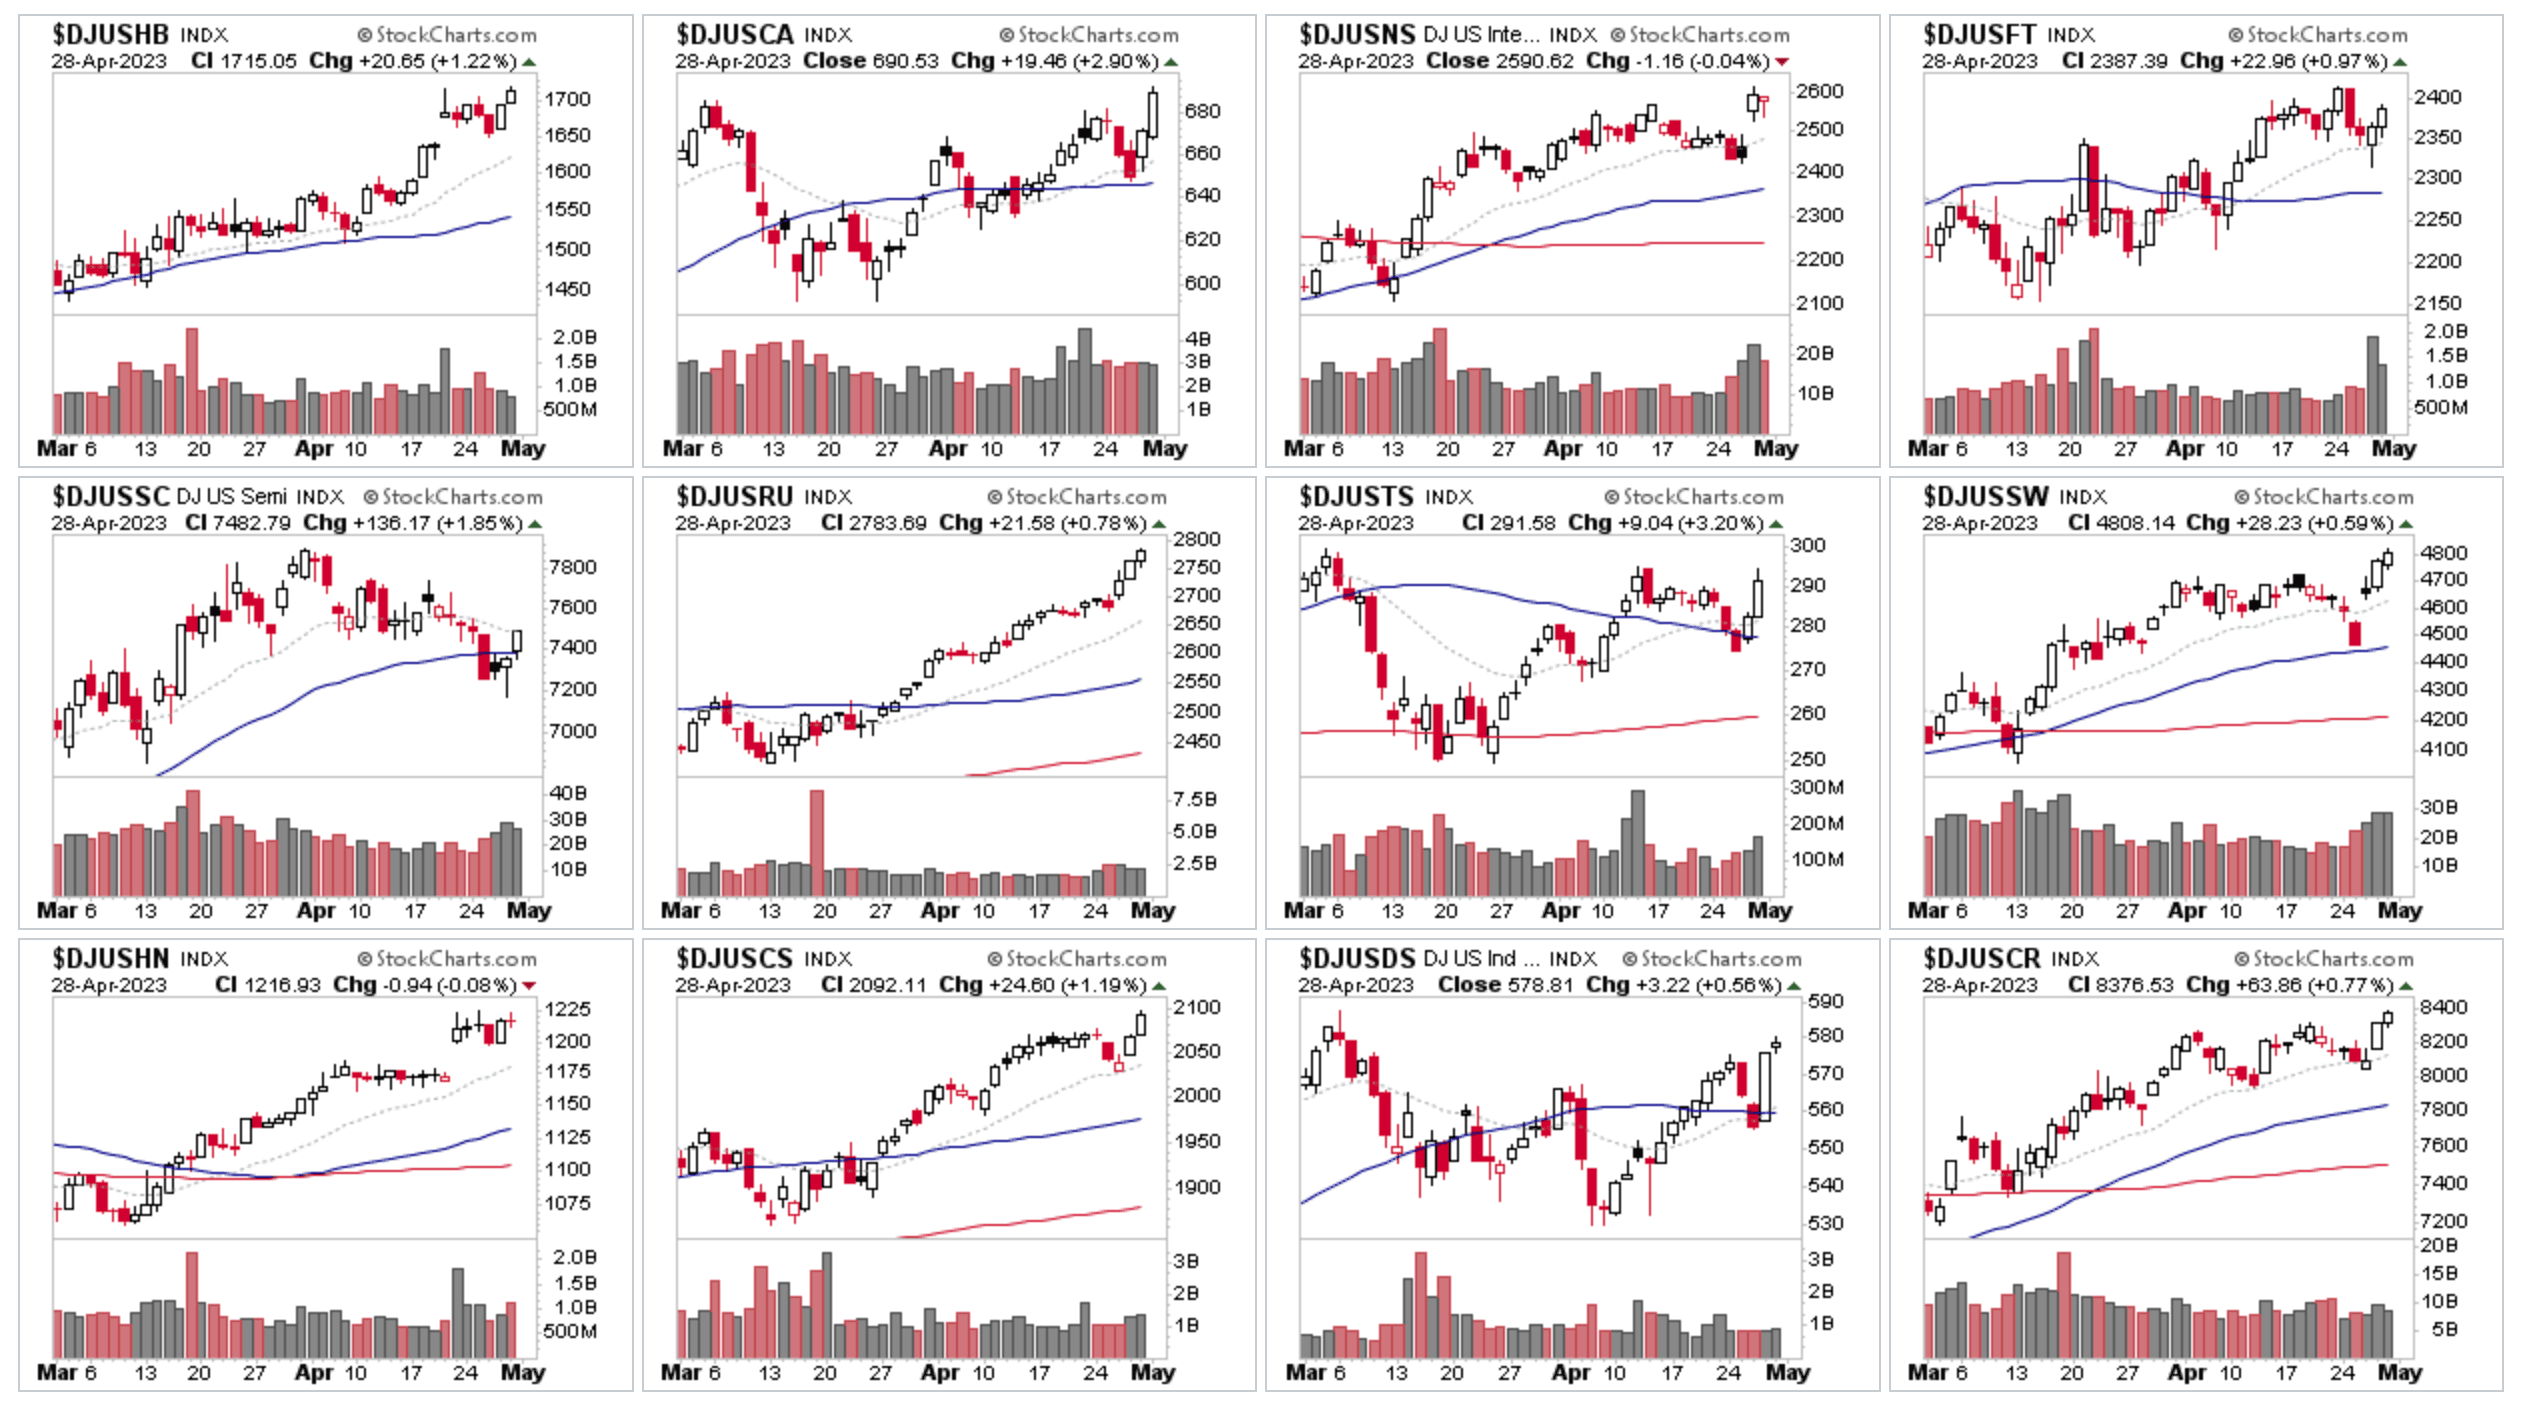
The Home Construction ($DJUSHB) group has risen to the no.1 spot in the RS rankings this week, with a further 52 week high, following earnings in around one third of the stocks in the group, and it is also now within a few percent of its all time highs.
So it has been a great example of the Forest to The Trees approach from Stan Weinstein's Stage Analysis method, starting from the improvement in breadth in the group in Q4 of 2022, as multiple stocks developed into Stage 1 bases and began showing up in the watchlists scans and posts, and then the leaders started to breakout into early Stage 2 and took the group chart with them in late November/early December (see below).
As 90% of the group had managed to get back above their 30 week moving averages by early December, and the group had steadily risen up the Industry Groups RS rankings from near the lower end of the rankings in August, up to 2nd place in mid December briefly, and it has since been consistently in the top 20 of the rankings as it's risen through it's Stage 2 advance.
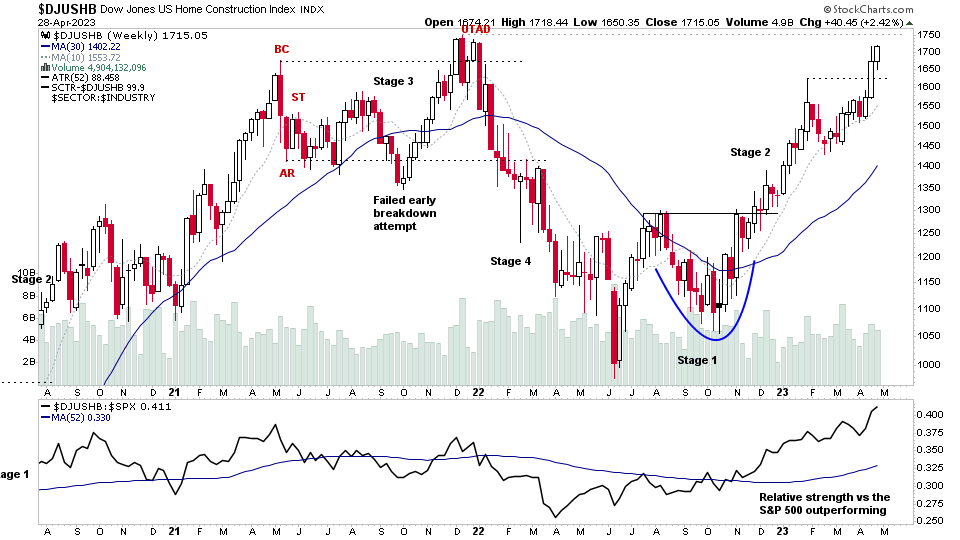
At five months into its Stage 2 advance, it's now well past the Investor method entry points, which were discussed at the time in the weekend videos and blog posts, and so any focus would now be on looking for the Trader method entry points to develop on Stage 2 continuation breakouts, if considering trading stocks in the group now in the later part of their Stage 2 advance – which has a much higher risk of failure, and so also could become a target for shorts at this point in the advance, as the group chart approaches a key resistance level at the all-time highs and becomes more popular with the crowd.
So if learning the Stage Analysis Investor method, then I recommend looking back through the Home Construction group individual stock charts over the last year, and studying how they transitioned through the Stages, and how the strength in the group developed. As it is an excellent example of why strong group themes is a key aspect of the method. But you need to learn to see the group strength as it's developing, as if you wait until a group reaches the top of the RS rankings, then the stocks will be a long way past their ideal entry points and you could end up being exit liquidity for those traders and investors that got in at the start of Stage 2.
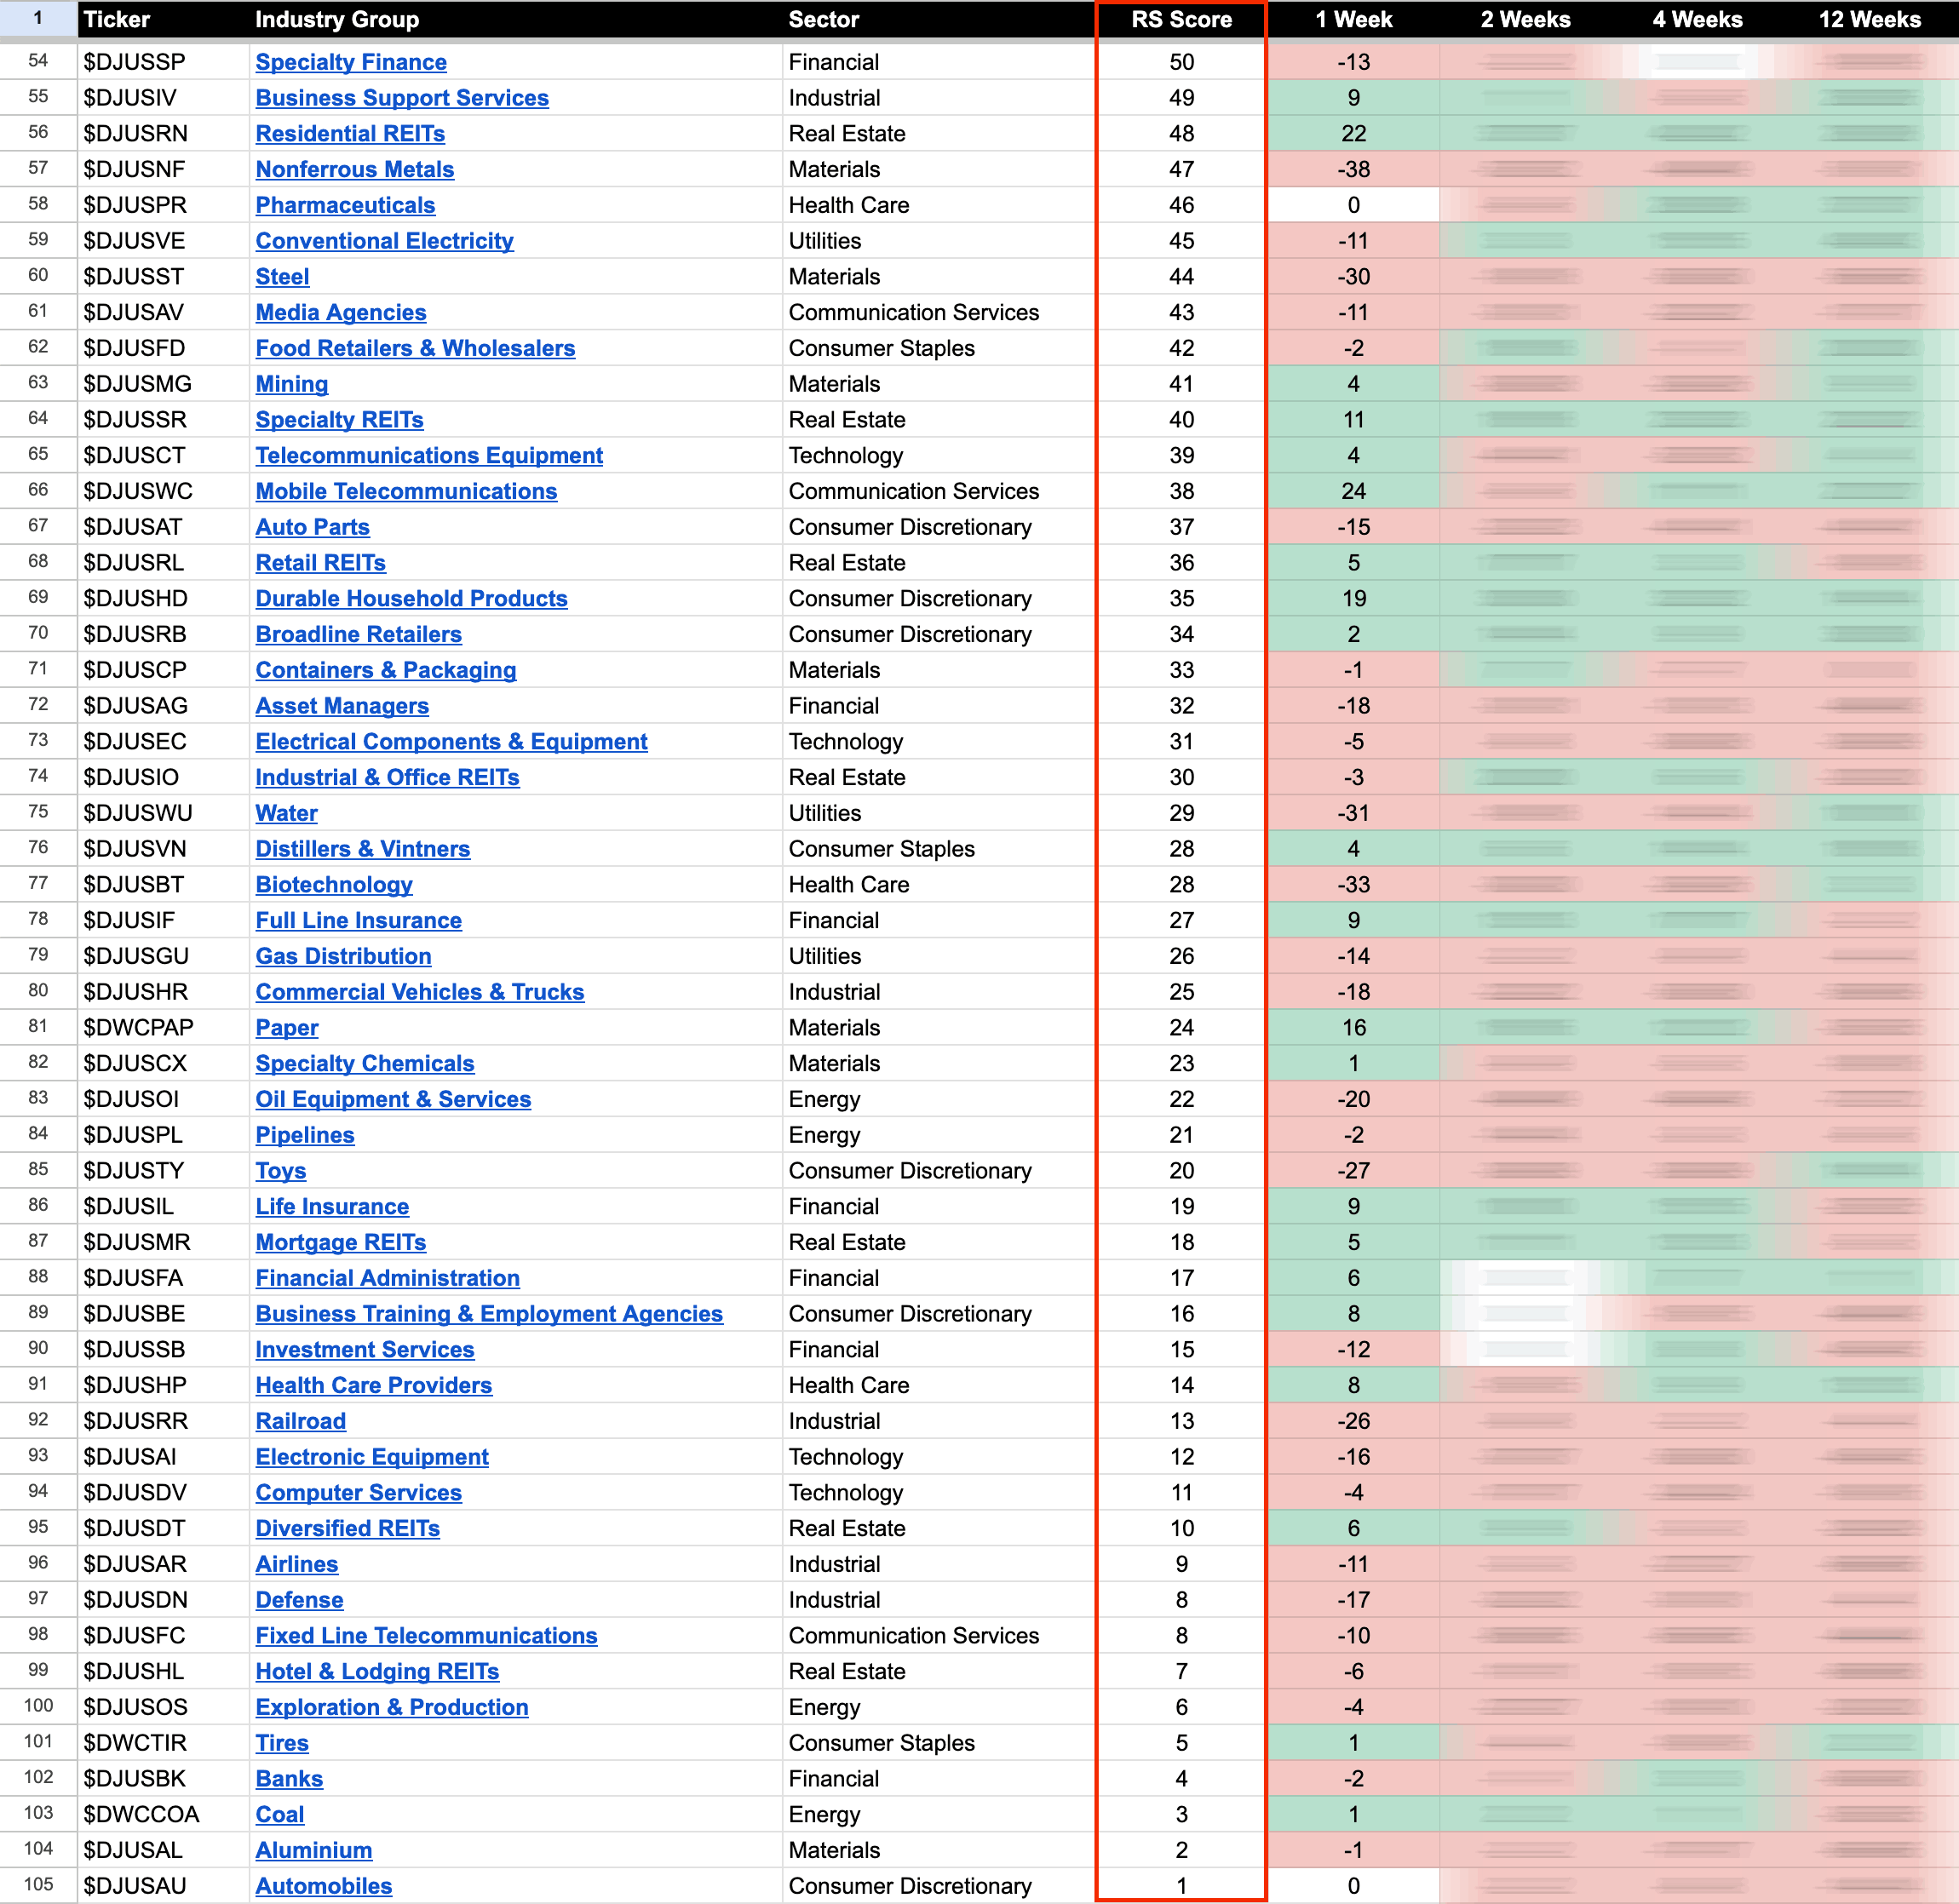
US Industry Groups by Weakest RS Score
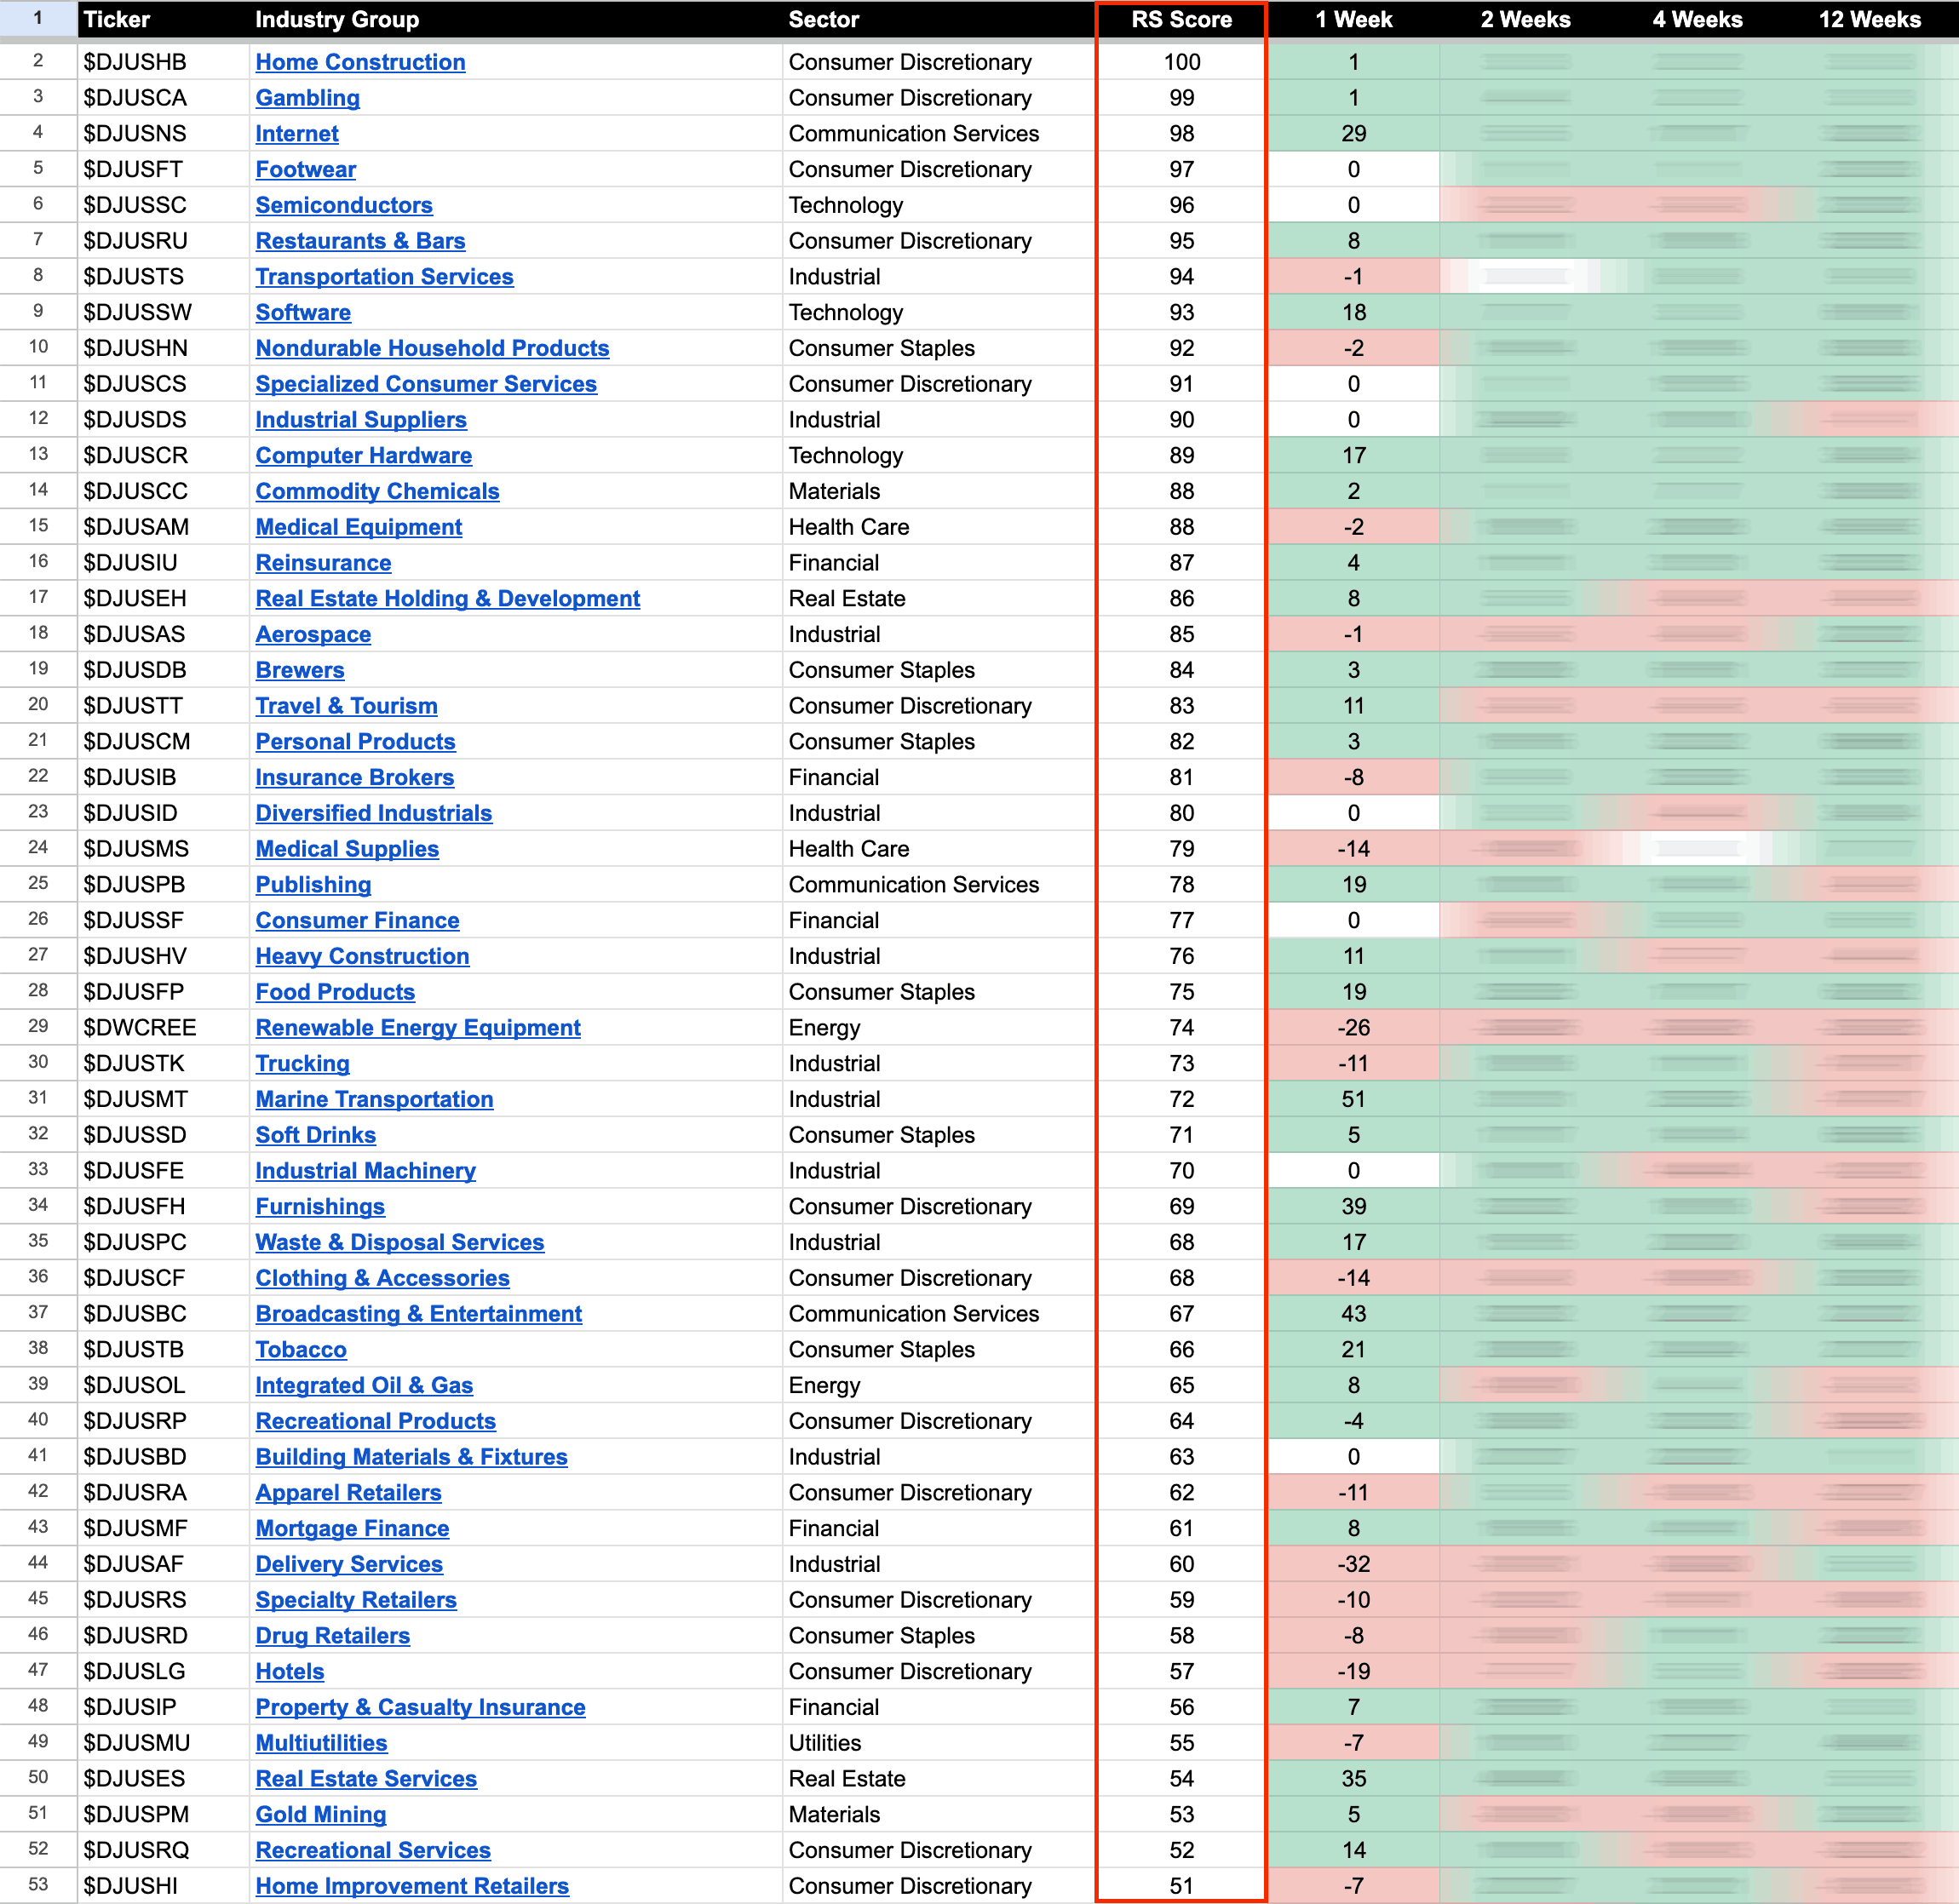
US Industry Groups sorted by Relative Strength
The purpose of the Relative Strength (RS) tables is to track the short, medium and long-term RS changes of the individual groups to find the new leadership earlier than the crowd.
RS Score of 100 is the strongest, and 0 is the weakest.
In the Stage Analysis method we are looking to focus on the strongest groups, as what is strong, tends to stay strong for a long time. But we also want to find the improving / up and coming groups that are starting to rise up strongly through the RS table from the lower zone, in order to find the future leading stocks before they break out from a Stage 1 base and move into a Stage 2 advancing phase.
Each week I go through the most interesting groups on the move in more detail during the Stage Analysis Members weekend video – as Industry Group analysis is a key part of Stan Weinstein's Stage Analysis method.
Become a Stage Analysis Member:
To see more like this – US Stocks watchlist posts, detailed videos each weekend, use our unique Stage Analysis tools, such as the US Stocks & ETFs Screener, Charts, Market Breadth, Group Relative Strength and more...
Join Today
Disclaimer: For educational purpose only. Not investment advice. Seek professional advice from a financial advisor before making any investing decisions.