
Market Breadth: Percentage of Stocks Above their 50 Day, 150 Day & 200 Day Moving Averages Combined
The full post is available to view by members only. For immediate access:
33.18% (-21.67% 1wk)
Status: Difficult Environment – Stage 4 zone
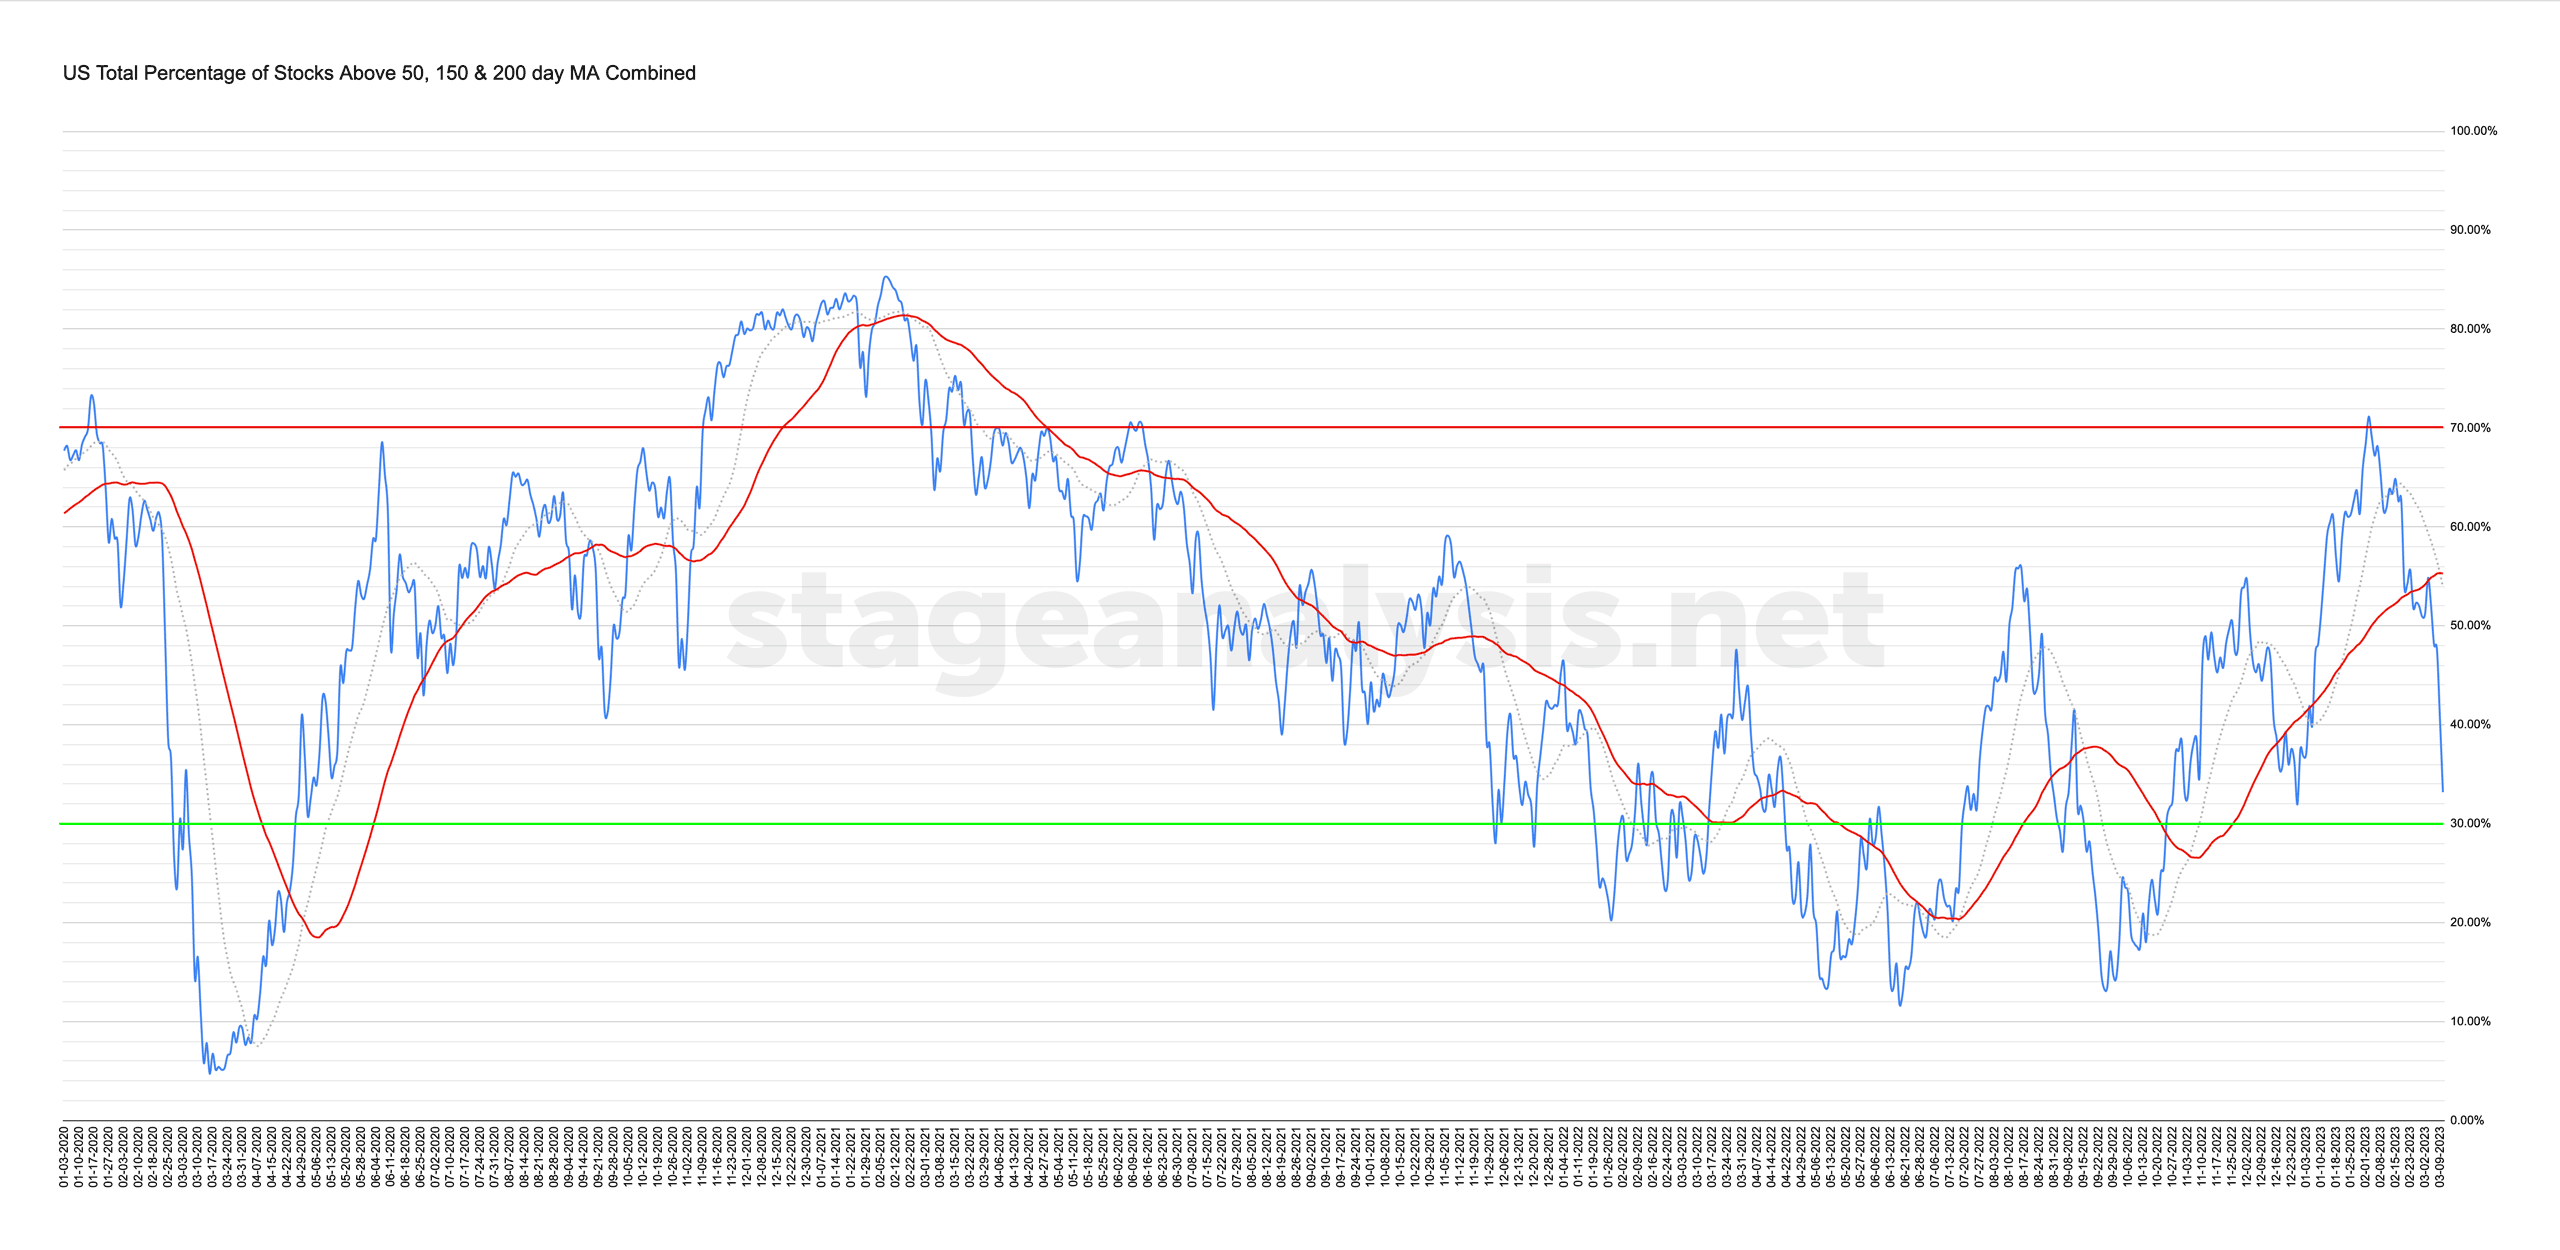
The US Total Percentage of Stocks above their 50 Day, 150 Day & 200 Day Moving Averages (shown above) had a huge decline over the prior weeks close, with a -21.67% drop from the combined NYSE & Nasdaq data.
The overall combined average now stands at 33.18% in the US market (NYSE and Nasdaq markets combined) above their short, medium and long term moving averages, and has moved heavily below its own 50 day MA signal line by -22.11%, and is also -20.71% below the declining 20 day MA, which also crossed below the 50 day MA this week.
So with the strong decline below the 50 day MA signal line, the status changes back to a Difficult Environment in the lower-middle range, which is the Stage 4 zone (Below 40% range), and is the weakest level it's been at since late December.
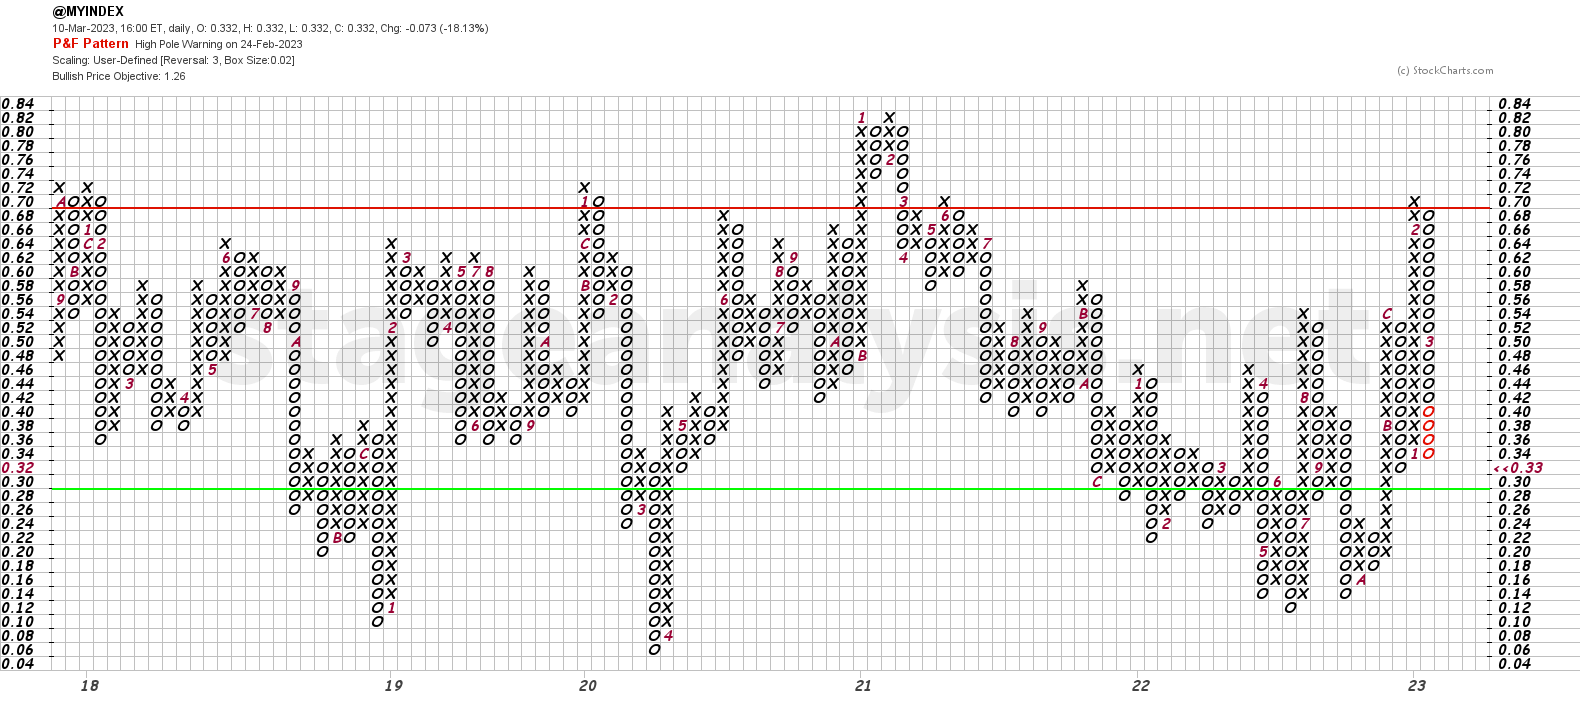
The Point and Figure (P&F) chart (shown above), dropped a massive 9 Os this week and is now 2 boxes from the prior December low. So the strategy based on the P&F chart remains on Defense for a fifth week (since the reversal to the column of Os on the 9th February), and the P&F status remains on Bear Alert status, as it hasn't yet closed below the prior column of Os low, but has dropped all the way from above the 70% level to the current 33.18% level.
”The market has the ball, and the defensive team is on the field.”
Become a Stage Analysis Member:
To see more like this – US Stocks watchlist posts, detailed videos each weekend, use our unique Stage Analysis tools, such as the US Stocks & ETFs Screener, Charts, Market Breadth, Group Relative Strength and more...
Join Today
Disclaimer: For educational purpose only. Not investment advice. Seek professional advice from a financial advisor before making any investing decisions.