
$ONDS Stock Testing the Top of the Stage 1 Base
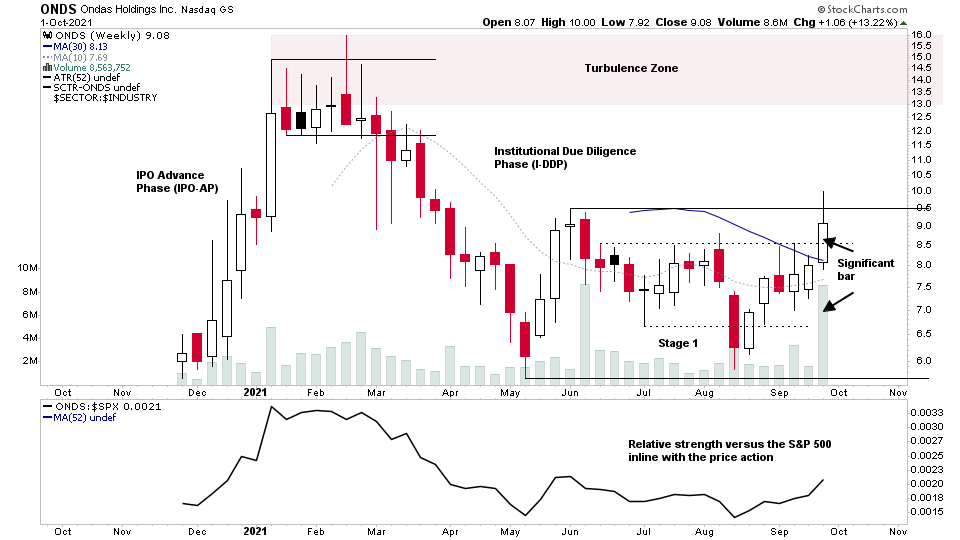
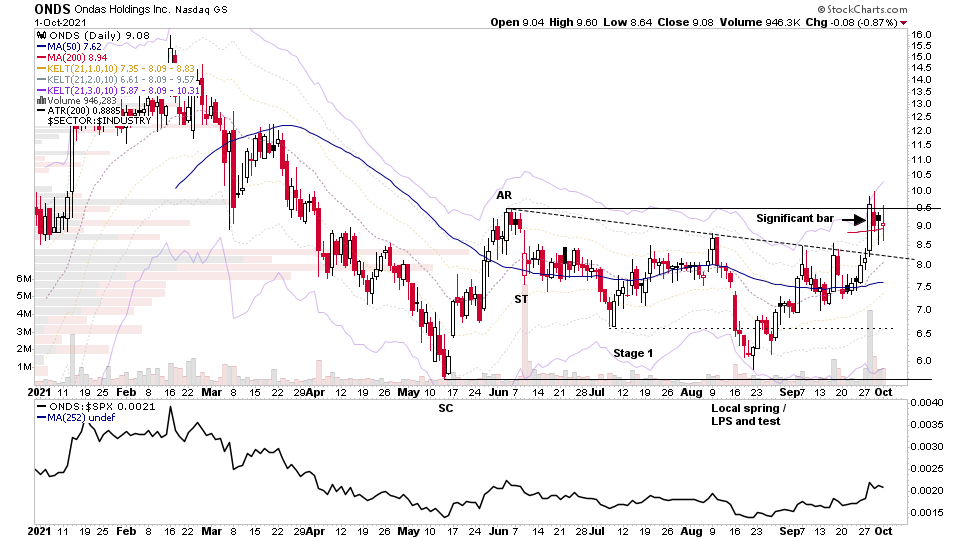
ONDS (Ondas Holdings) made an early Stage 2A breakout attempt this week from its developing Stage 1 base on strong relative volume, but ended the week under the resistance level from the June high and prior higher range forming an upthrust and remains in Stage 1. It did however close the week well above numerous recent near term swing highs from within the range and formed a Significant Bar on the 28th September which is visible on the daily chart below.
For those that have read the excellent book The Lifecycle Trade: How to Win at Trading IPOs and Super Growth Stocks - the pattern since the IPO looks to be what they classified as a "Late Bloomer" where the stock has an initial strong IPO Advance Phase (IPO-AP) before pulling back and then going through a base building period called the Institutional Due Diligence Phase (I-DDP), which often forms as the major Stage 1 base.
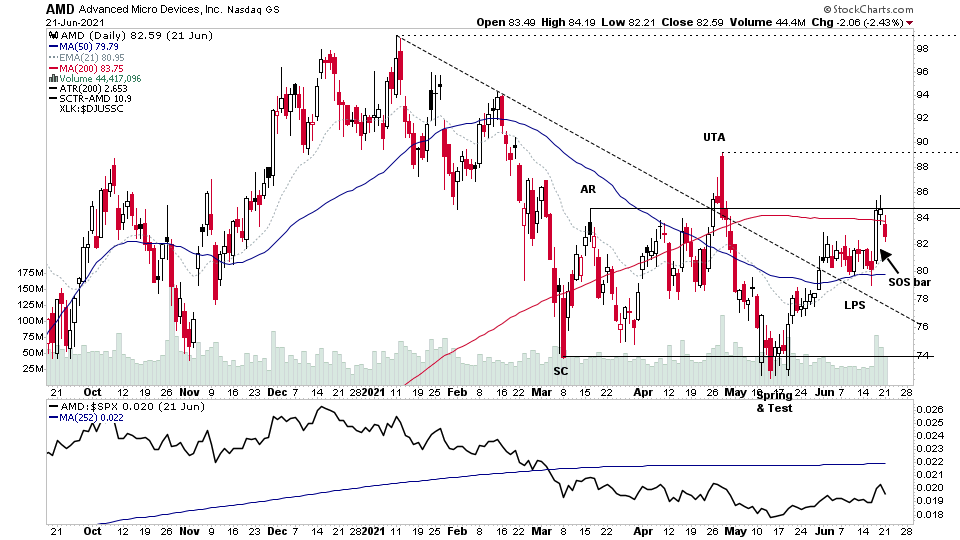
The price action action also has a similar look to what we saw in AMD earlier in the year before it's Stage 2 breakout and advance higher (see below), with a similar significant bar near the top of the range and then backing up within the range of the significant bar before breaking out convincingly. However, I'm not saying that ONDS will do the same, but it is showing a similar pattern so far as it builds its Stage 1 base.
So I'm watching to see if it will hold the range from the significant bar and then make a new Stage 2 breakout attempt on strong relative volume.
Become a Stage Analysis Member:
To see more like this – US Stocks watchlist posts, detailed videos each weekend, use our unique Stage Analysis tools, such as the US Stocks & ETFs Screener, Charts, Market Breadth, Group Relative Strength and more...
Join Today
ONDS Stock Point & Figure Horizontal Price Target (Wyckoff method)
The Wyckoff method can be used to calculate a price target using the P&F horizontal count line, which is 25 columns with a 0.25 box size by 3 reversal chart. Which added onto the Base Low at 5.75 and the Last Point of Support (LPS) at 7.50, gives a target range of 24.50 to 26.25. Hence the potential Cause from the Stage 1 base is over 100%+ from the current price level.*
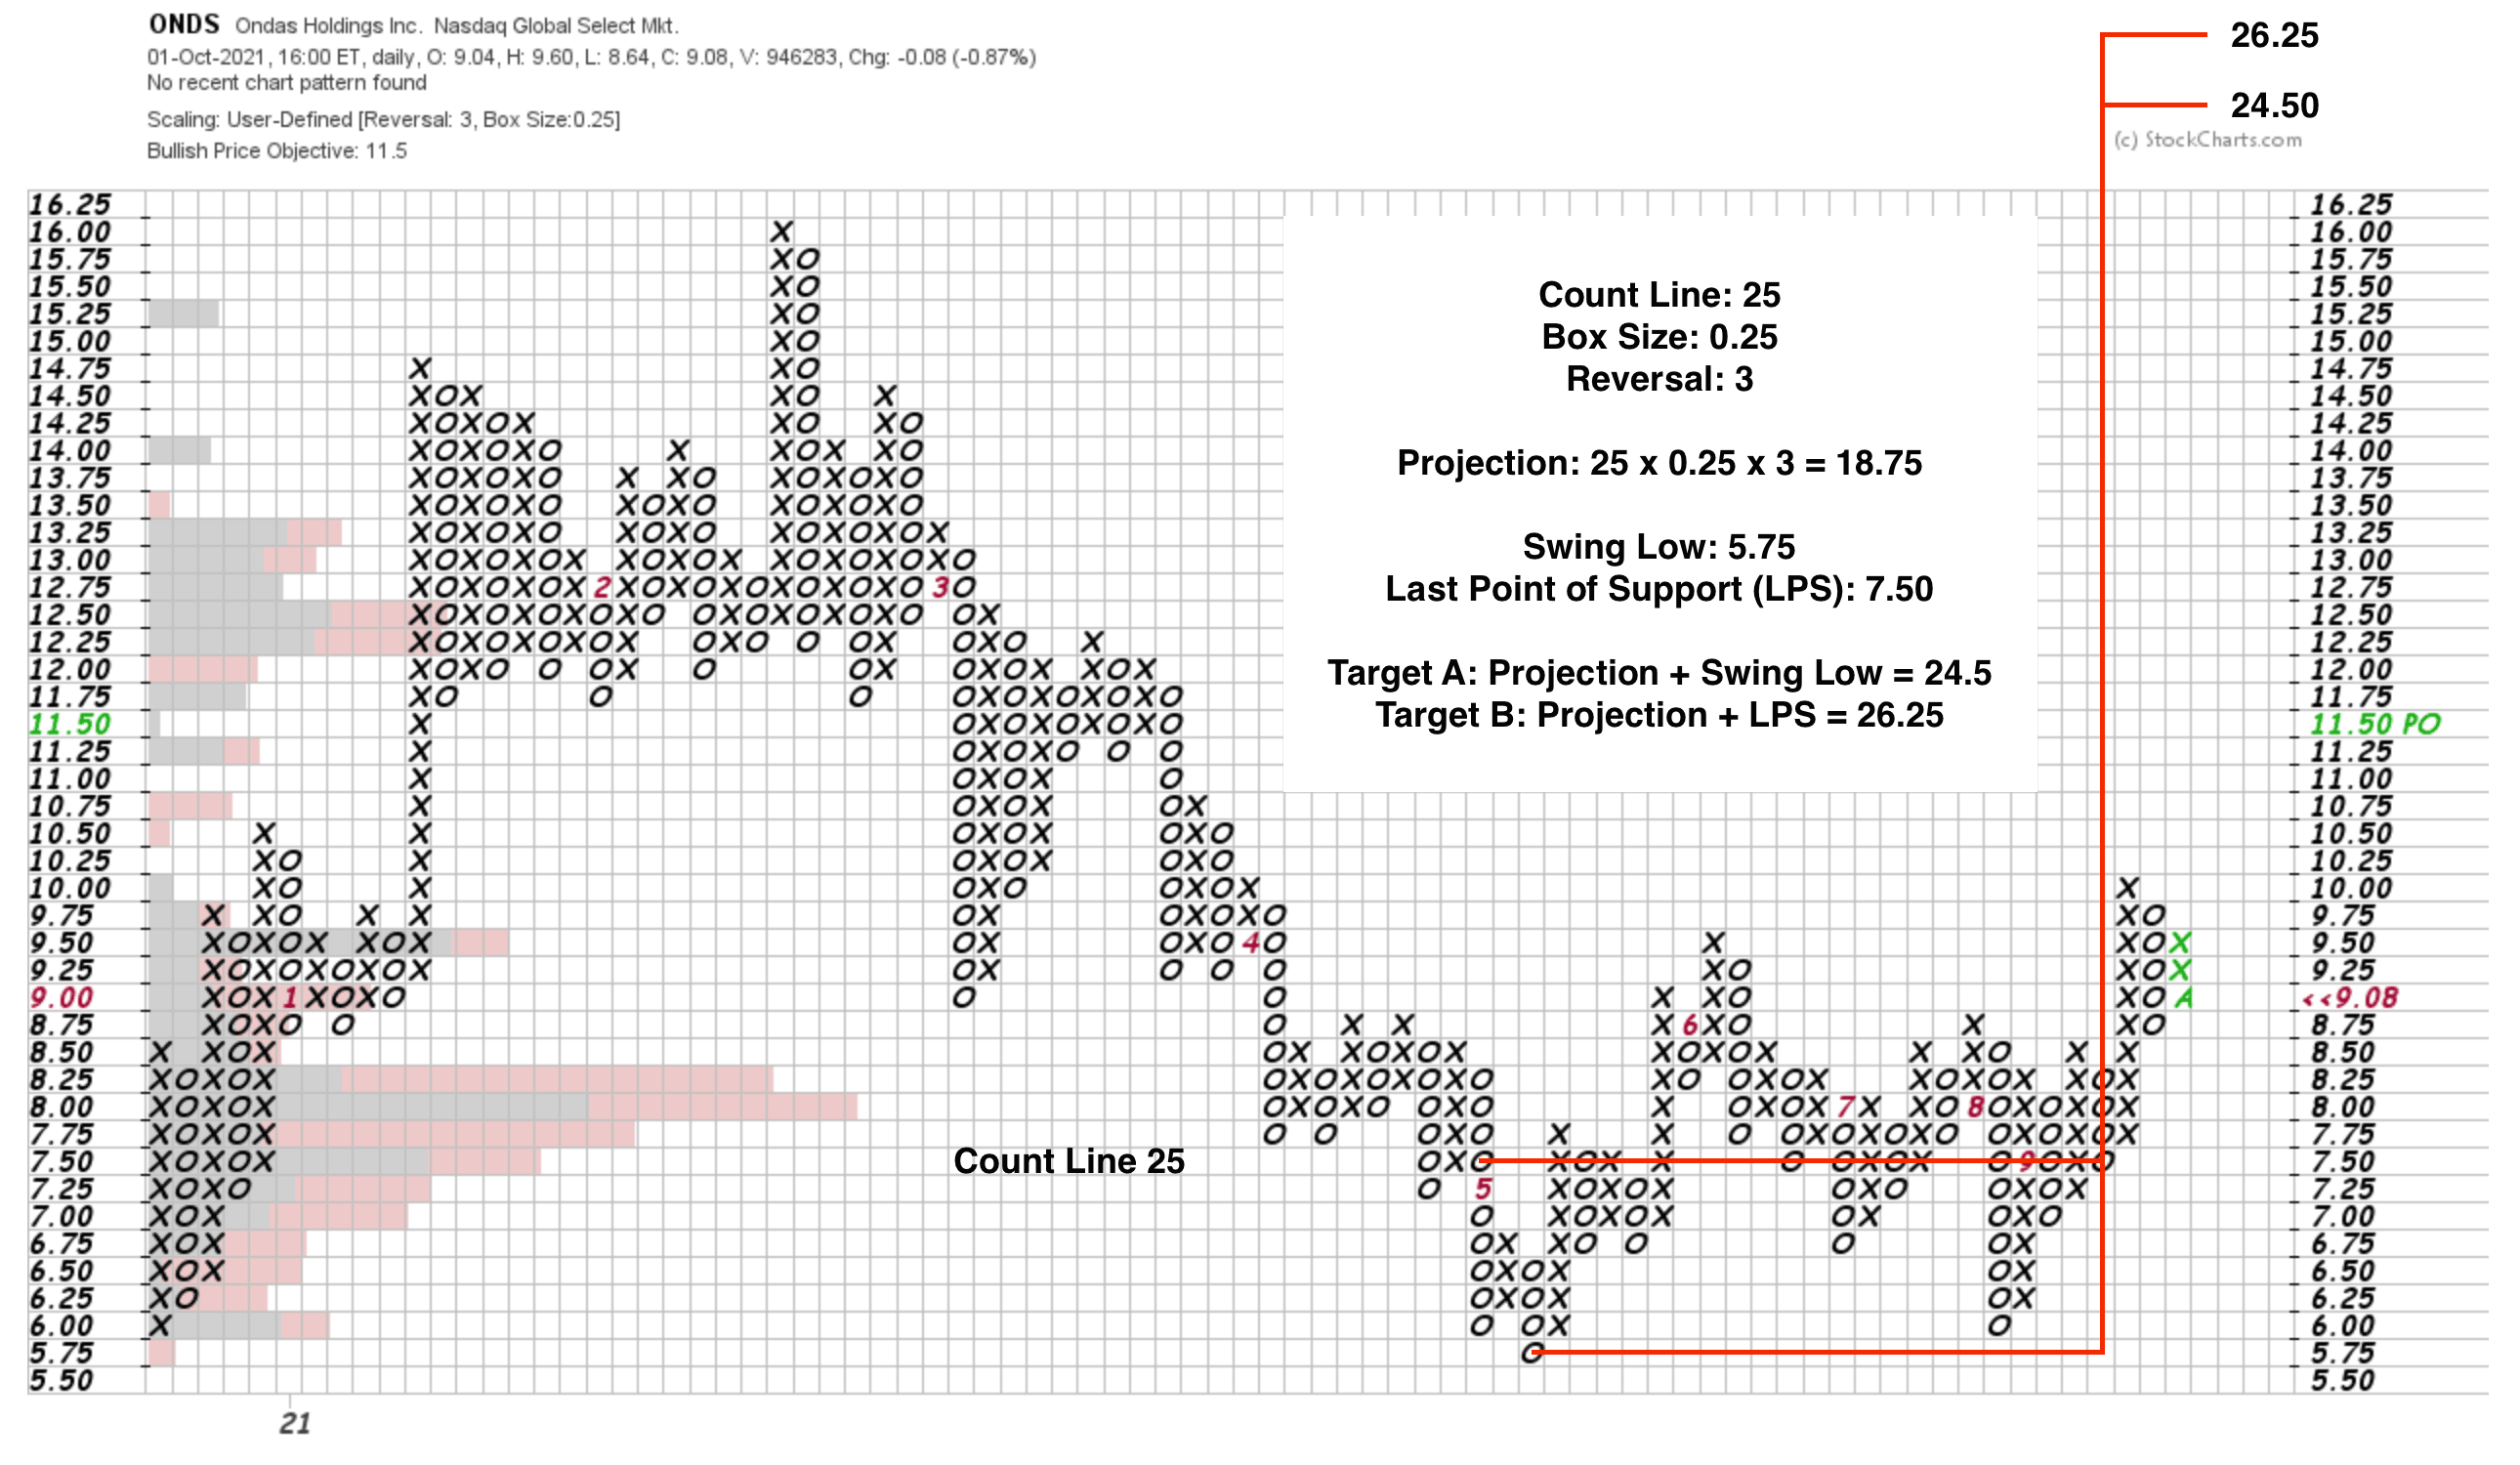
Count Line: 25
Box Size: 0.25
Reversal: 3
Projection: 25 x 0.25 x 3 = 18.75
Swing Low: 5.75
Last Point of Support (LPS): 7.50
Target A: Projection + Swing Low = 24.5
Target B: Projection + LPS = 26.25
*This is the more aggressive larger count, but you could also take smaller counts for more near term targets.
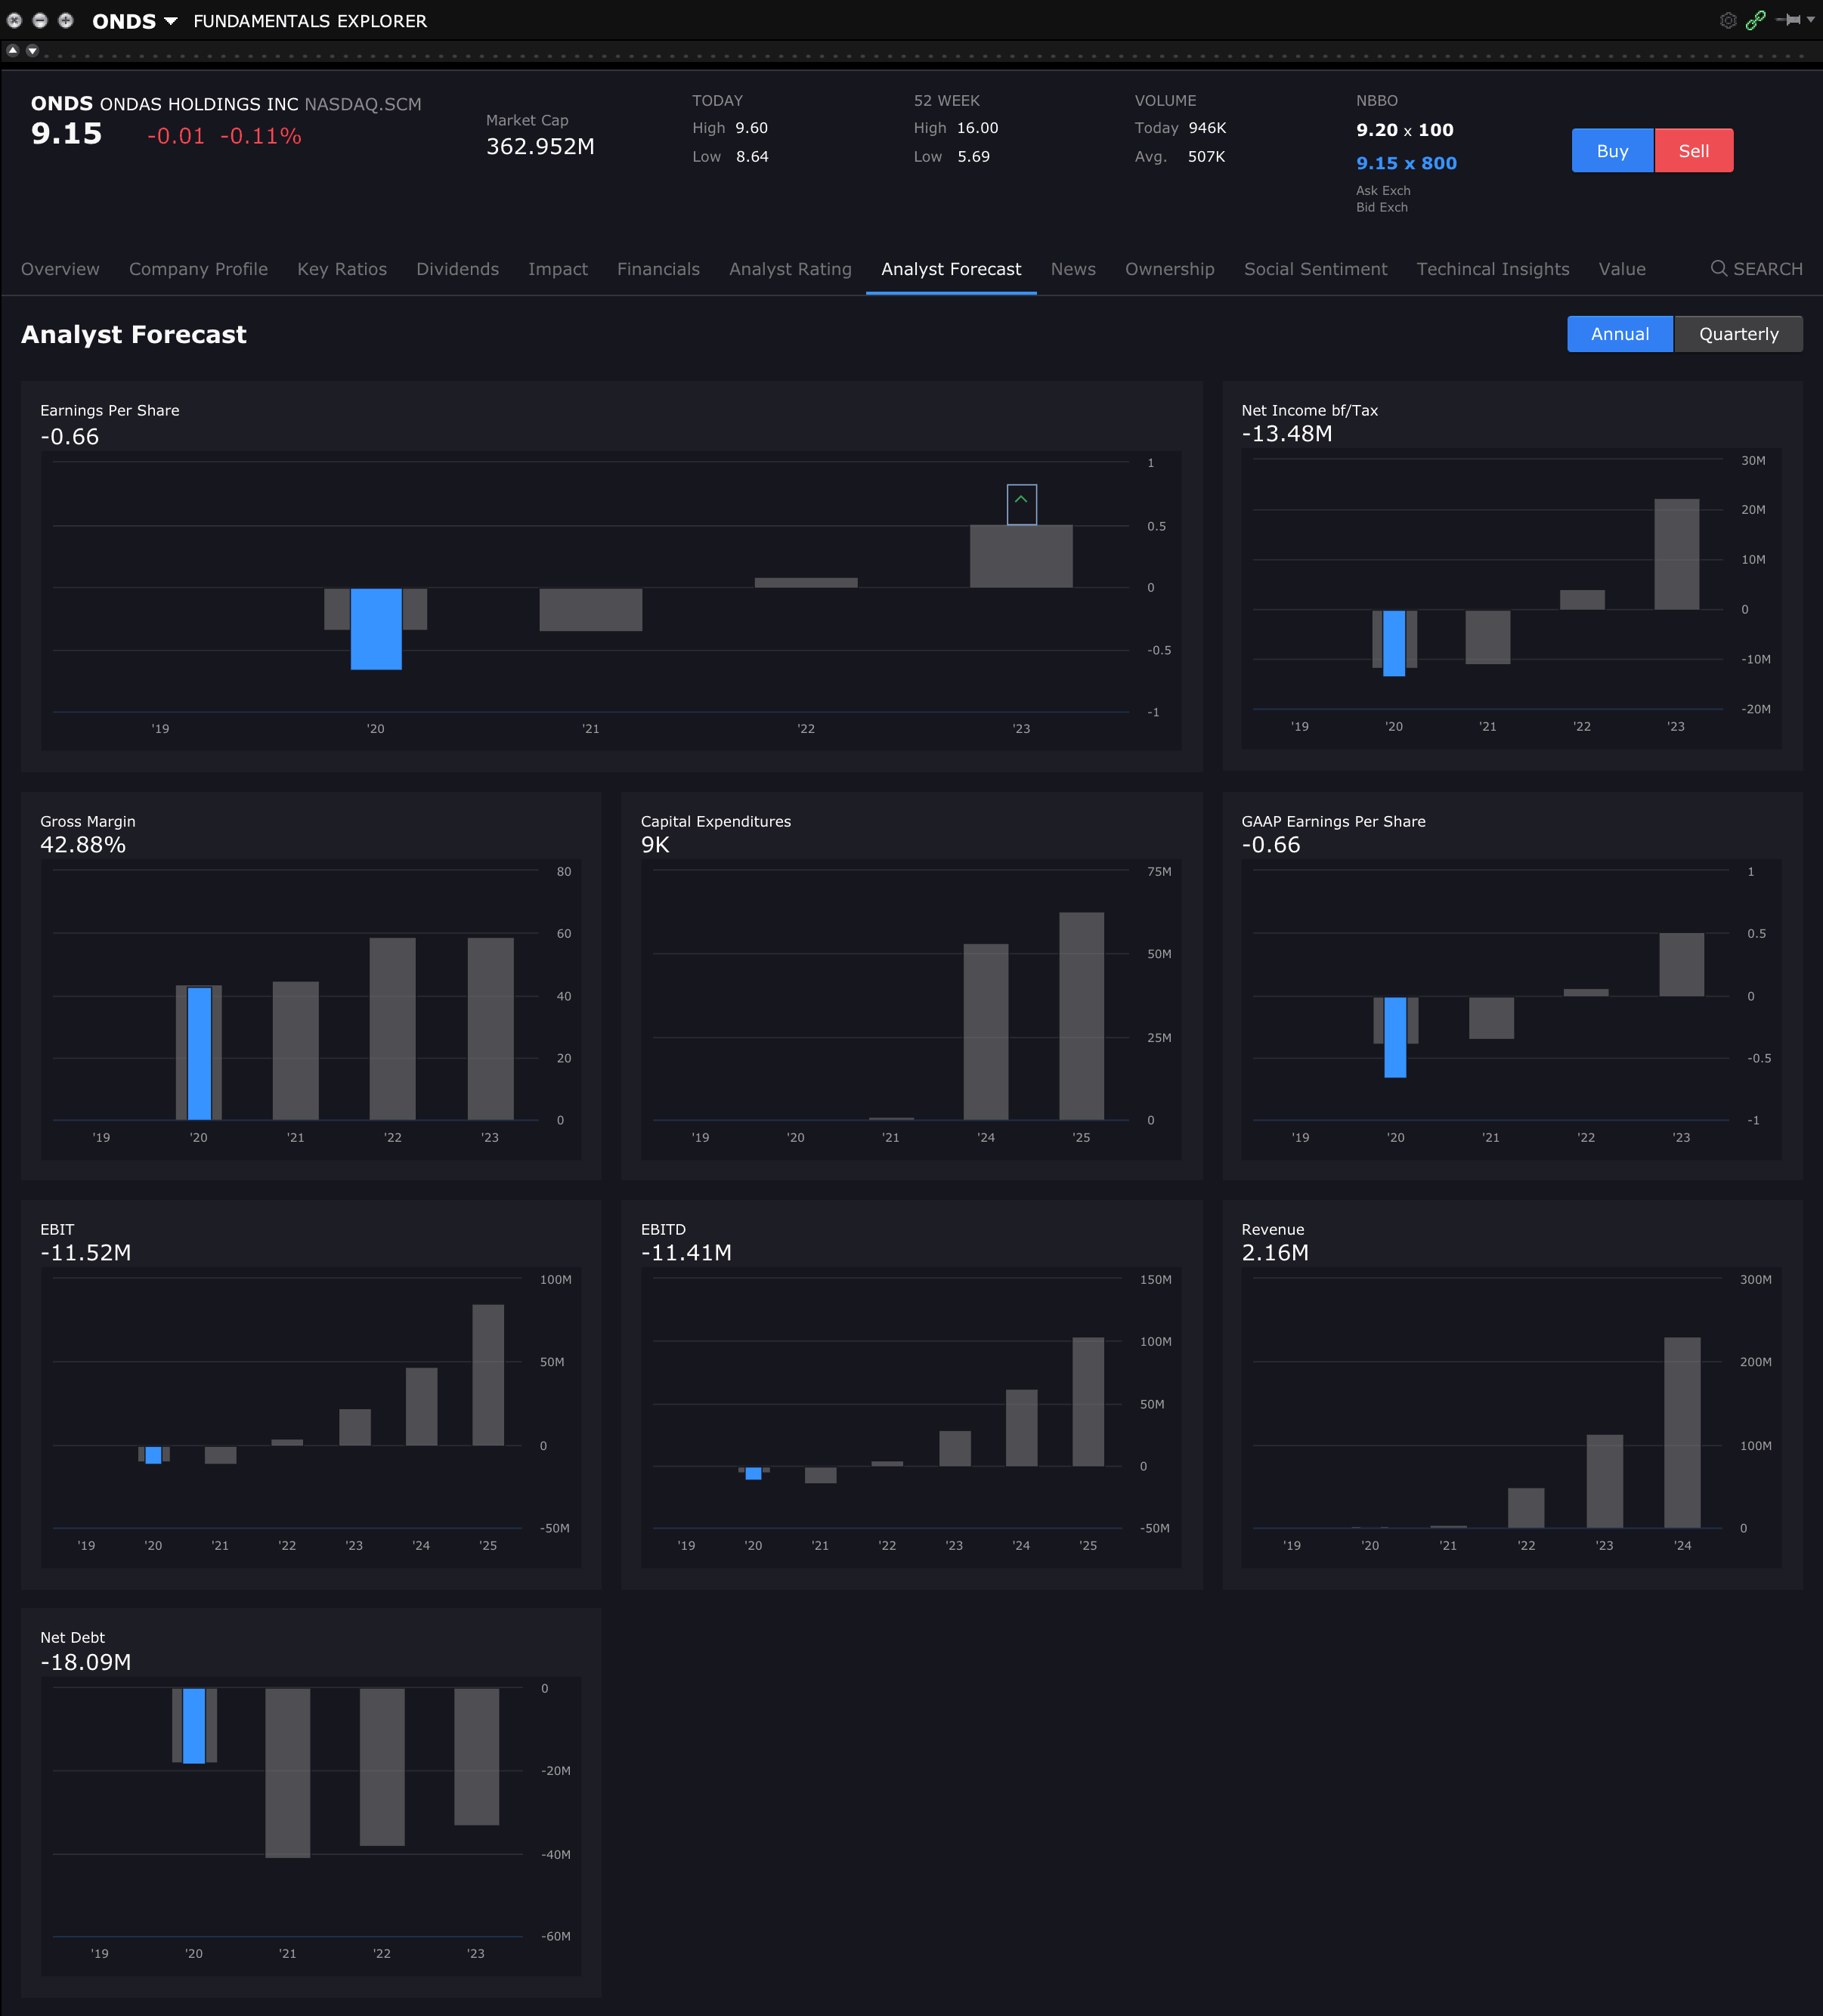
ONDS Stock Annual fundamentals + future estimates
Disclaimer: For educational purpose only. Not investment advice. Seek professional advice from a financial advisor before making any investing decisions.