
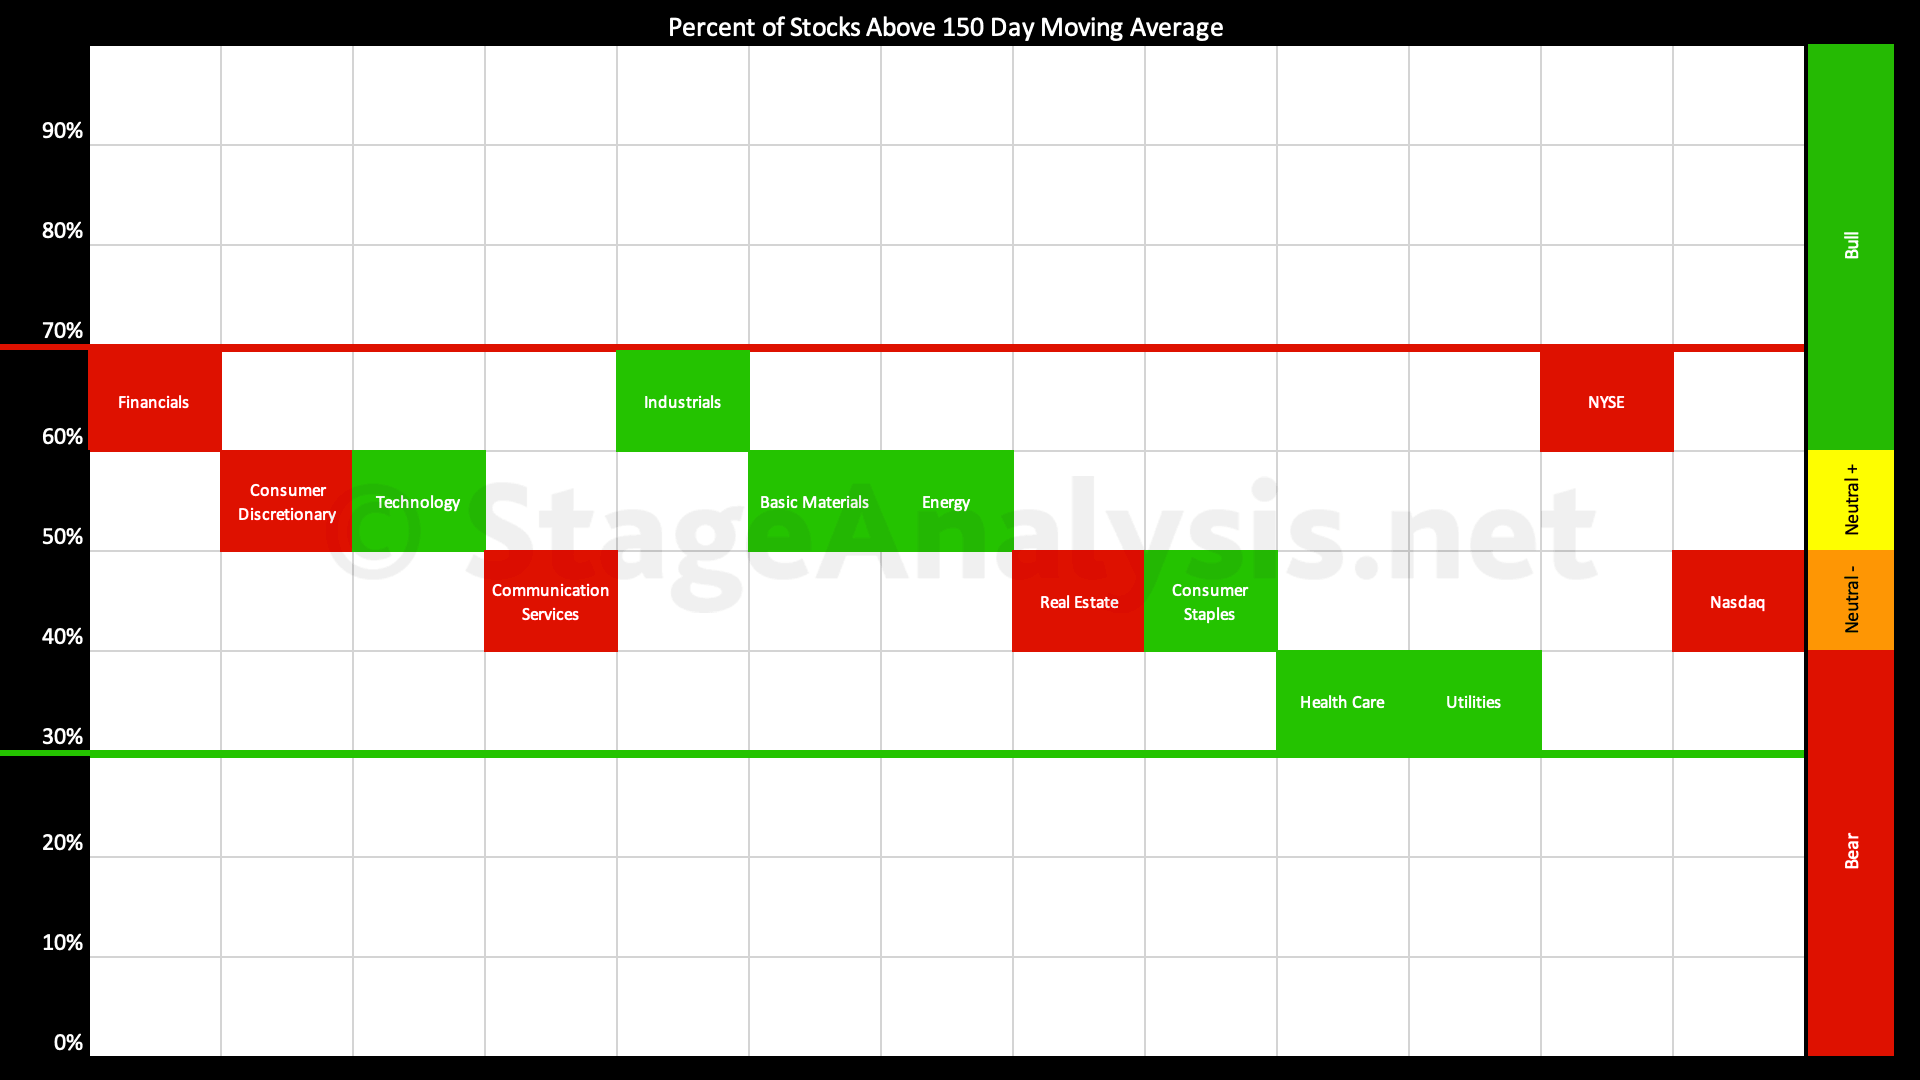
Sector Breadth: Percentage of US Stocks Above Their 150 day (30 Week) Moving Averages
The full post is available to view by members only. For immediate access:
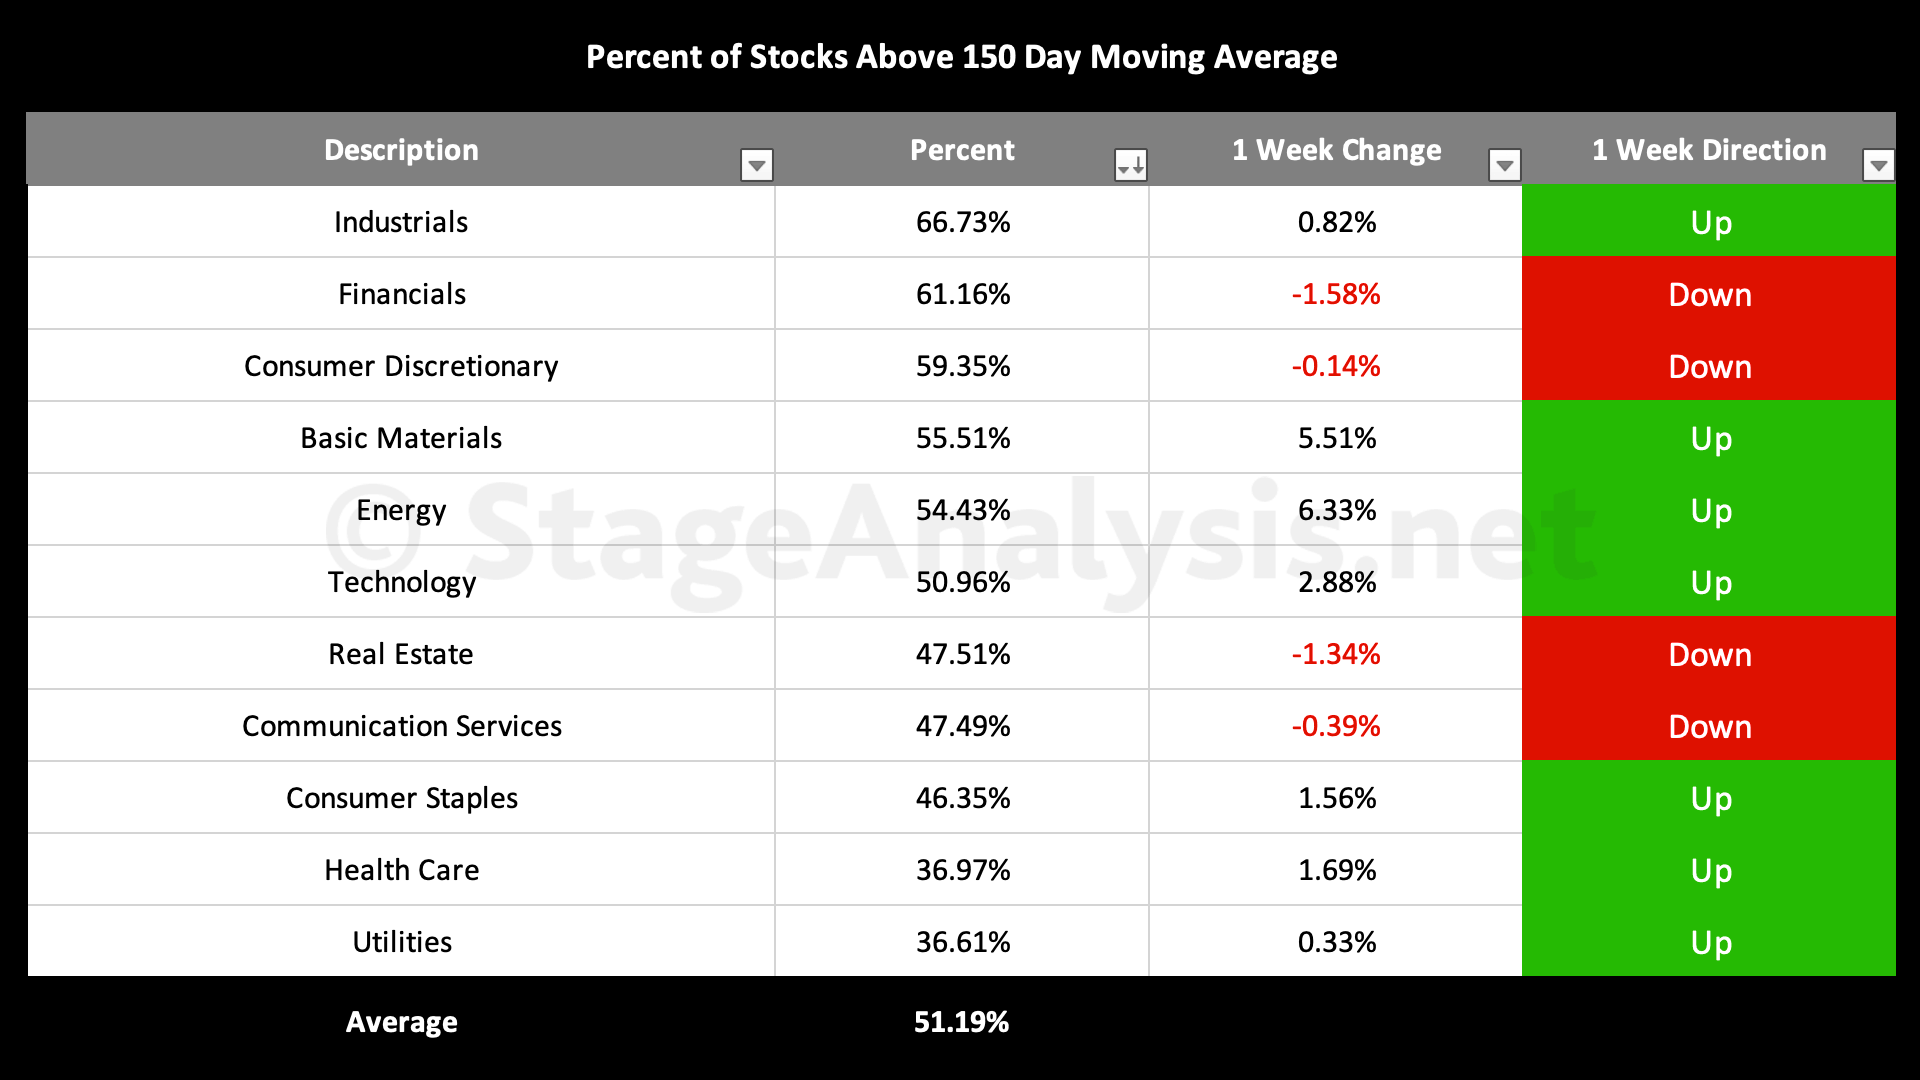
Average: 51.19% (-9.22% 3wks)
- 2 sectors in Stage 2 zone (Industrials, Financials)
- 7 sectors in Stage 1 / 3 zone (Consumer Discretionary, Basic Materials, Energy, Technology, Real Estate, Communication Services, Consumer Staples)
- 2 sectors in Stage 4 zone (Health Care, Utilities)
The Percentage of US Stocks Above Their 150 day Moving Averages in the 11 major sectors has pulled back since the previous post of the 13th February 2023, decreasing by -9.22% to 51.19% overall, which moves it back into the middle of the range, which is the neutral zone.
Sector changes: The sectors in the Stage 2 zone (Above 60%) has deceased from 6 to 2. The sectors in the Stage 1 / 3 zone (40% to 60% range) has increased from 5 to 7, and the number of sectors in the Stage 4 zone (Below 40%) has increased from zero to 2.
The table below shows the weekly change, which had a few areas of strength with Energy and Basic Materials gaining the most, followed by Technology with a more modest 2.88% gain. Financials and Real Estate had the largest of the four declines, but both were fairly modest pullbacks at -1.58% and -1.34%.
Sector Breadth Table – Ordered by Relative Strength
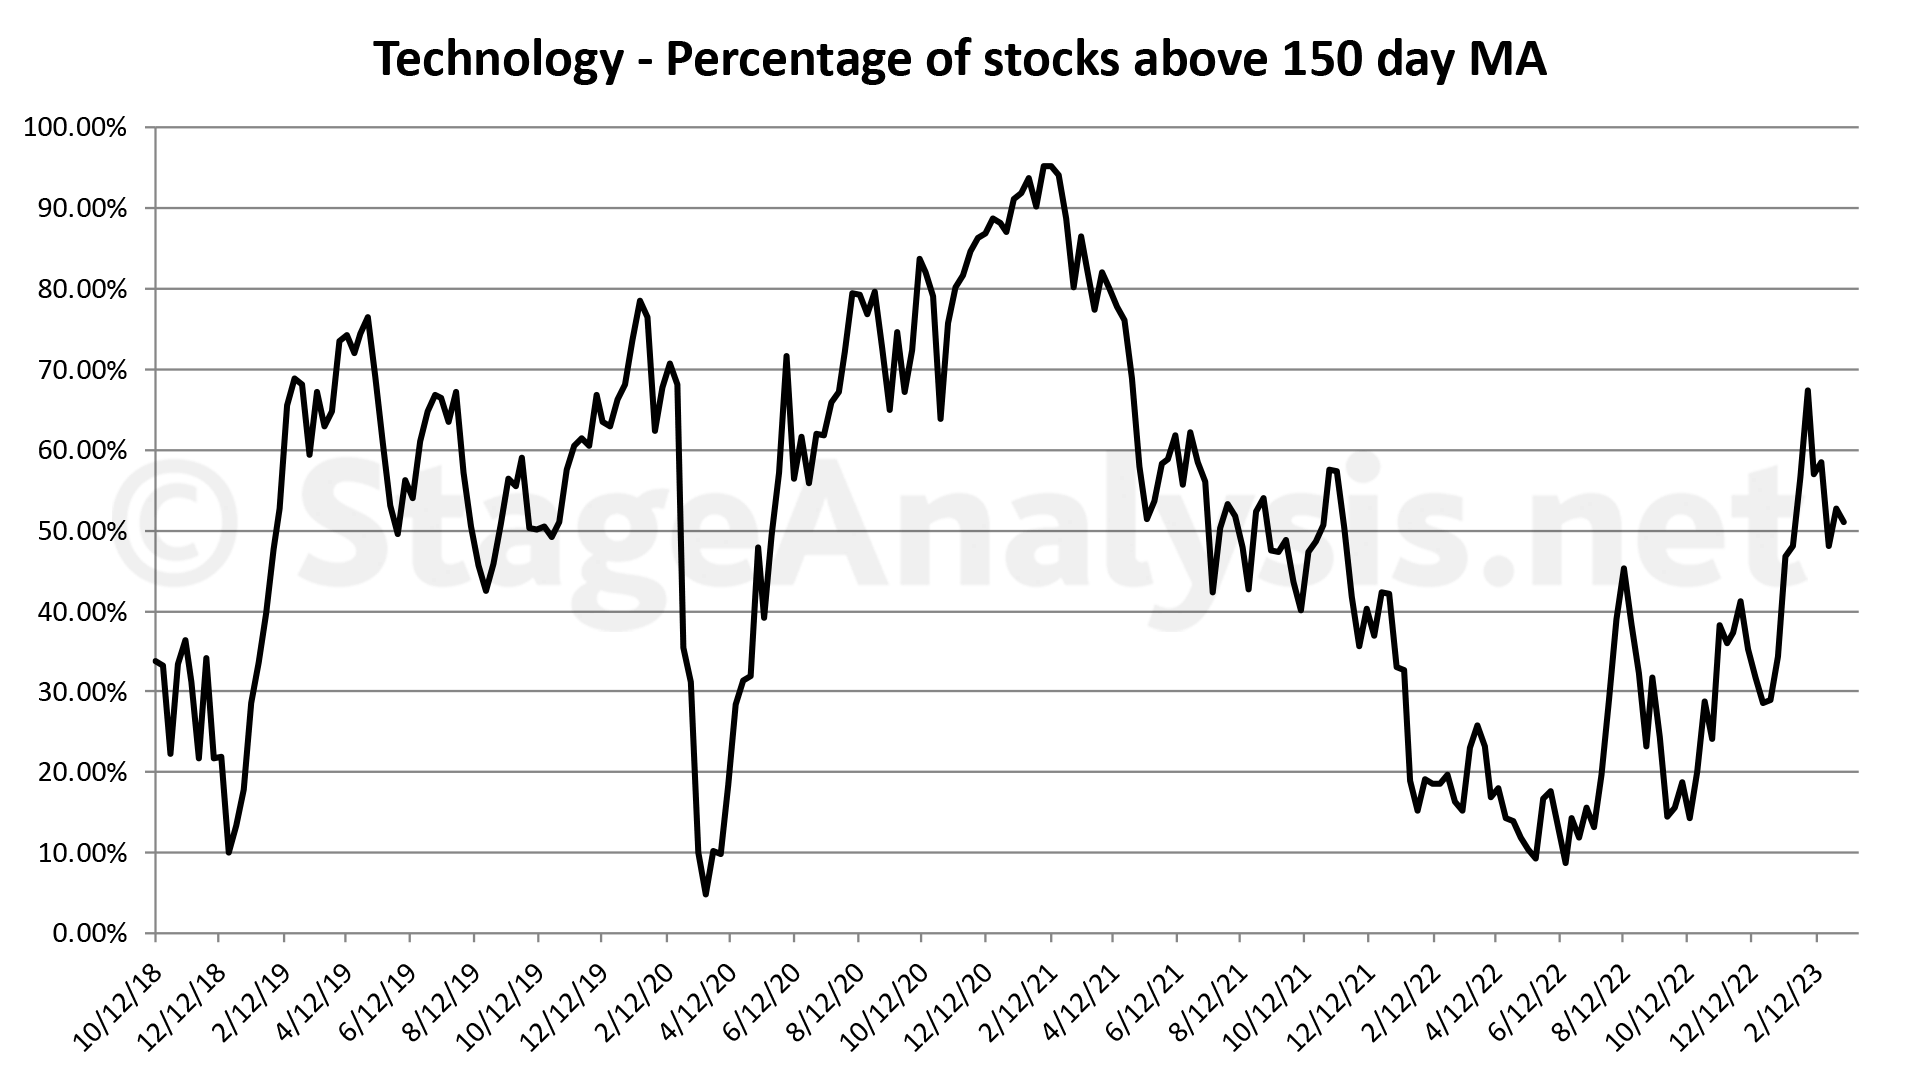
Sector Breadth Charts (Members Only)
Below is the charts for the 11 sectors that shows back to late 2018. Which gives a very clear picture of the overall health of each sector and the market as a whole. (Technology chart shown as an example)
Become a Stage Analysis Member:
To see more like this – US Stocks watchlist posts, detailed videos each weekend, use our unique Stage Analysis tools, such as the US Stocks & ETFs Screener, Charts, Market Breadth, Group Relative Strength and more...
Join Today
Disclaimer: For educational purpose only. Not investment advice. Seek professional advice from a financial advisor before making any investing decisions.