
$SNAP - Stage 2 Continuation Breakout to New Highs
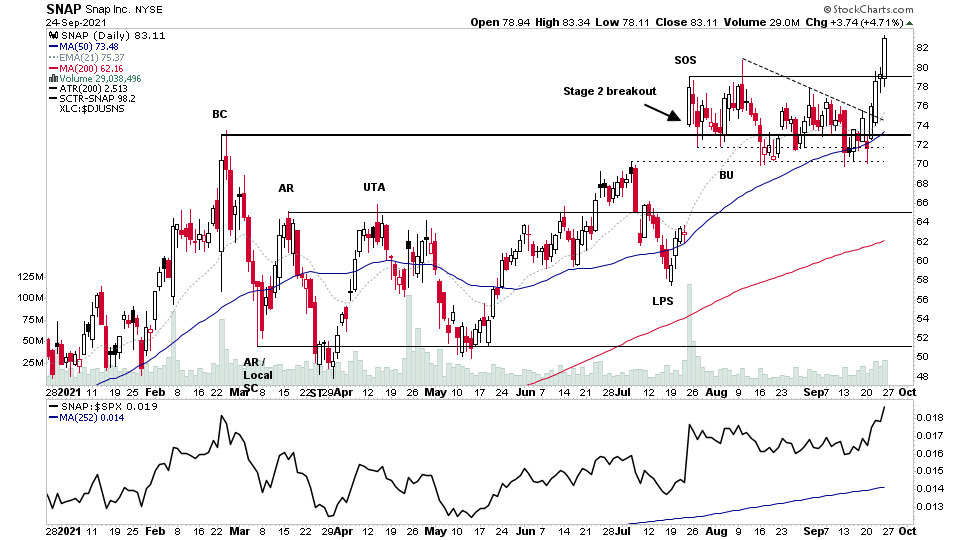
SNAP make a Stage 2 continuation breakout to new highs this week following a 9 week consolidation period from the major Stage 2 breakout attempt back in July, where it gapped up from the major base structure on significant volume following its earnings announcement.
So if you look at the daily chart above it shows up as a Sign of Strength (SOS) rally which moved SNAP into Phase D of its base structure and since has been forming a major Backup (BU) and has consolidated mostly above the prior trading range and rising 50 day MA with generally average or below average volume.
The last few weeks saw an uptick in volume as it failed to commit below the support from the 6 July high and 16 August low, with a price bar that had a large spread and tested the 50 day MA. So it looked bearish, but acted bullish, with the failure to commit below that prior support and then reversed higher in the coming days, with a few further tests that made higher lows, before breaking out of the lower part of the structure on increasing volume.
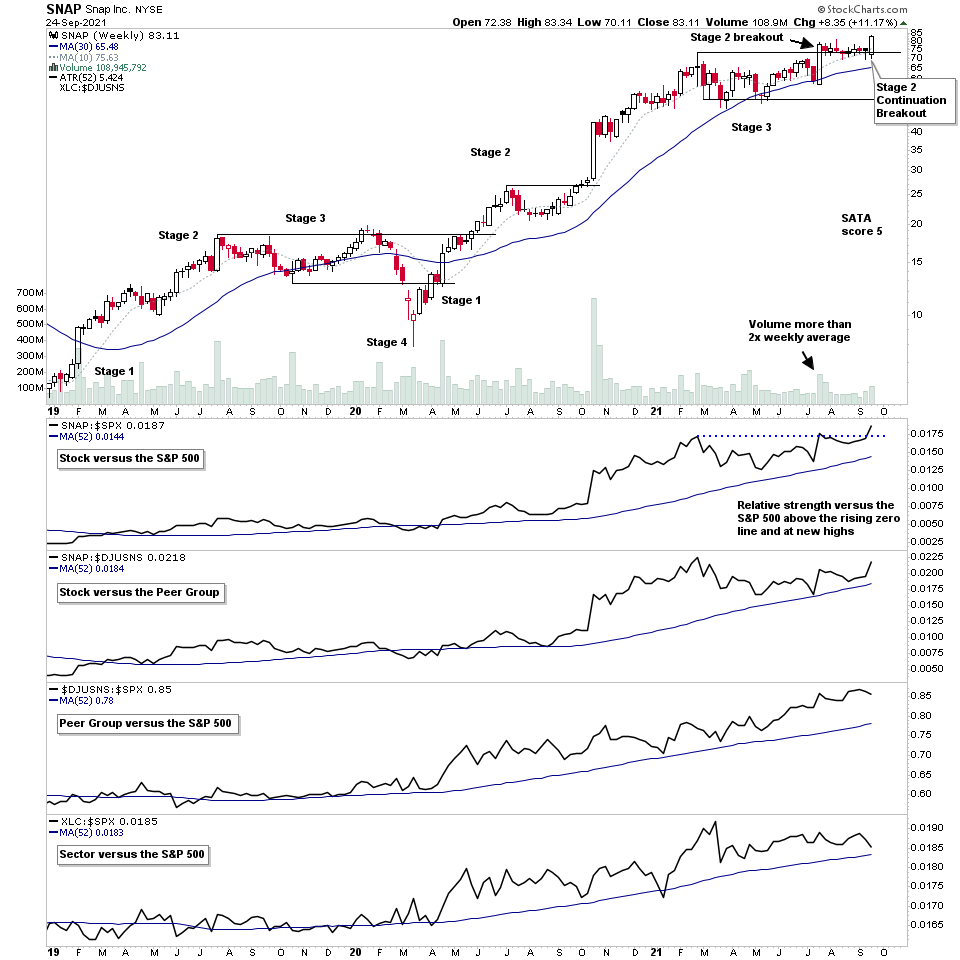
The weekly chart shows the tightness of the secondary consolidation base over the last 9 weeks, which I'm interpreting as a sign of accumulation by larger players (institutional).
The Stage Analysis Technical Attributes (SATA) score is a 5. Which is the maximum score, as it's in Stage 2, and outperforming the S&P 500, outperforming its peer group (internet), and the peer group is outperforming the S&P 500 too, and the sector is also outperforming the S&P 500. Although in the very near term the sector is underperforming. But it remains above the rising "zero line" (52 week RS MA), which is the measure used to judge outperformance or underperformance, and so remains as outperforming overall.
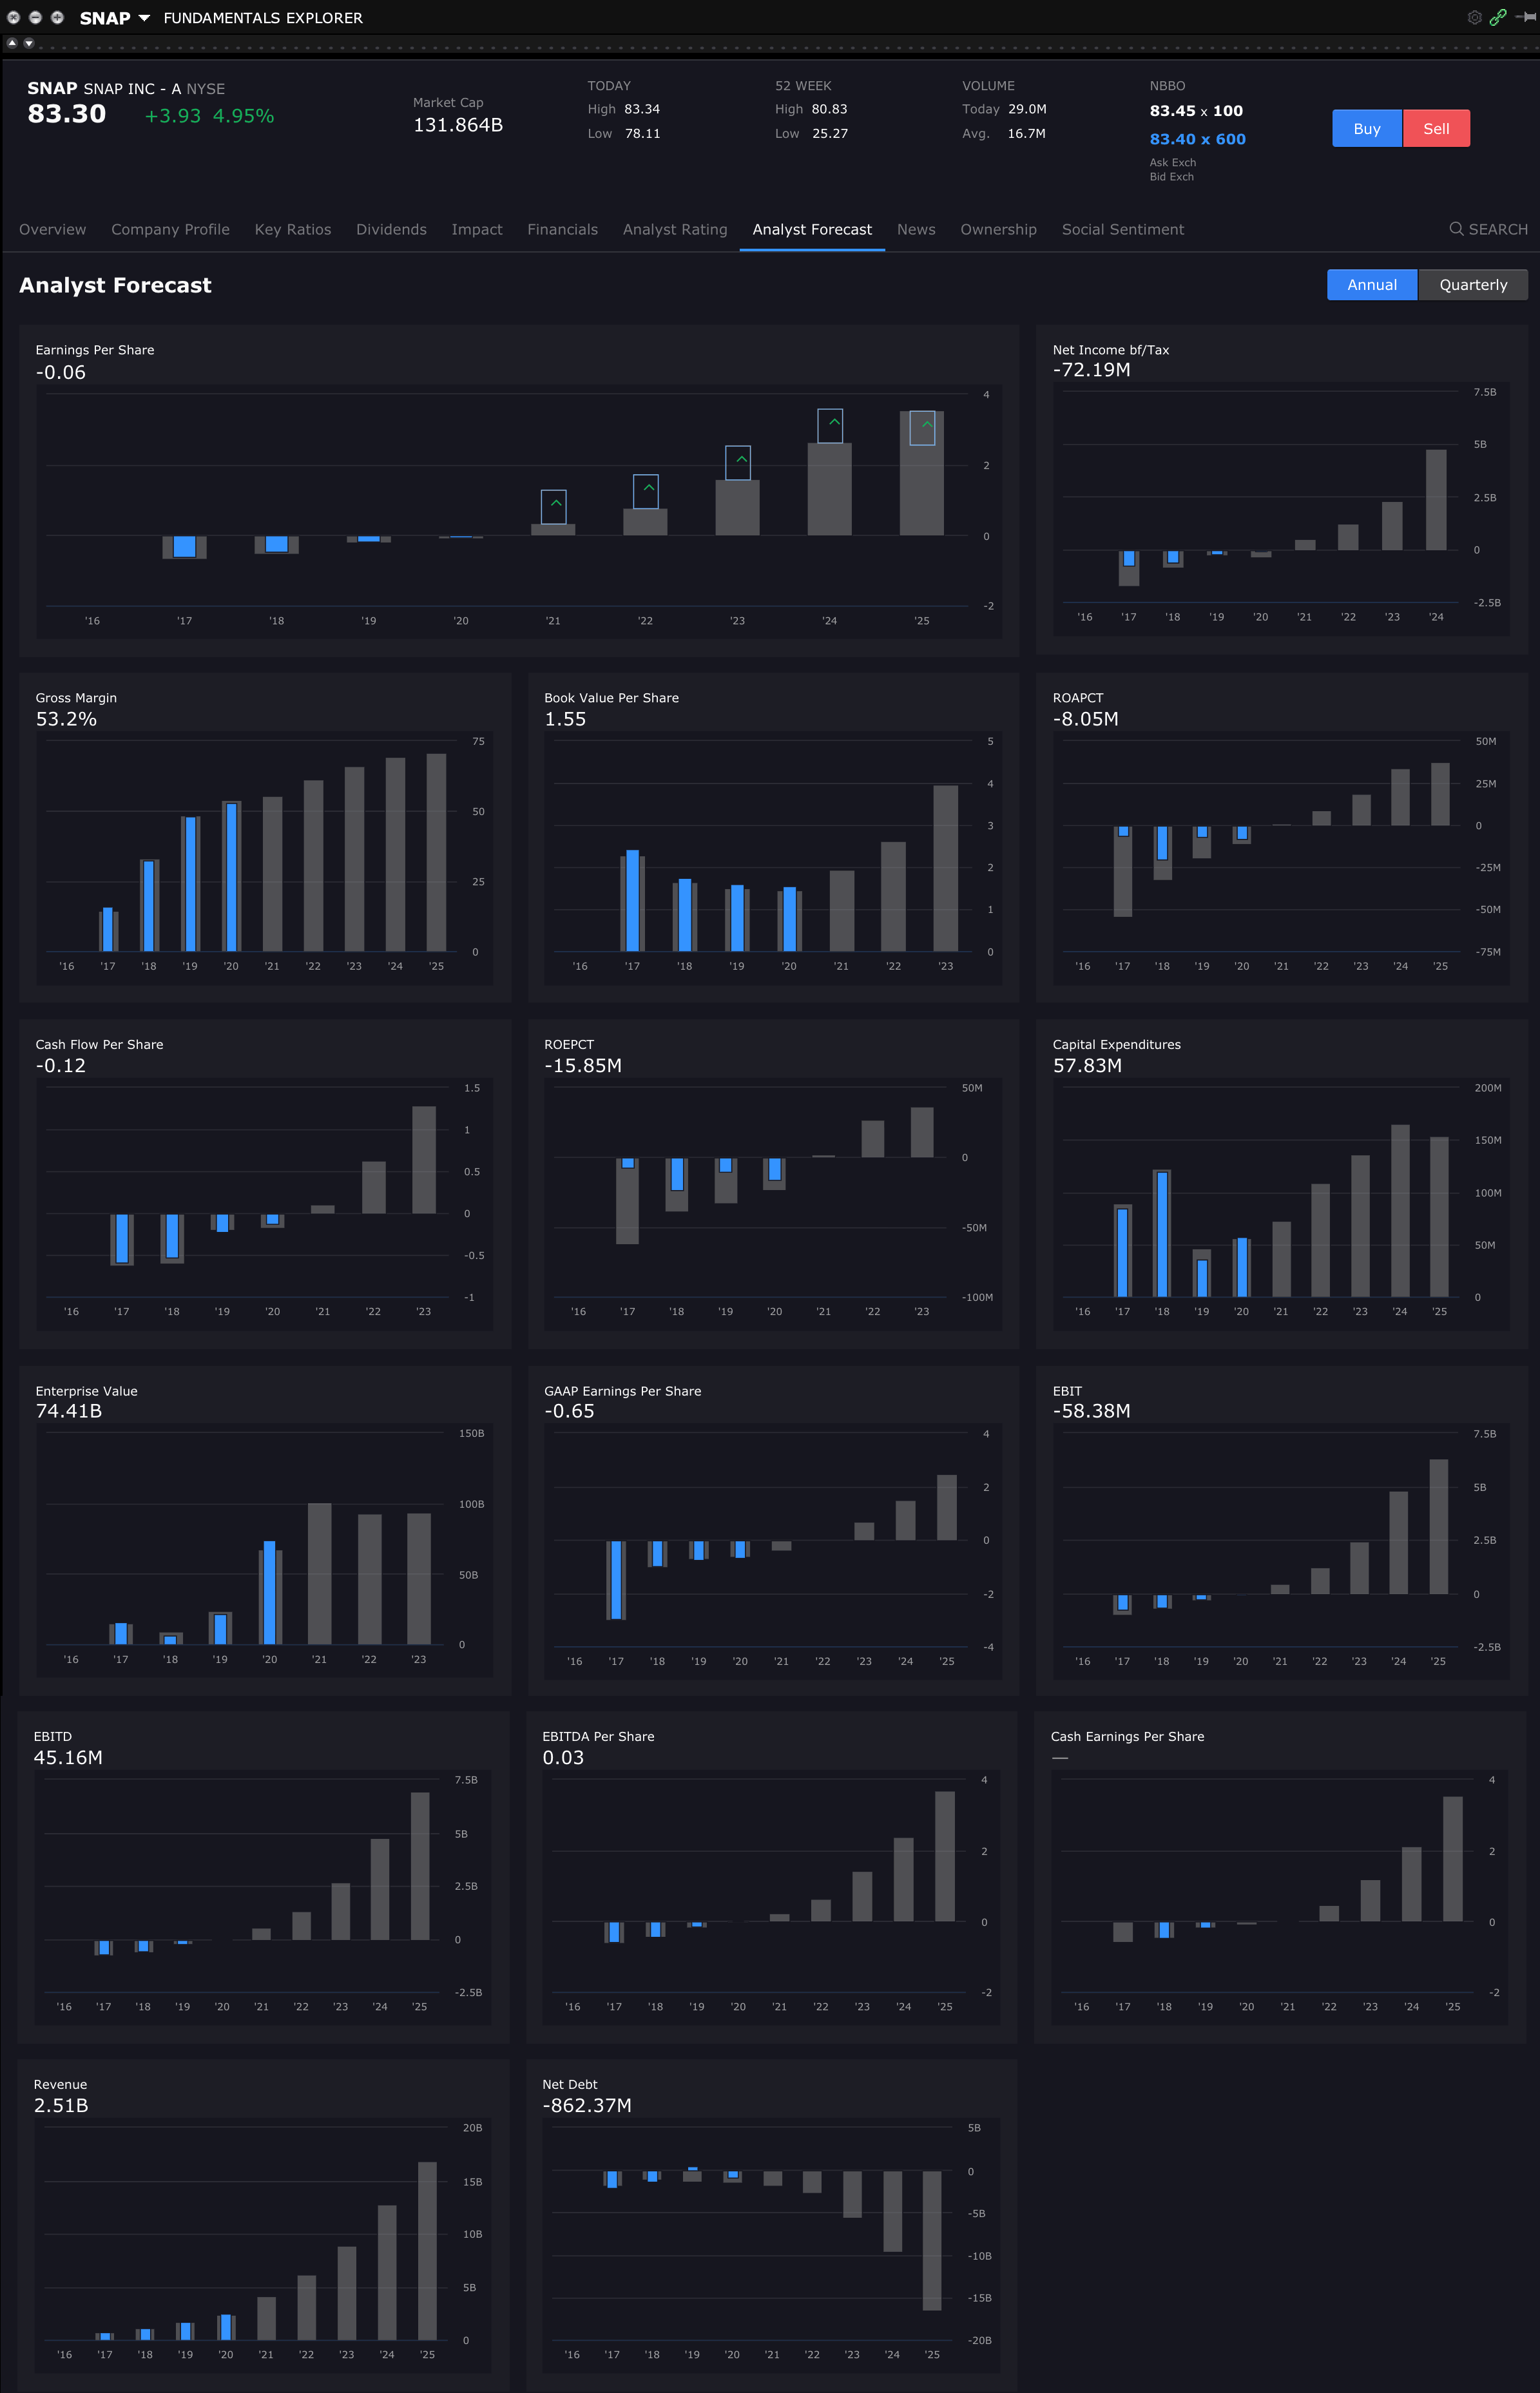
The Wyckoff method can be used to generate potential price targets. So see further down in the post to see those as the major base structure has built up a significant cause and also the annual fundamentals data also which shows strong projected growth in the coming years.
Become a Stage Analysis Member:
To see more like this – US Stocks watchlist posts, detailed videos each weekend, use our unique Stage Analysis tools, such as the US Stocks & ETFs Screener, Charts, Market Breadth, Group Relative Strength and more...
Join Today
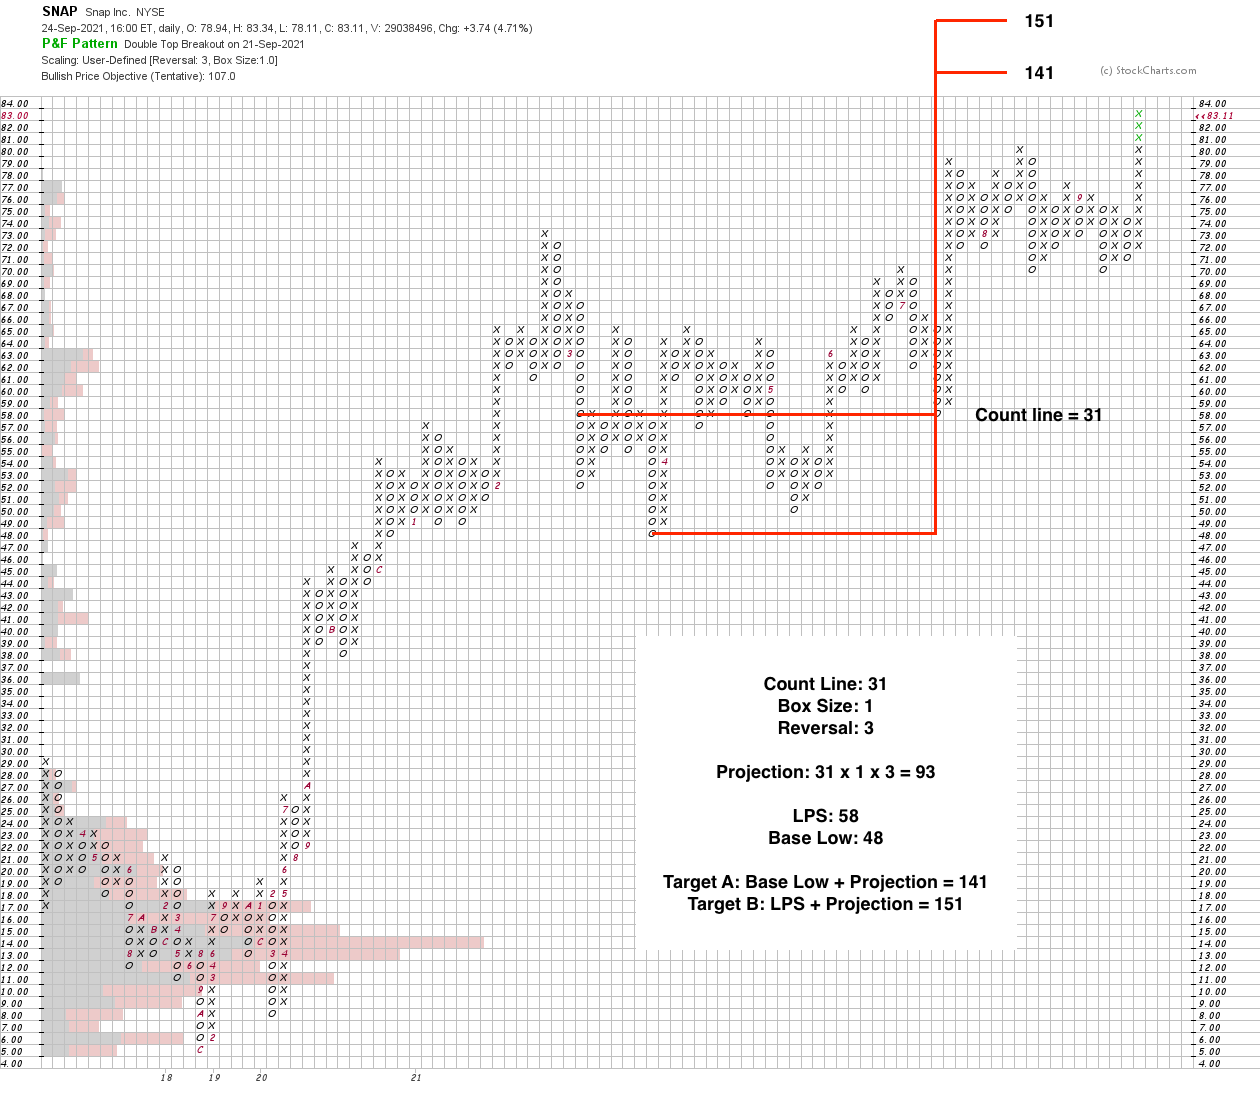
SNAP Stock Point & Figure Horizontal Price Target (Wyckoff method)
The Wyckoff method P&F horizontal count line is 31 columns with a 1 box size by 3 reversal chart. Which added onto the Base Low at 48 and the Last Point of Support (LPS) at 58, gives a target range of 141 to 151. Hence the potential Cause from the major base is around 70%+ from the current price level.*
Count Line: 31
Box Size: 1
Reversal: 3
Projection: 31 x 1 x 3 = 93
LPS: 58
Base Low: 48
Target A: Base Low + Projection = 141
Target B: LPS + Projection = 151
*This is the more aggressive larger count, but you could also take smaller counts from the more recent consolidation base since the breakout, or from the smaller structures from within the major base for nearer term target generation.
SNAP Stock Annual fundamentals + future estimates
Disclaimer: For educational purpose only. Not investment advice. Seek professional advice from a financial advisor before making any investing decisions.