
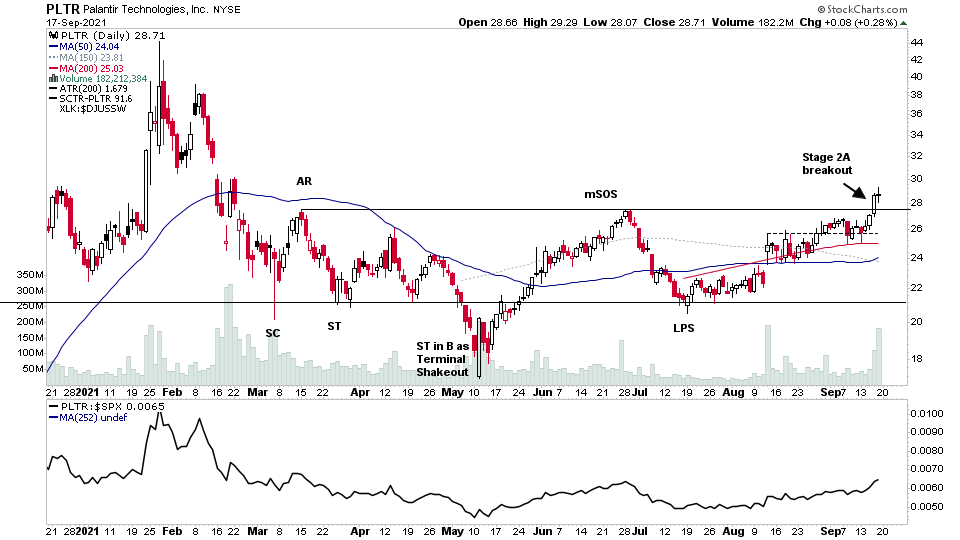
$PLTR - Stage 2 Breakout
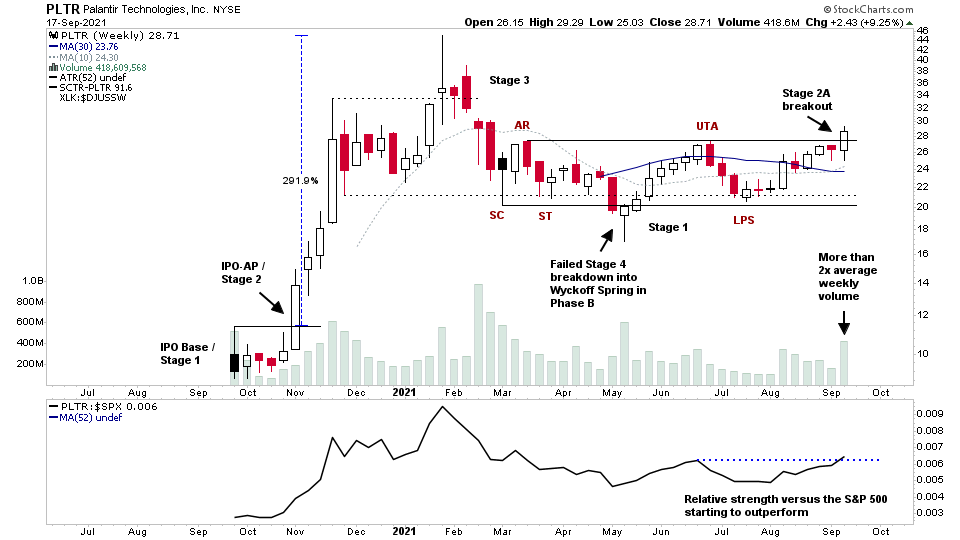
PLTR made a Stage 2A breakout this week on more than 2x the average weekly volume, which is one of the key criteria that we look for in the Stage Analysis method in order to differentiate between the high quality and low quality breakouts. The other key criteria are, Relative Strength versus the S&P 500 outperforming, Relative Strength versus the Peer Group outperforming and for the stock to have no near term resistance (six months or more of basing is a good rough guide for this).
So with this weeks breakout, PLTR now meets the Stage Analysis method higher quality criteria, and so the expectation would be for the Stage 2 advancing phase to develop. There's no guarantee of this, and even if it does, it could take many months to get moving, as early Stage 2 breakouts are often short term extended and so need a backing up period to consolidate, and so risk management via position sizing and stop loss positioning is an important consideration if you do attempt to trade it.
Always consider your risk first when considering a potential trade. However good it looks on the charts.
Become a Stage Analysis Member:
To see more like this – US Stocks watchlist posts, detailed videos each weekend, use our unique Stage Analysis tools, such as the US Stocks & ETFs Screener, Charts, Market Breadth, Group Relative Strength and more...
Join Today
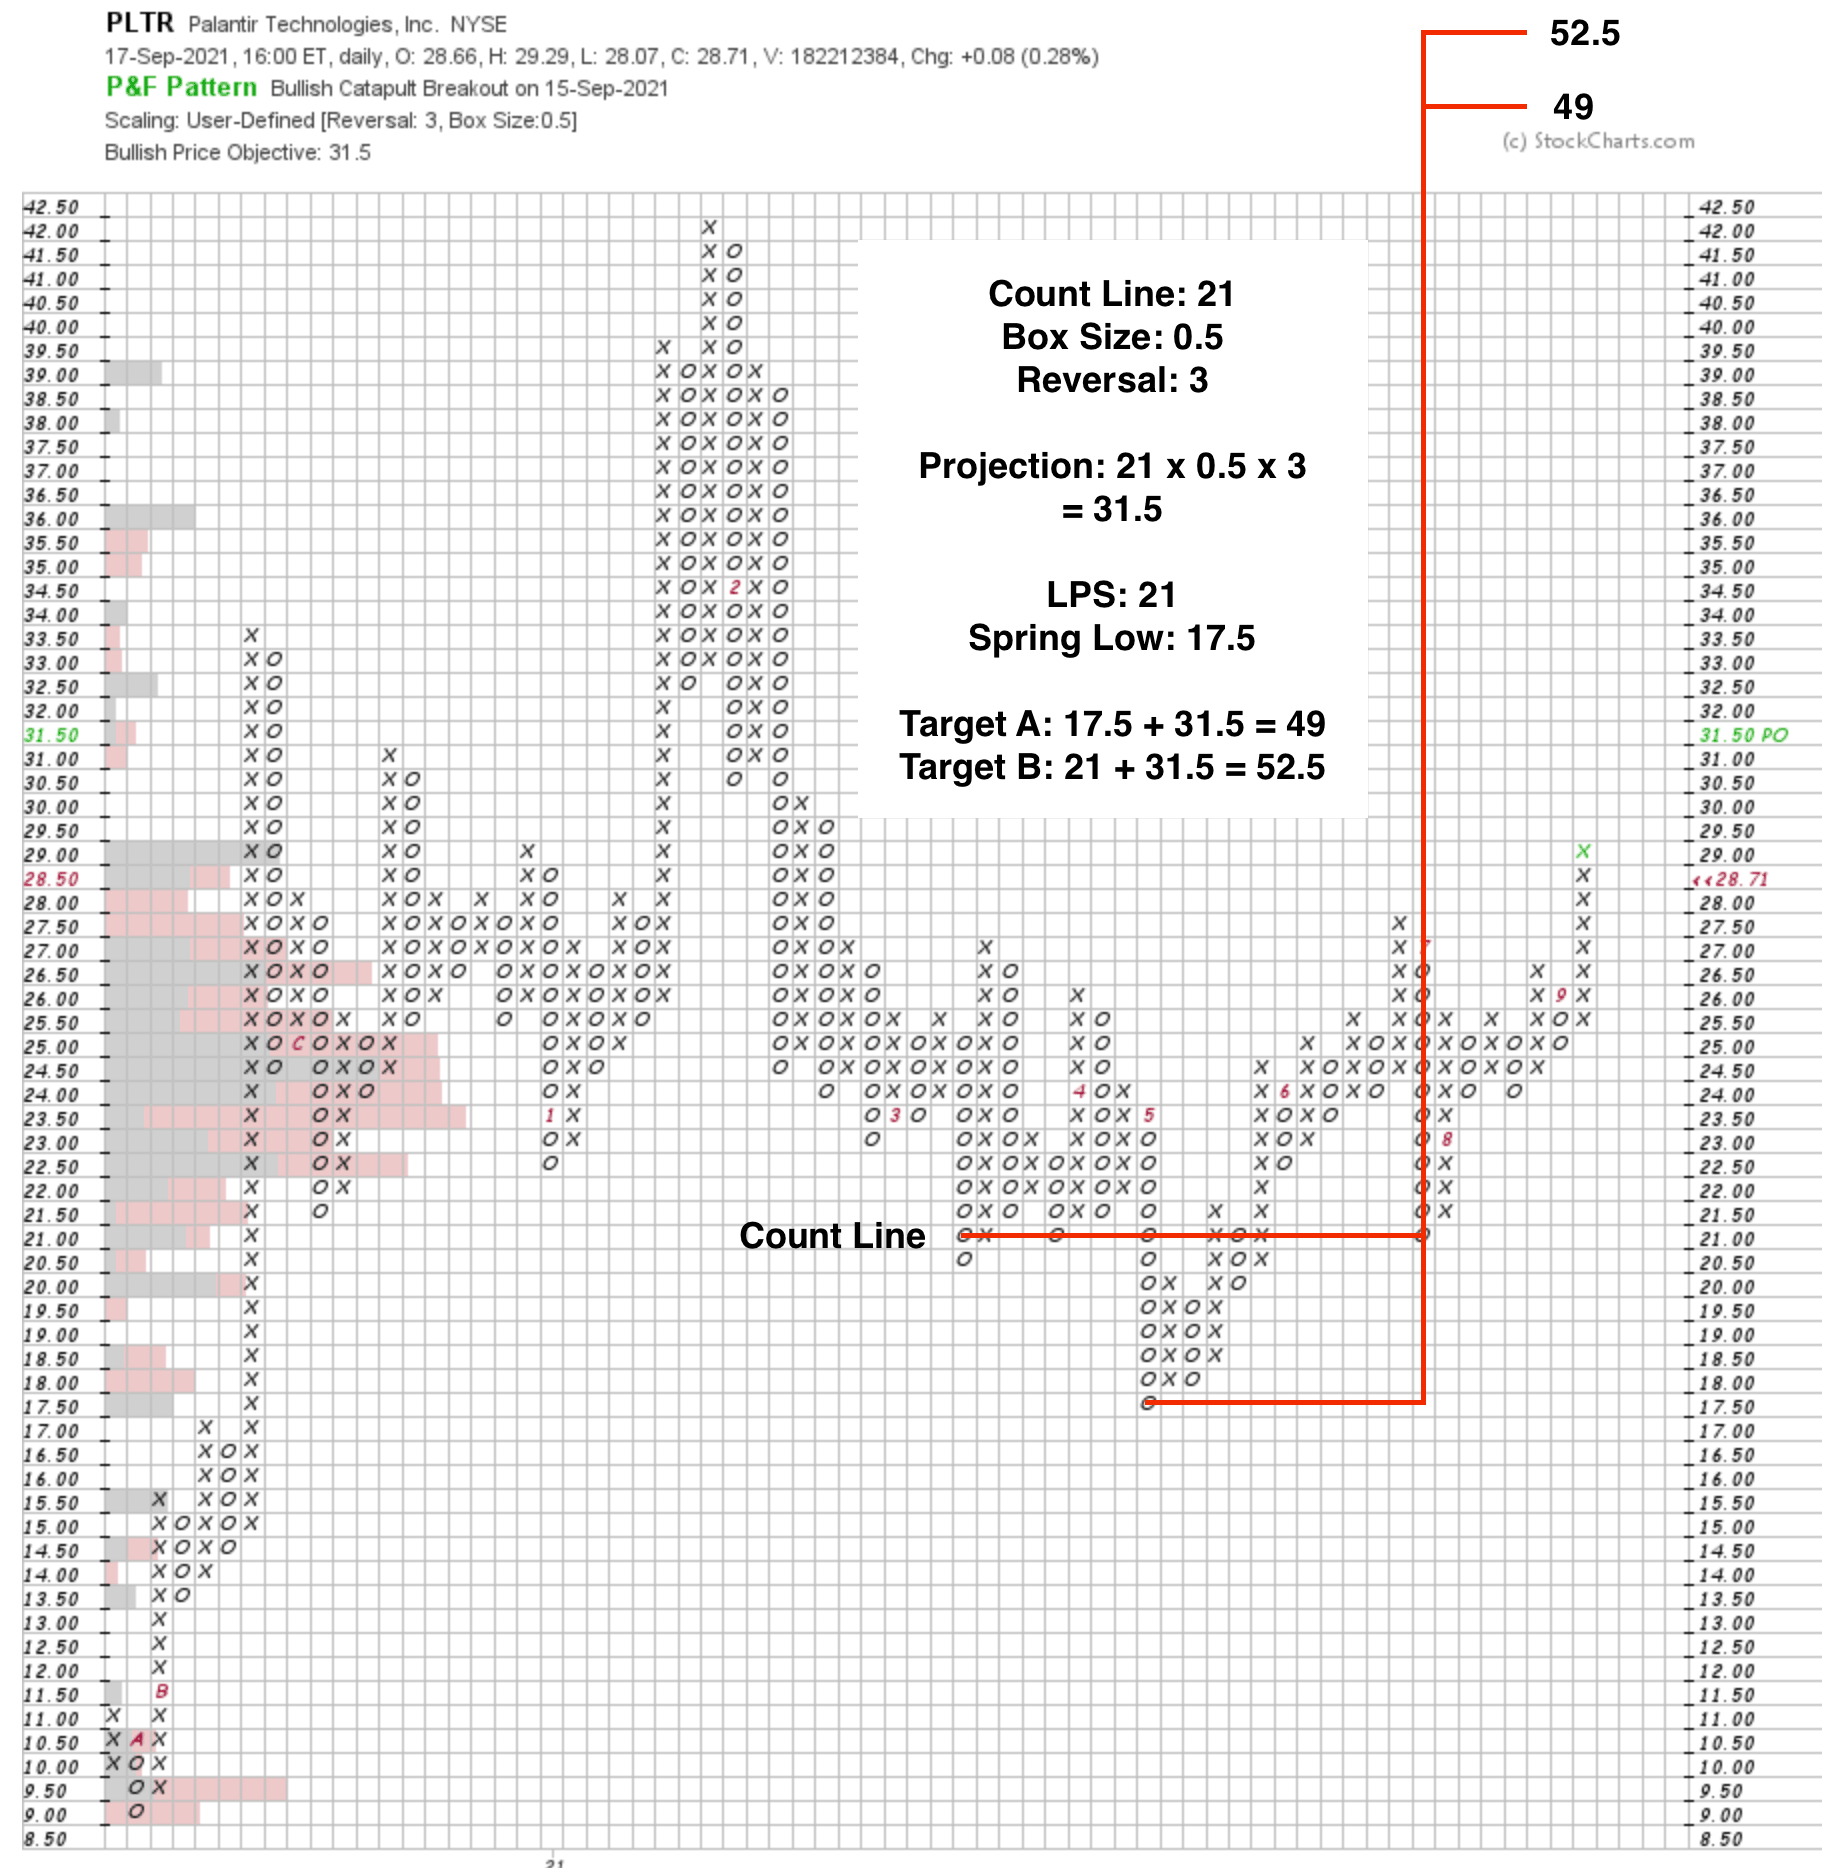
PLTR Stock Point & Figure Horizontal Price Target (Wyckoff method)
The Wyckoff method P&F horizontal count line is 21 columns with a 0.5 box size by 3 reversal chart. Which added onto the Spring Low at 17.5 and the Last Point of Support (LPS) at 21, gives a target range of 49 to 52.5. Hence the potential Cause from the 6 month base is 70%+ from the current price level.
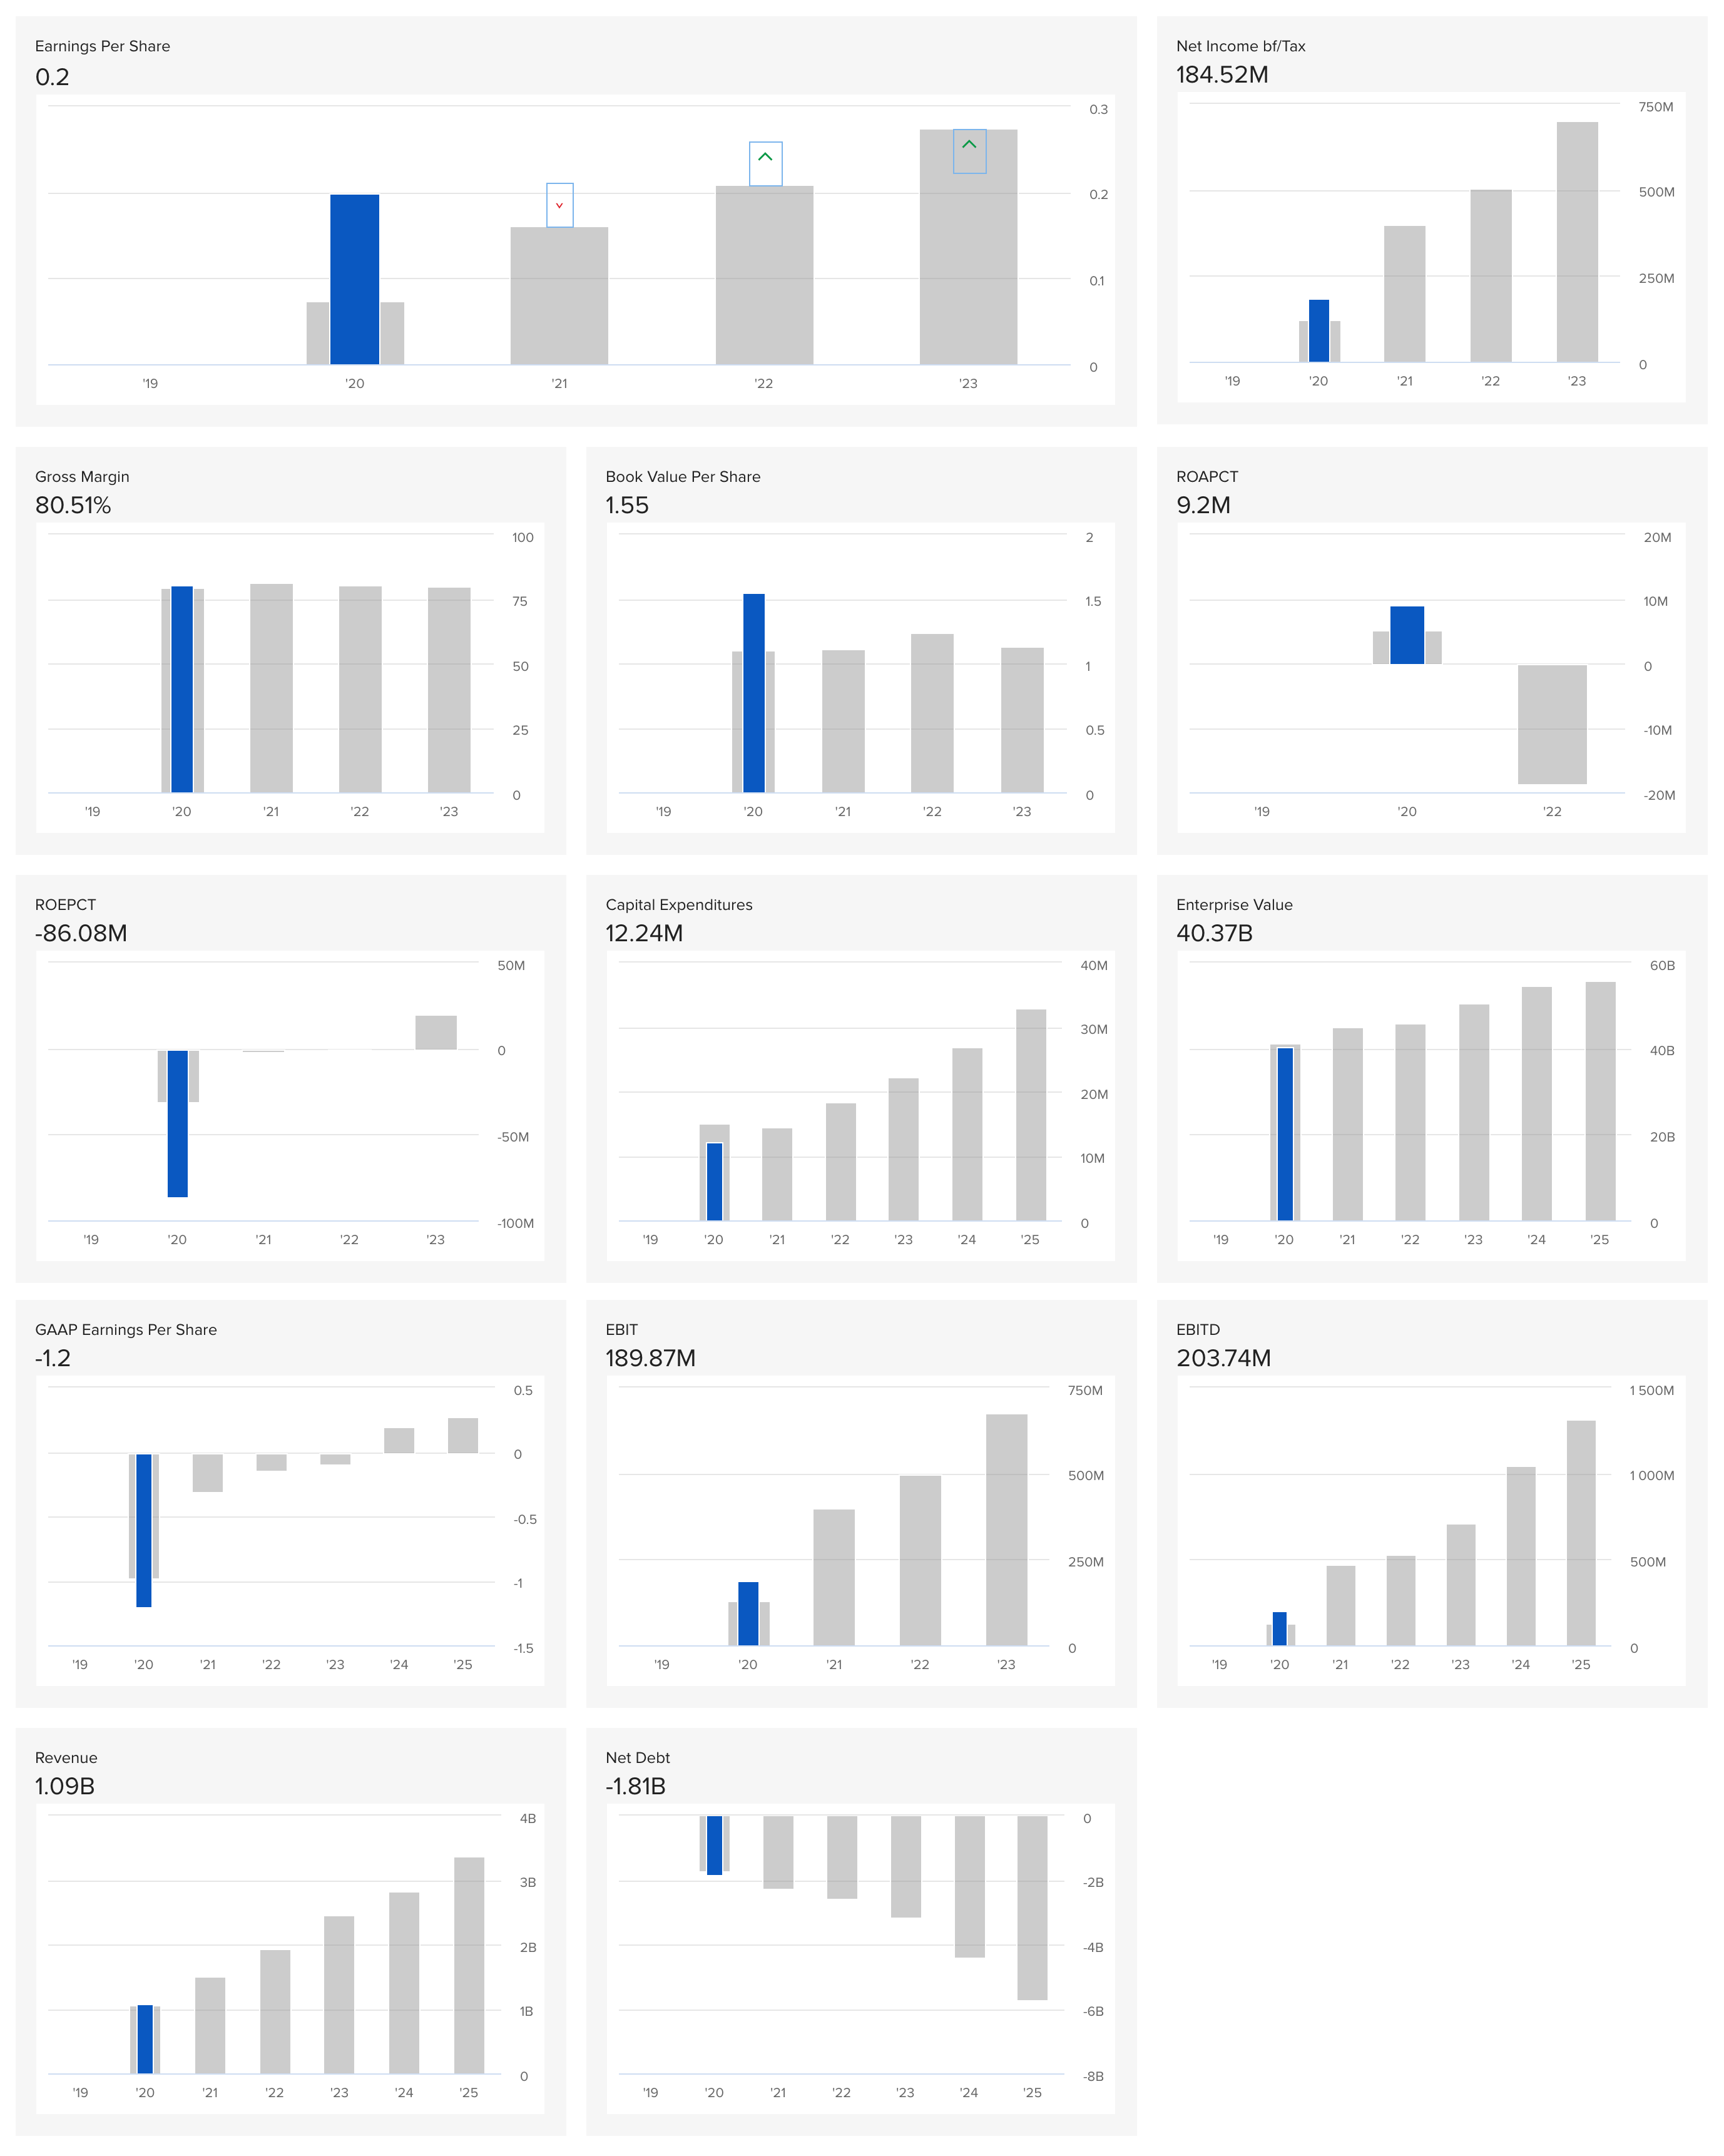
PLTR Stock Annual fundamentals + future estimates
Disclaimer: For educational purpose only. Not investment advice. Seek professional advice from a financial advisor before making any investing decisions.