
Market Breadth: Percentage of Stocks Above their 50 Day, 150 Day & 200 Day Moving Averages Combined
The full post is available to view by members only. For immediate access:
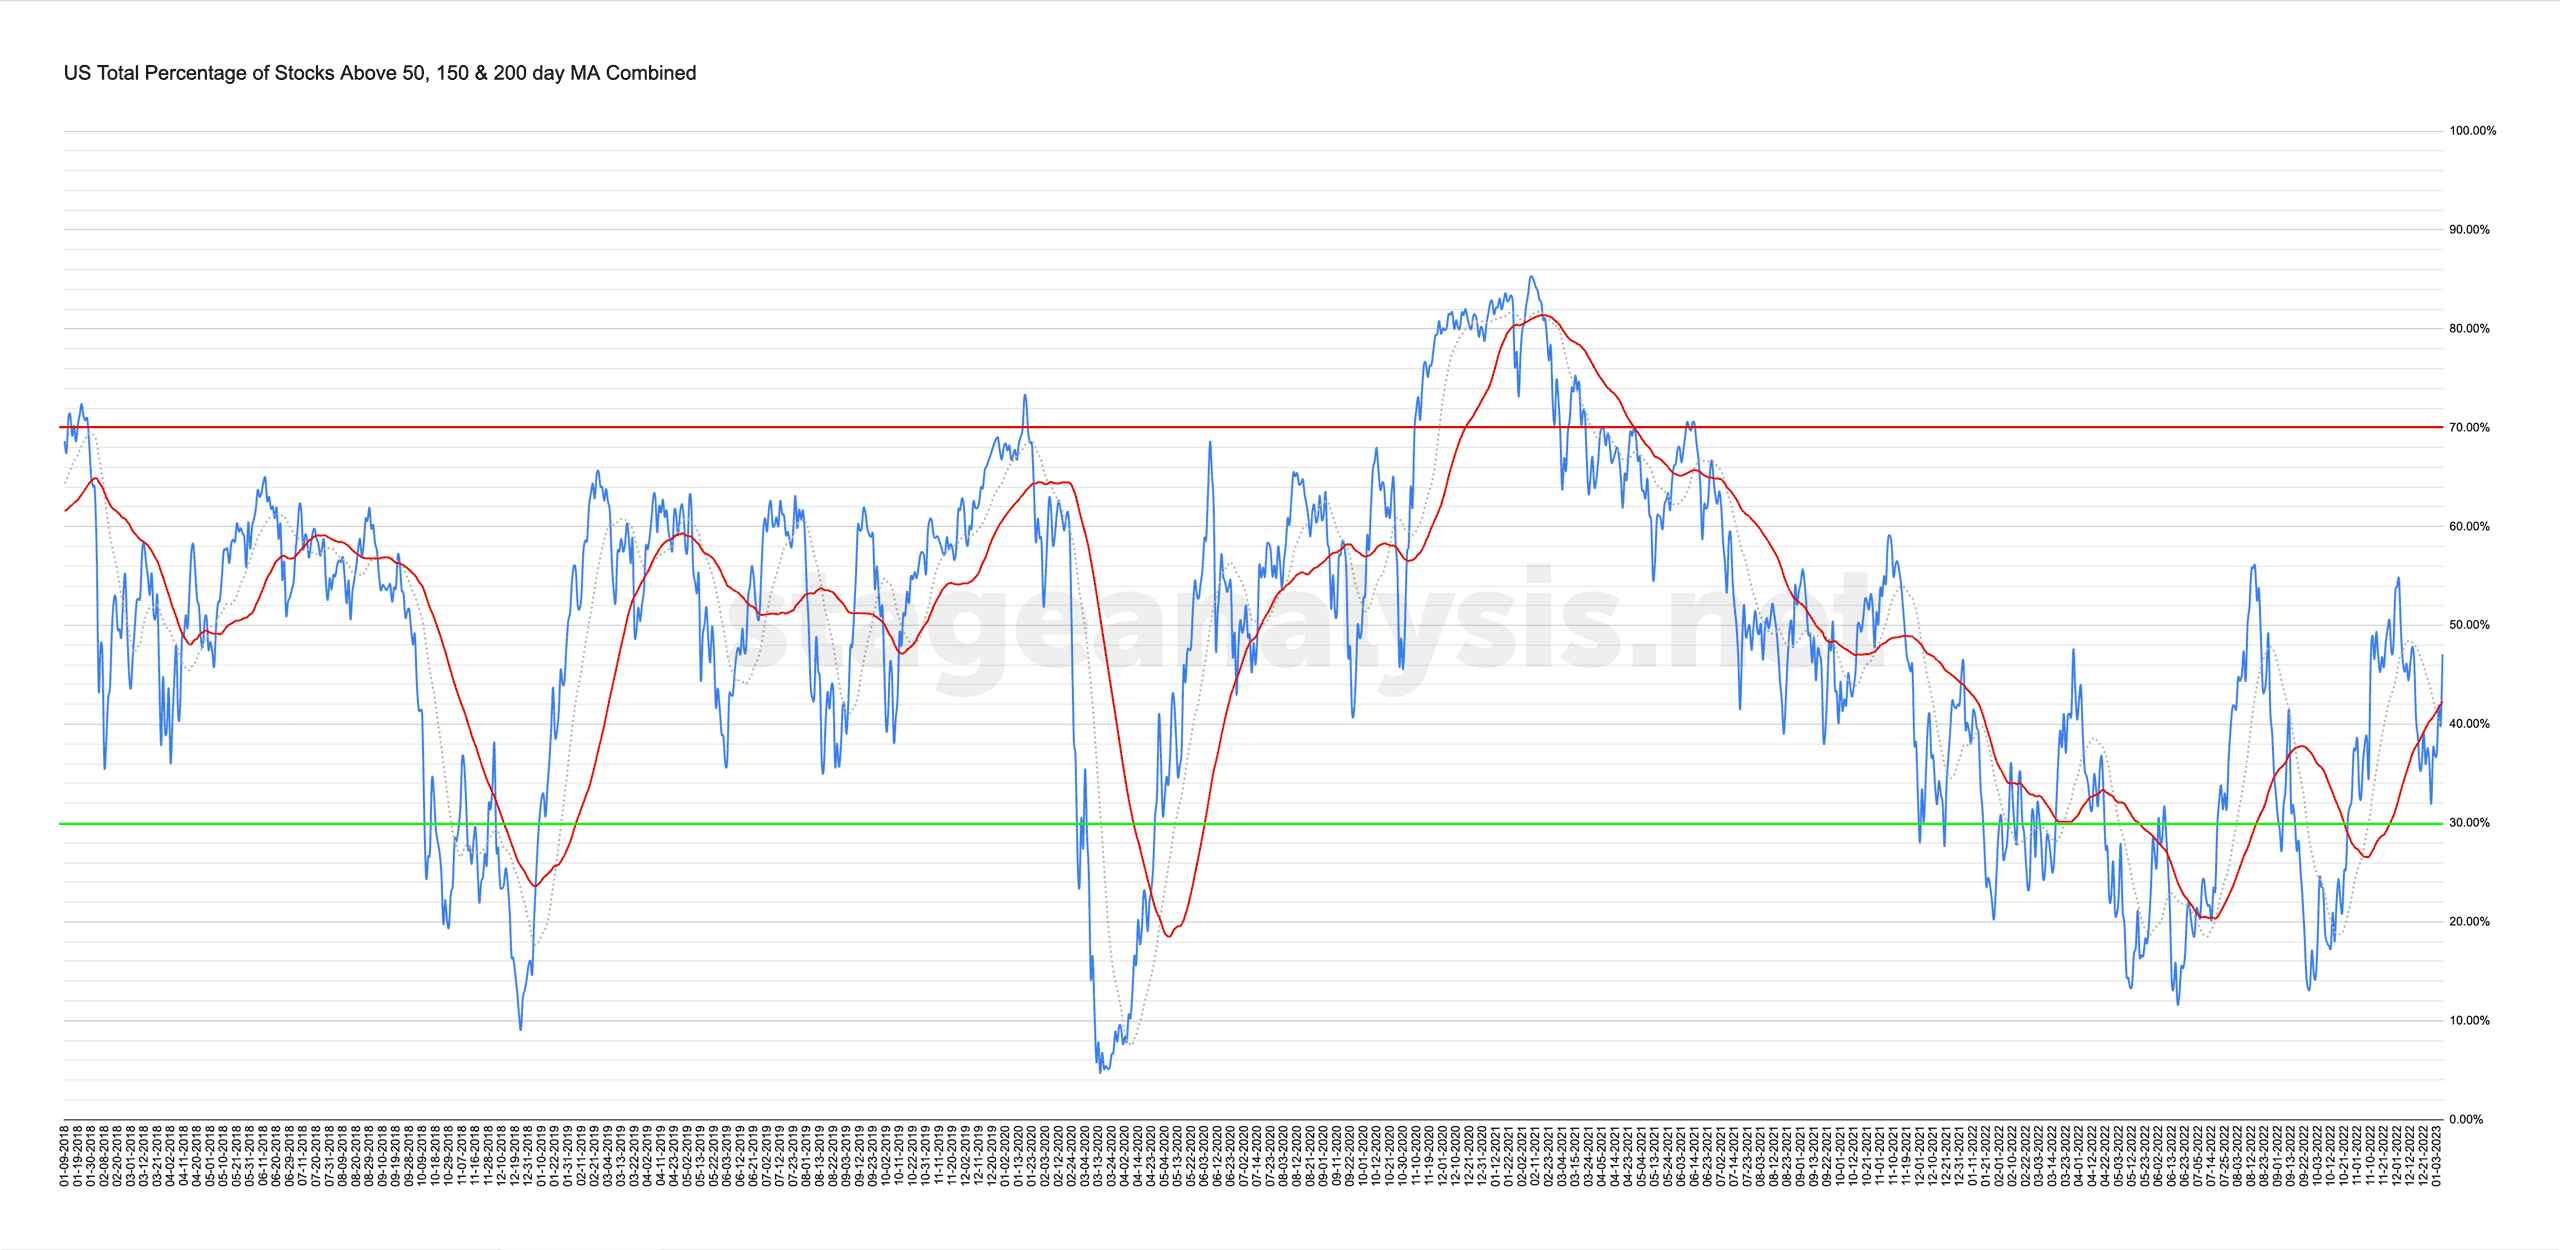
47.07% (+10.28% 1wk)
Status: Tentative Postive Environment in the Stage 1 zone
The US Total Percentage of Stocks above their 50 Day, 150 Day & 200 Day Moving Averages (shown above) moved strongly higher over the shortened trading week by +10.28%, closing back above its 20 day MA and 50 day MA.
The overall combined average now stands at 47.07% of stocks in the US market above their short, medium and long term moving averages, and with the strong move through the 50 day MA signal line, the status has changed to a Tentative Positive Environment and has moved firmly back into the Stage 1 zone in the middle of the field. Which is a very neutral position, but has displayed positive short-term momentum over the last week.
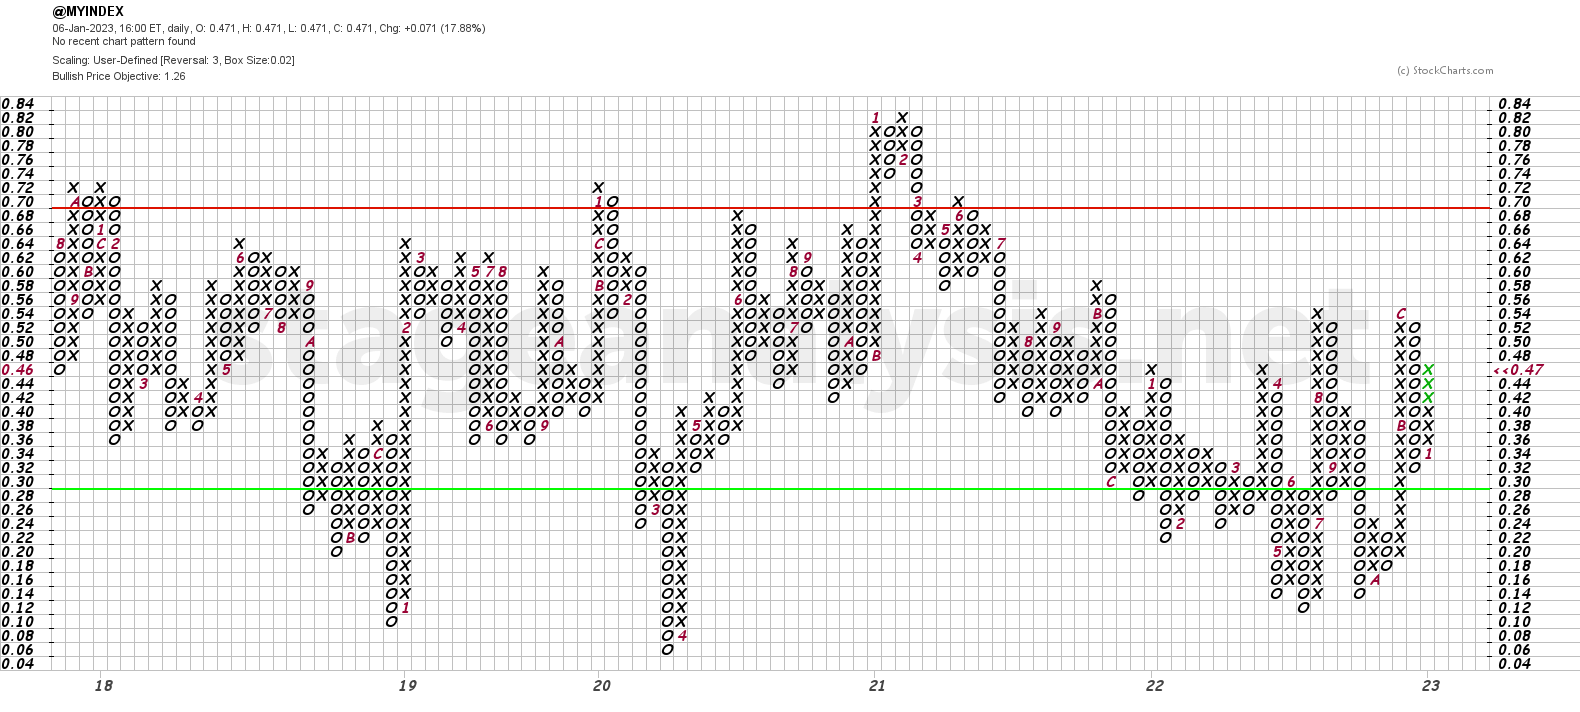
The Point and Figure (P&F) chart shown above, reversed to a column of Xs on Wednesday 4th January and added a total of 7 Xs by weeks end. Therefore the point and figure status changed back from Bull Correction to Bull Confirmed status on Wednesday, and with the switch to a column of Xs the P&F strategy changes from Defense to Offense. i.e. your team has the ball in the middle of the playing field.
You can learn more about the P&F statuses, what they mean, and their origins here: Bullish Percent.
Recommended reading: Point and Figure Charting: The Essential Application for Forecasting and Tracking Market Prices by Thomas J. Dorsey
Become a Stage Analysis Member:
To see more like this – US Stocks watchlist posts, detailed videos each weekend, use our unique Stage Analysis tools, such as the US Stocks & ETFs Screener, Charts, Market Breadth, Group Relative Strength and more...
Join Today
Disclaimer: For educational purpose only. Not investment advice. Seek professional advice from a financial advisor before making any investing decisions.