
Stage Analysis Technical Attributes Scores – Nasdaq 100
We last covered the Stage Analysis Technical Attributes (SATA) weekly scores for the Nasdaq 100 back in mid November, which shows a rough guide of the Stages of the individual stocks within the Nasdaq 100. i.e. everything above a 7 would be considered in the Stage 2 zone (Positive), 4-6 in the Stage 1 or Stage 3 zone (Neutral), and 3 or below is the Stage 4 zone (Negative).
Currently the Nasdaq 100 consists of:
- 22% Stage 2 zone (Positive)
- 31% Stage 1 or Stage 3 zone (Neutral)
- 47% Stage 4 zone (Negative)
Overall Average SATA Score: 4.08 (Borderline lower Stage 1 zone)
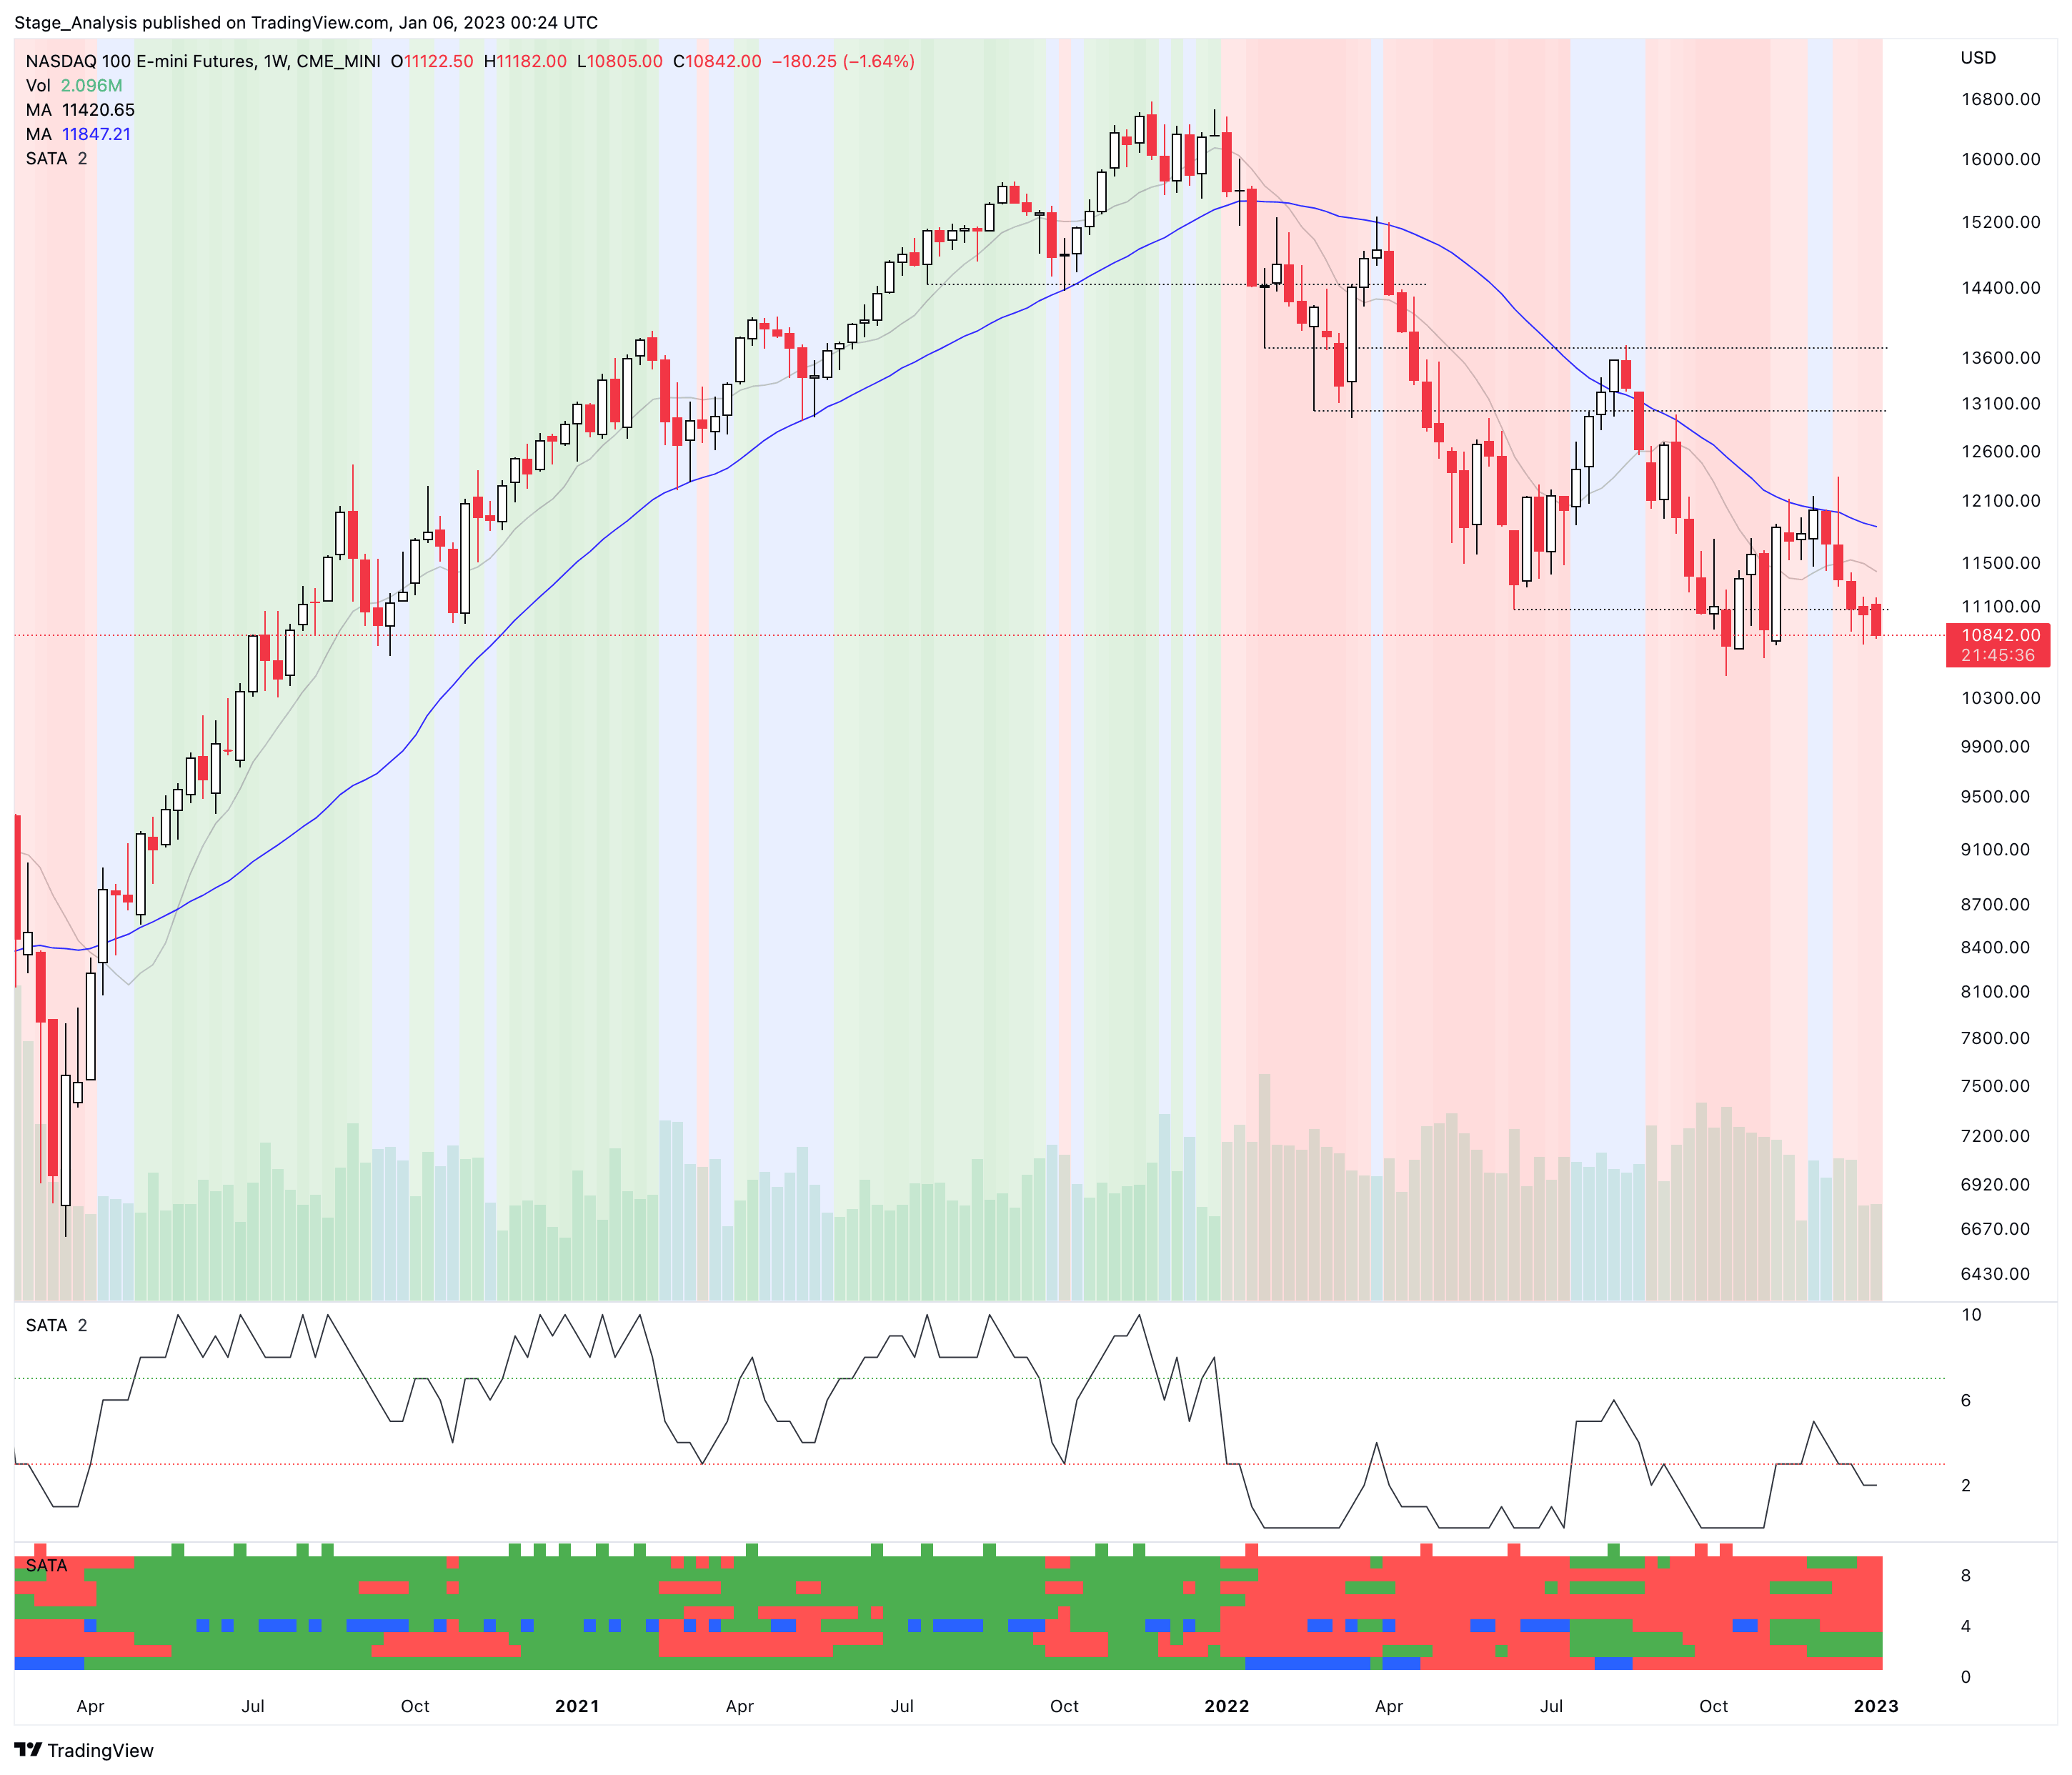
So the SATA score has declined by -1, as it was at 5.08 in mid November, which was a more neutral Stage 1 position. So it's at the weaker end of the Stage 1 range currently with almost half of the stocks in the Nasdaq 100 in the Stage 4 zone (which means that they have a SATA score of 3 or less). So there is still a divergence with the overall index SATA score which is weaker at a 2. But the SATA score of the individual stocks gives an equal weighted view, which explains the difference.
Below is the data tables of the Nasdaq 100 stocks IBD in order of relative strength and the position changes over the last 12 weeks (Members only).
The full post is available to view by members only. For immediate access:
Disclaimer: For educational purpose only. Not investment advice. Seek professional advice from a financial advisor before making any investing decisions.