
$U Stock – Stage 2A Breakout
Unity Software $U stock made a Stage 2A breakout this week from the five month Stage 1 base that had been forming since the Selling Climax (SC) in early March.
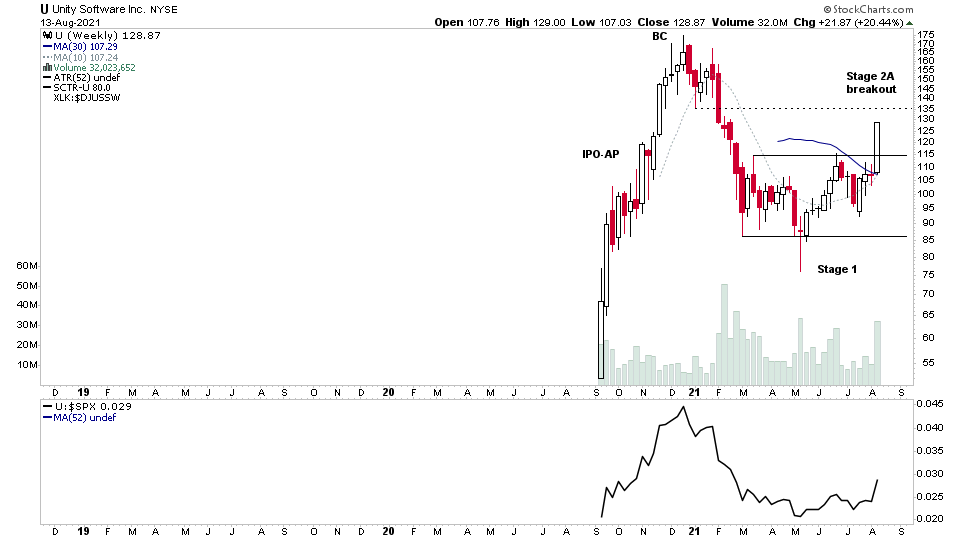
It closed the week strongly near the high of the weekly price bar. It had a strong initial IPO Advance Phase of over 200%+ when it IPO'd back in September 2020, and has been showing signs of accumulation in the recent Stage 1 base structure as the base has progressed from the initial distribution and has started to shape up with higher lows and a strong volume volume breakout on around 2 times the average weekly volume, which is one of the key requirements that we look for in Stan Weinstein's Stage Analysis method.
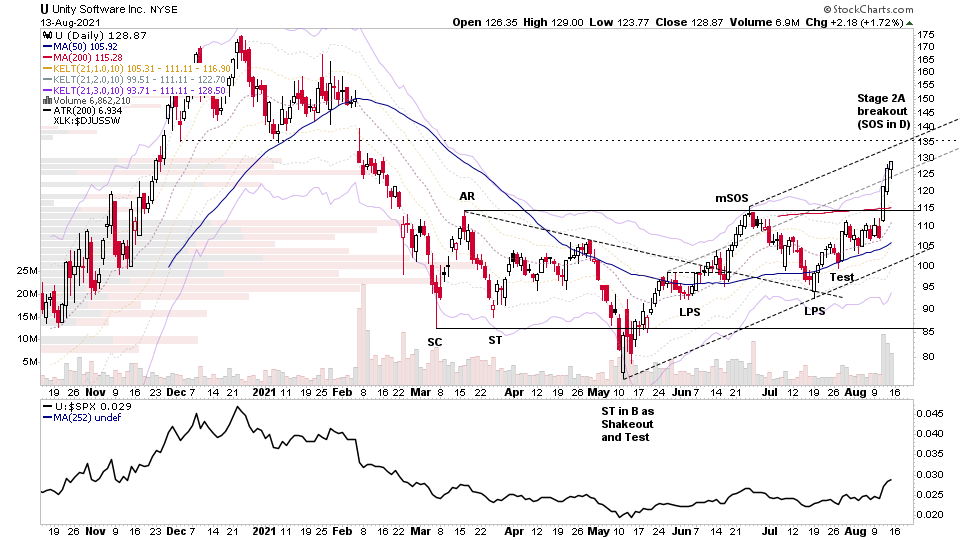
The daily chart of U stock shows the classic Wyckoff base structure that has formed as the Stage 1 base, with the initial Phase A Selling Climax (SC), Automatic Rally (AR) and Secondary Test (ST), followed by testing of the range in Phase B, which also had a Terminal Shakeout and Test move - which briefly moved the stock into Stage 4, before recovering back into the range with a minor Sign of Strength (mSOS) rally back towards the top of the Stage 1 base.
Phase C began with the formation of the high low that formed as a Last Point of Support (LPS) and Test in July, which then moved into Phase D as it followed through and has now has major Sign of Strength (SOS) rally - which is also the Stage 2A breakout point - which happened on the significant bar on Wednesday 11th August on its reaction to earnings.
As you can see U stock is now approaching the upper part of the channel line and prior resistance from the December / January range, and so I will be looking for how it develops on any potential Backup (BU) towards the Stage 2A breakout level. It may not come all the way back, as the best Stage 2A breakouts don't always backup. However, a lot of stocks do, and so with near term resistance approaching, there is at least the possibility of consolidation or higher base forming in the coming weeks, or a full pullback towards the top of the Stage 1 base. All of which will provide the next potential low risk entry points depending on how they develop. So need to watch the price and volume on any pullback / consolidation for guidance.
Become a Stage Analysis Member:
To see more like this and other premium content, such as the regular US Stocks watchlist, detailed videos and intraday posts, become a Stage Analysis member.
Join Today
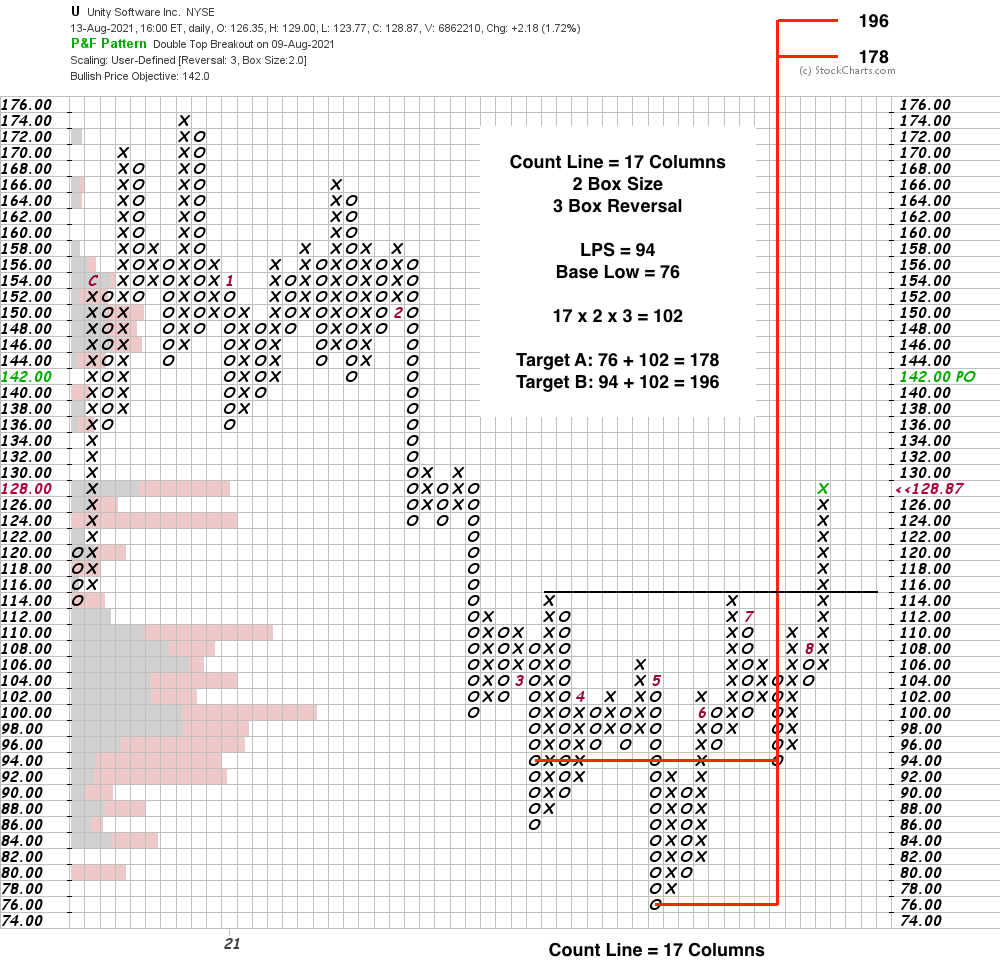
U Stock Point & Figure Horizontal Price Target (Wyckoff method)
The Wyckoff method P&F horizontal count line is 17 columns with a 2 box size by 3 reversal chart. Which added onto the Spring Low at 76 and the Last Point of Support (LPS) at 94, gives a target range of 178 to 196. Hence the potential Cause from the base is 50%+. Although you could also take a larger count from the higher LPS before the breakout, which projects to over 100%. But I prefer to start with the smaller counts.
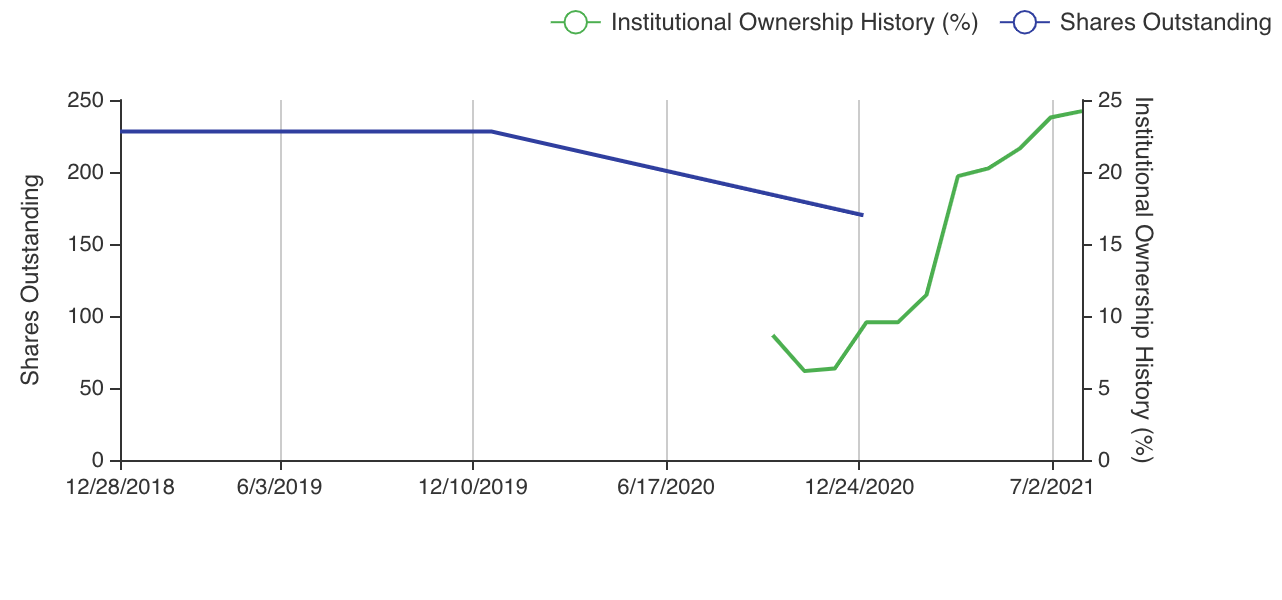
U Stock Institutional Ownership
Institutional Ownership has increased by 179% since the IPO last year.
Charts courtesy of the gurufocus website. Go to: www.gurufocus.com
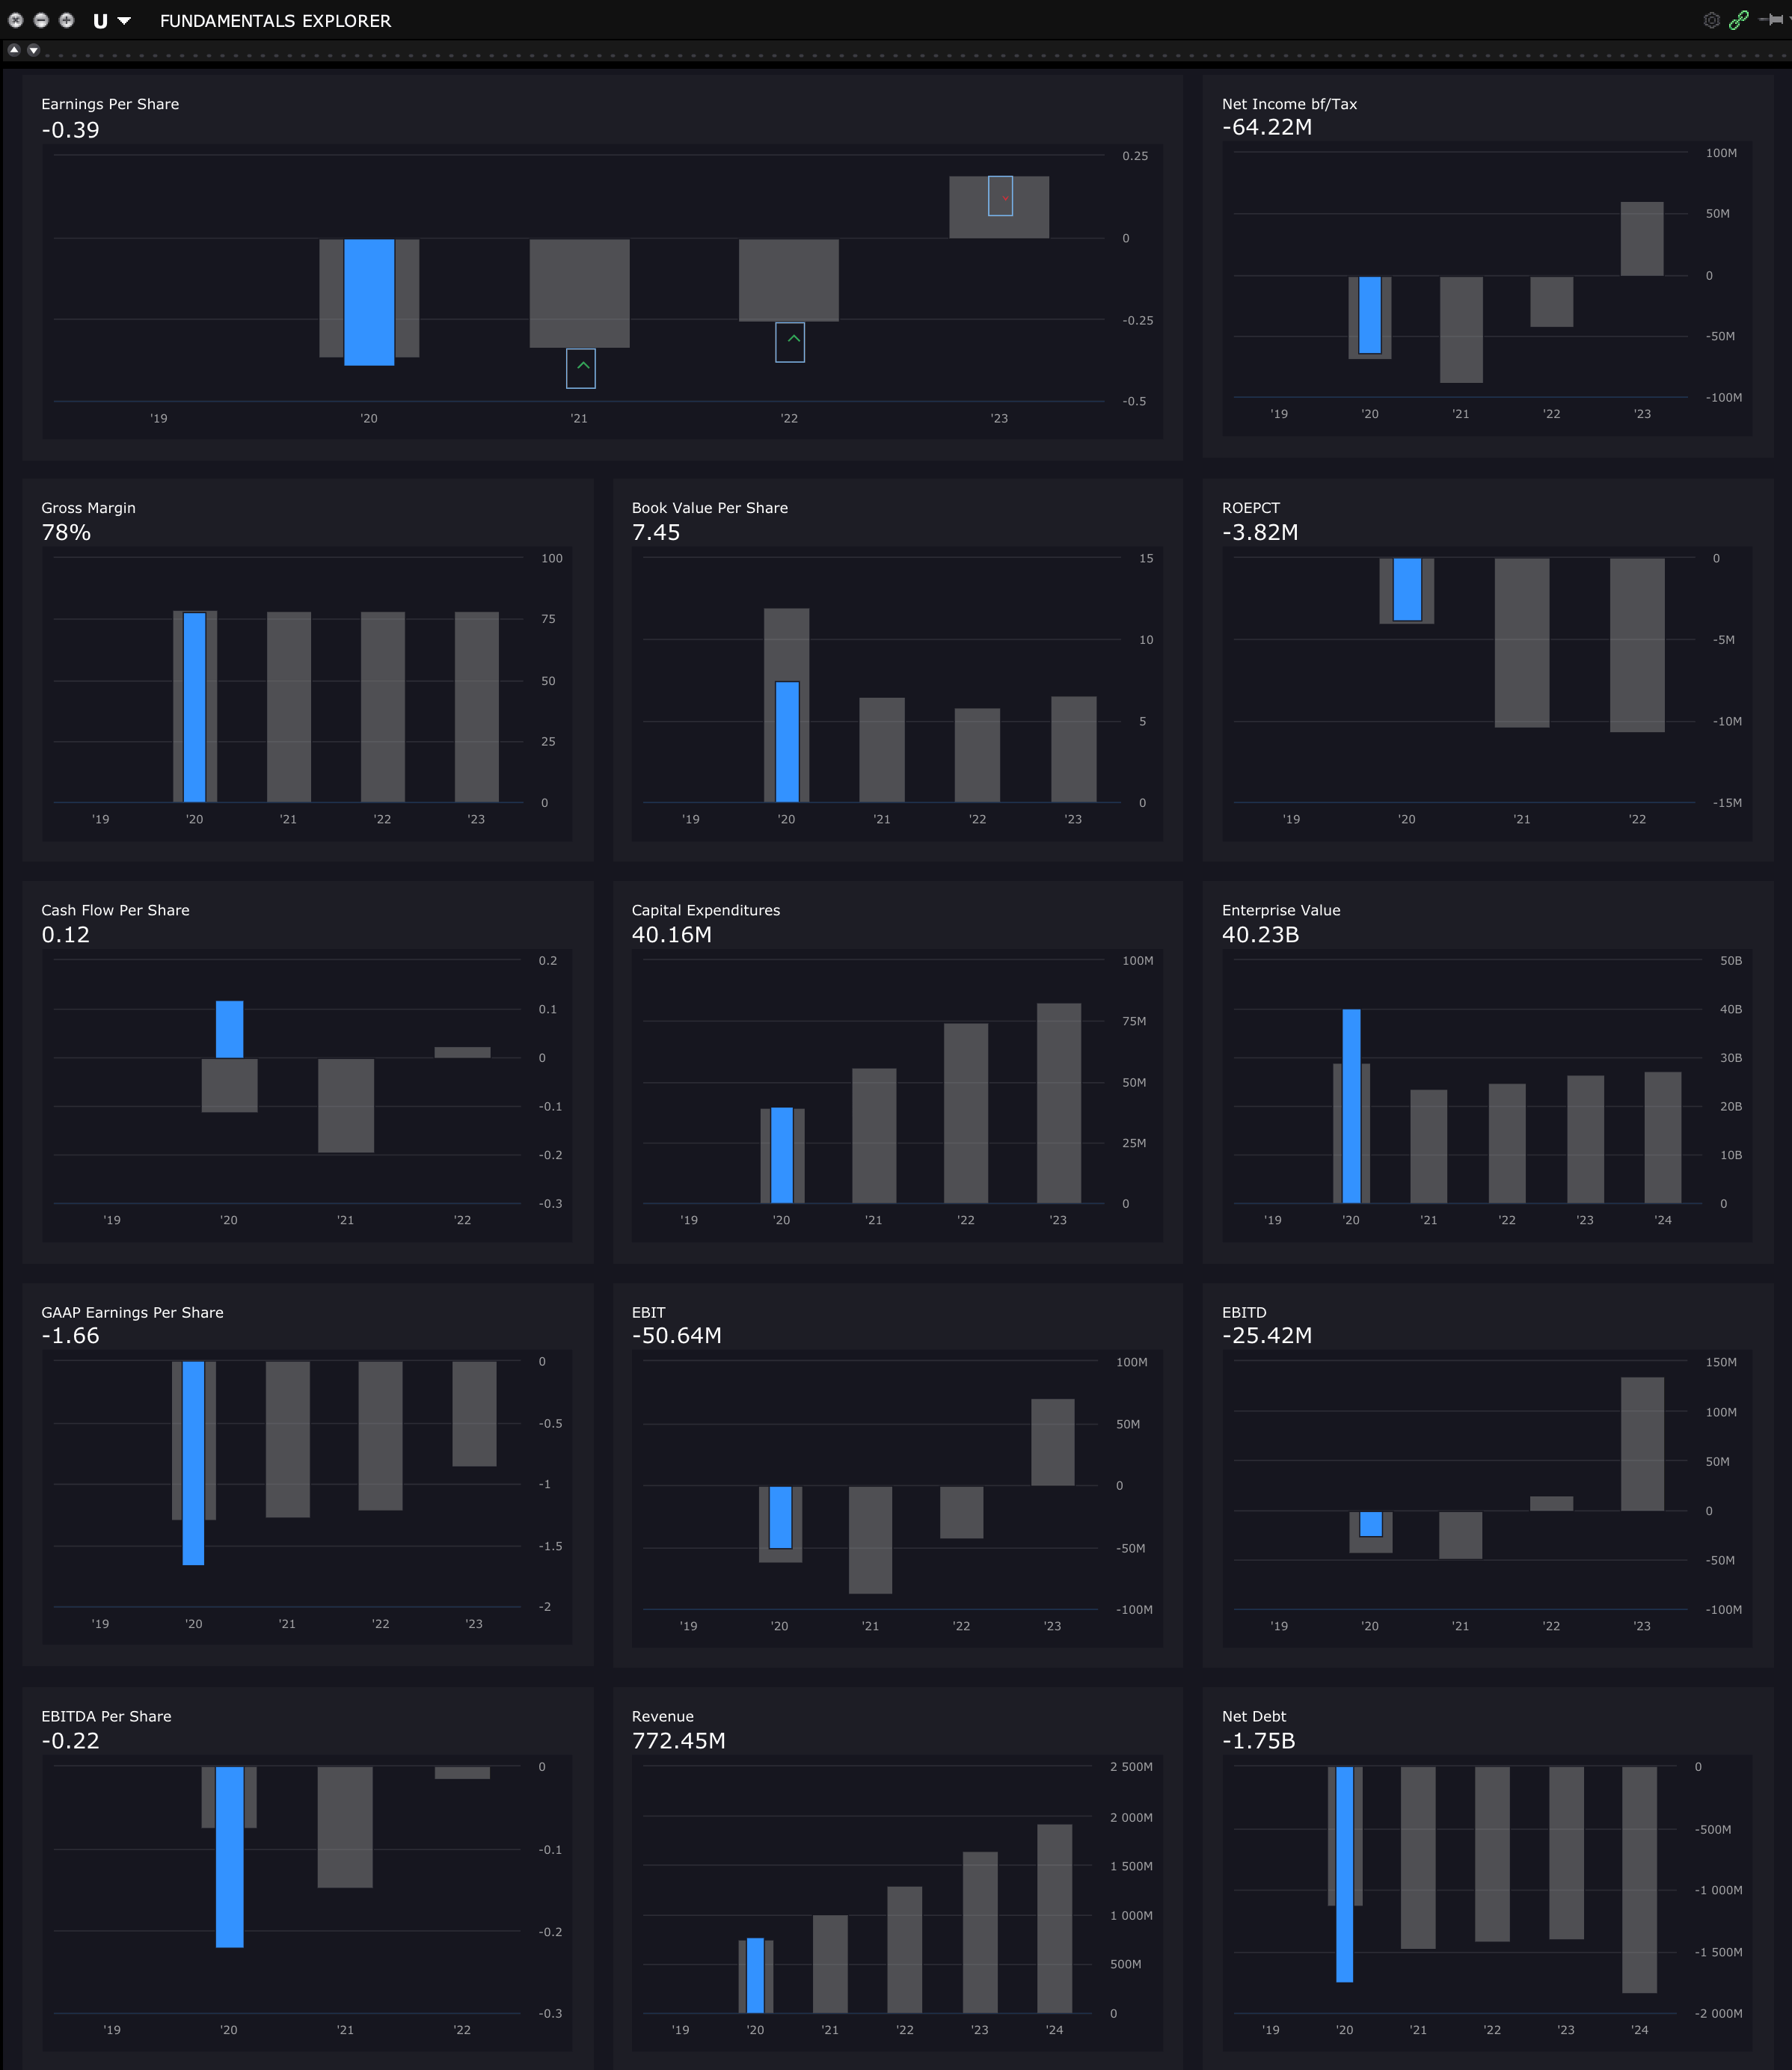
U Stock Annual fundamentals + future estimates
Disclaimer: For educational purpose only. Not investment advice. Seek professional advice from a financial advisor before making any investing decisions.
Disclaimer: For educational purpose only. Not investment advice. Seek professional advice from a financial advisor before making any investing decisions.