
Market Breadth: Percentage of Stocks Above their 50 Day, 150 Day & 200 Day Moving Averages Combined
The full post is available to view by members only. For immediate access:
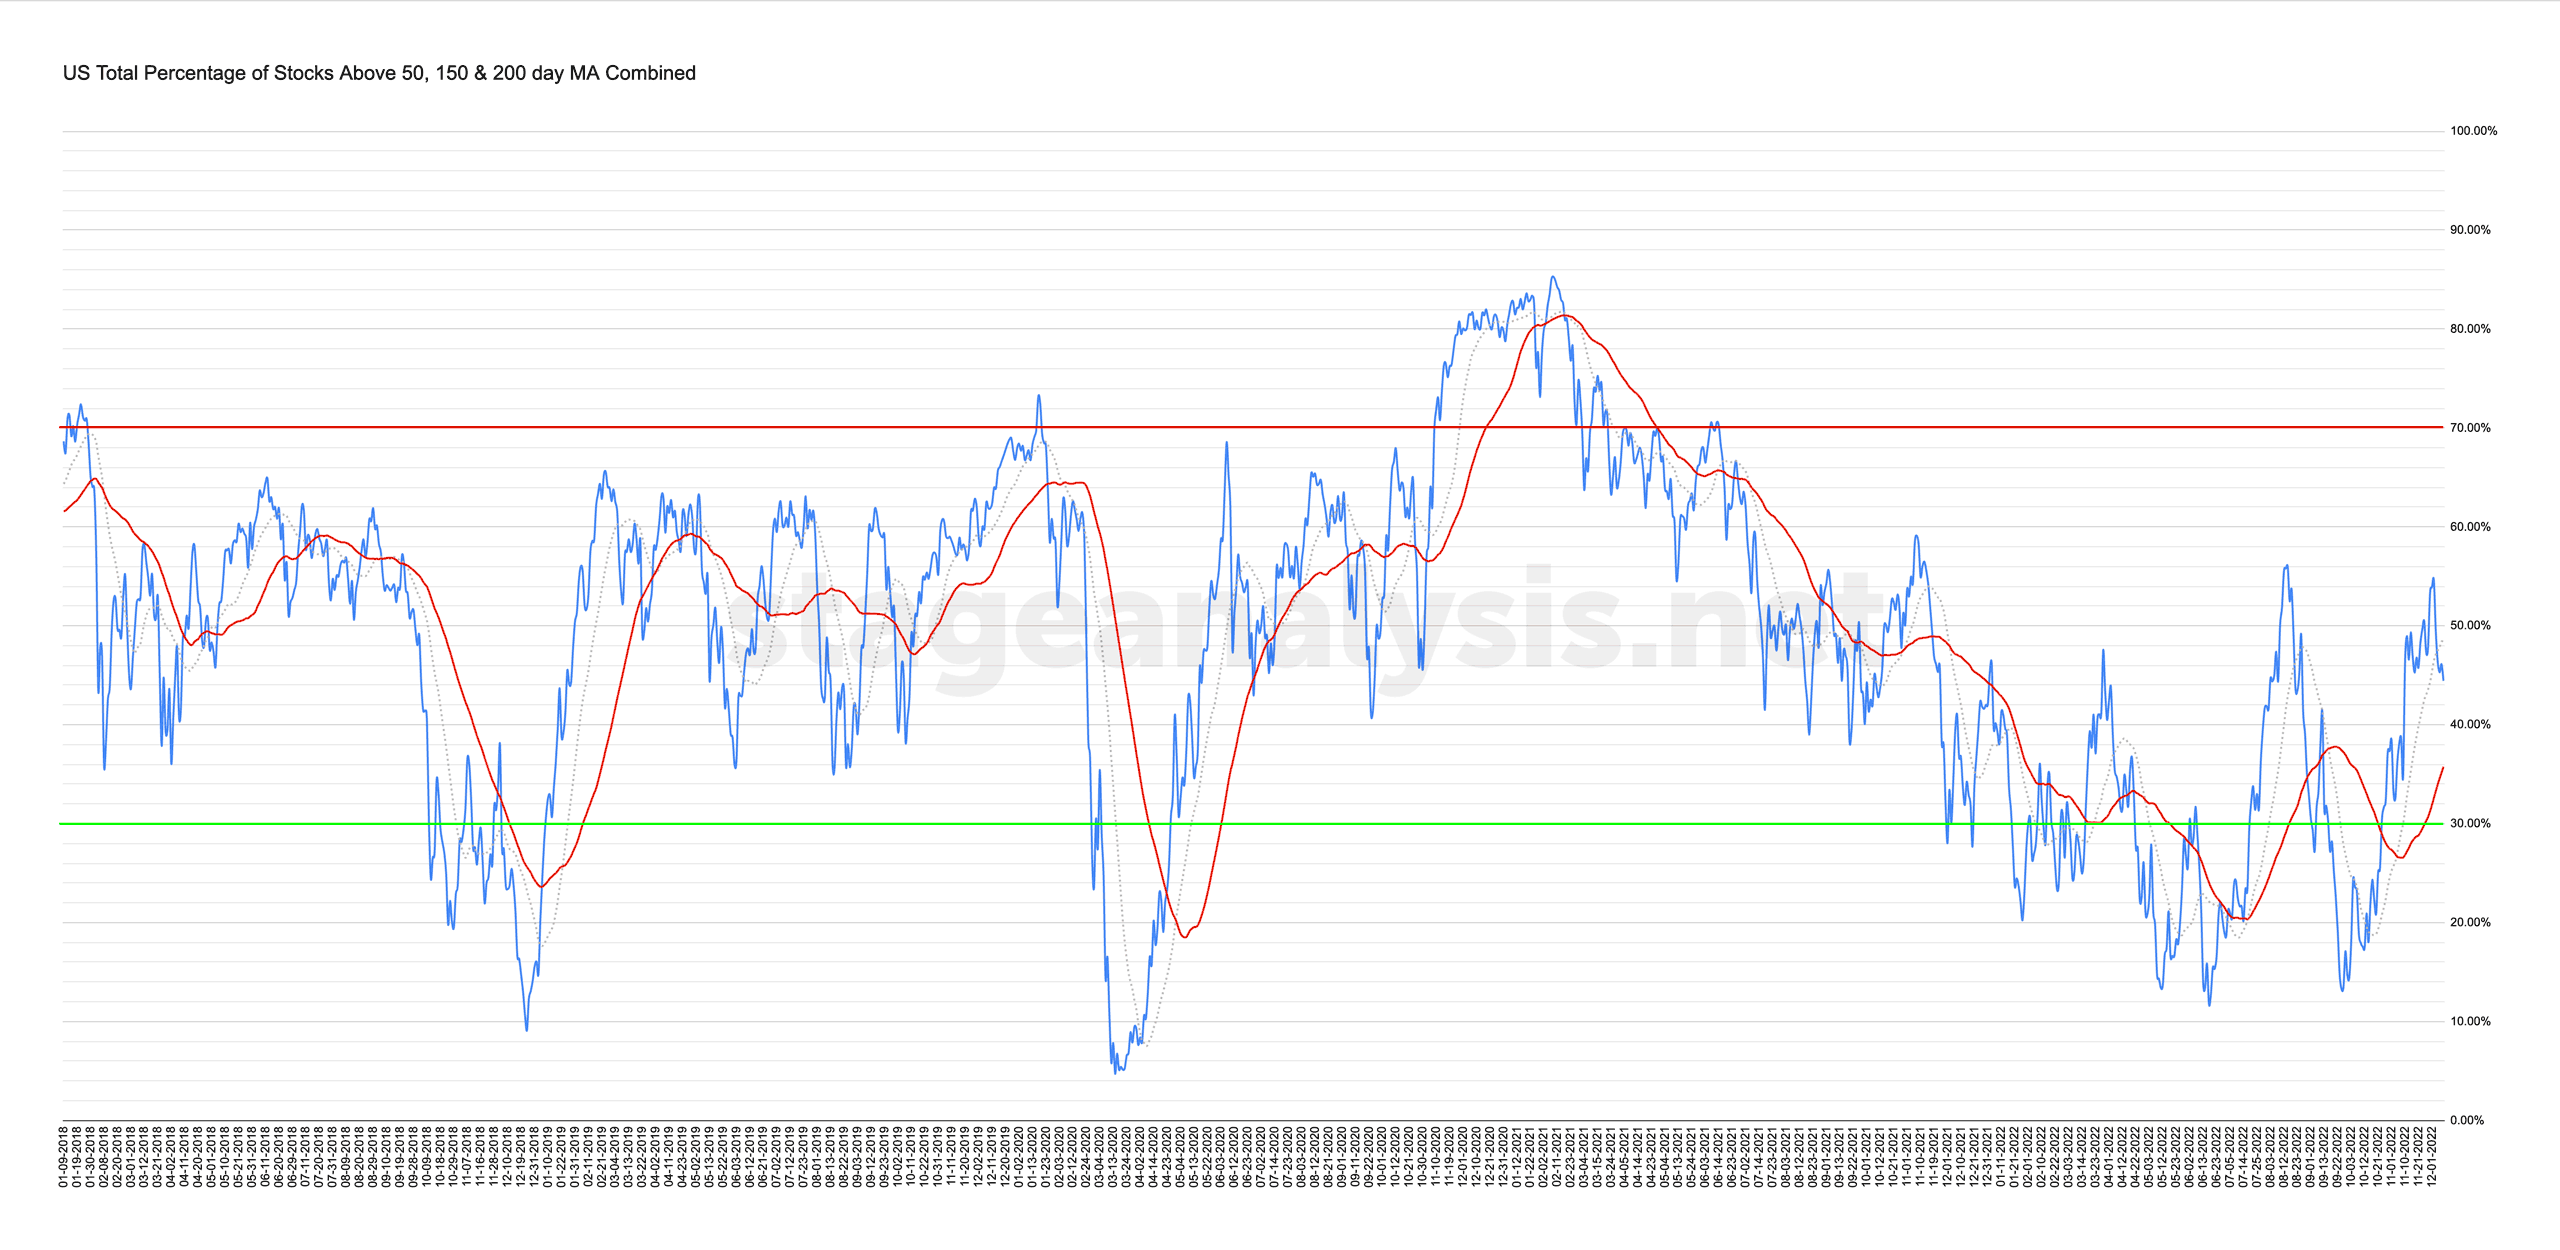
44.44% (-10.19% 1wk)
Status: Neutral Environment in the Stage 1 zone
The US Total Percentage of Stocks above their 50 Day, 150 Day & 200 Day Moving Averages (shown above) reversed strongly this week by -10.19% after reaching a similar level to the August high and closed the week at 44.44%. So, it has moved into the lower-middle part of the range, and with the cross below its 20 day MA, but still +8.68% above its 50 day MA, it changes its status to a Neutral Environment in the Stage 1 zone.
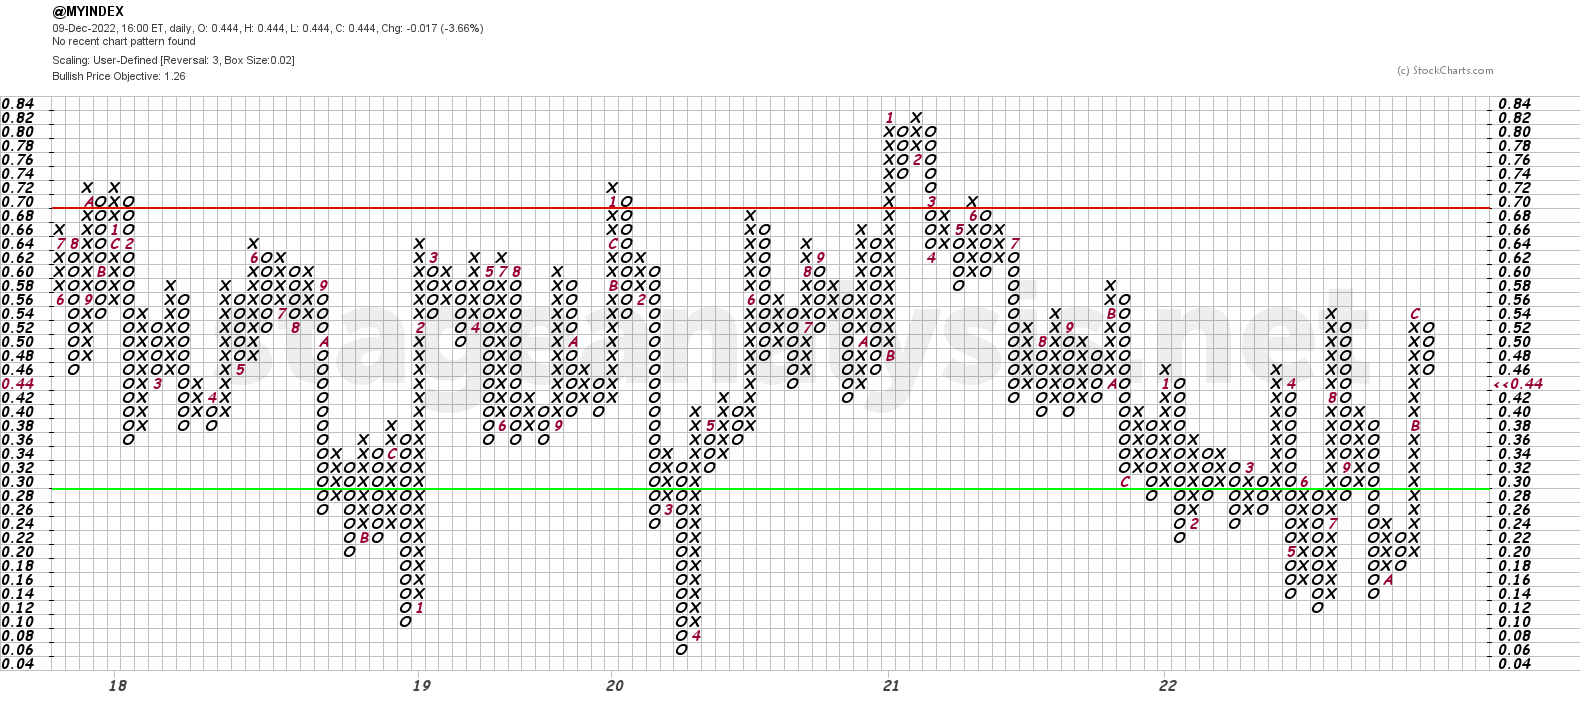
The Point and Figure chart (shown above) reversed to a column of Os on Tuesday and added an additional O down on Wednesday, which is the first column change / reversal since the 18th October when it reversed to the prior column of Xs. So the P&F strategy changes to Defense (as it is in a column of Os) and the P&F status changes to Bull Correction status.
Become a Stage Analysis Member:
To see more like this – US Stocks watchlist posts, detailed videos each weekend, use our unique Stage Analysis tools, such as the US Stocks & ETFs Screener, Charts, Market Breadth, Group Relative Strength and more...
Join Today
Disclaimer: For educational purpose only. Not investment advice. Seek professional advice from a financial advisor before making any investing decisions.