
Market Breadth: Percentage of Stocks Above their 50 Day, 150 Day & 200 Day Moving Averages Combined
The full post is available to view by members only. For immediate access:
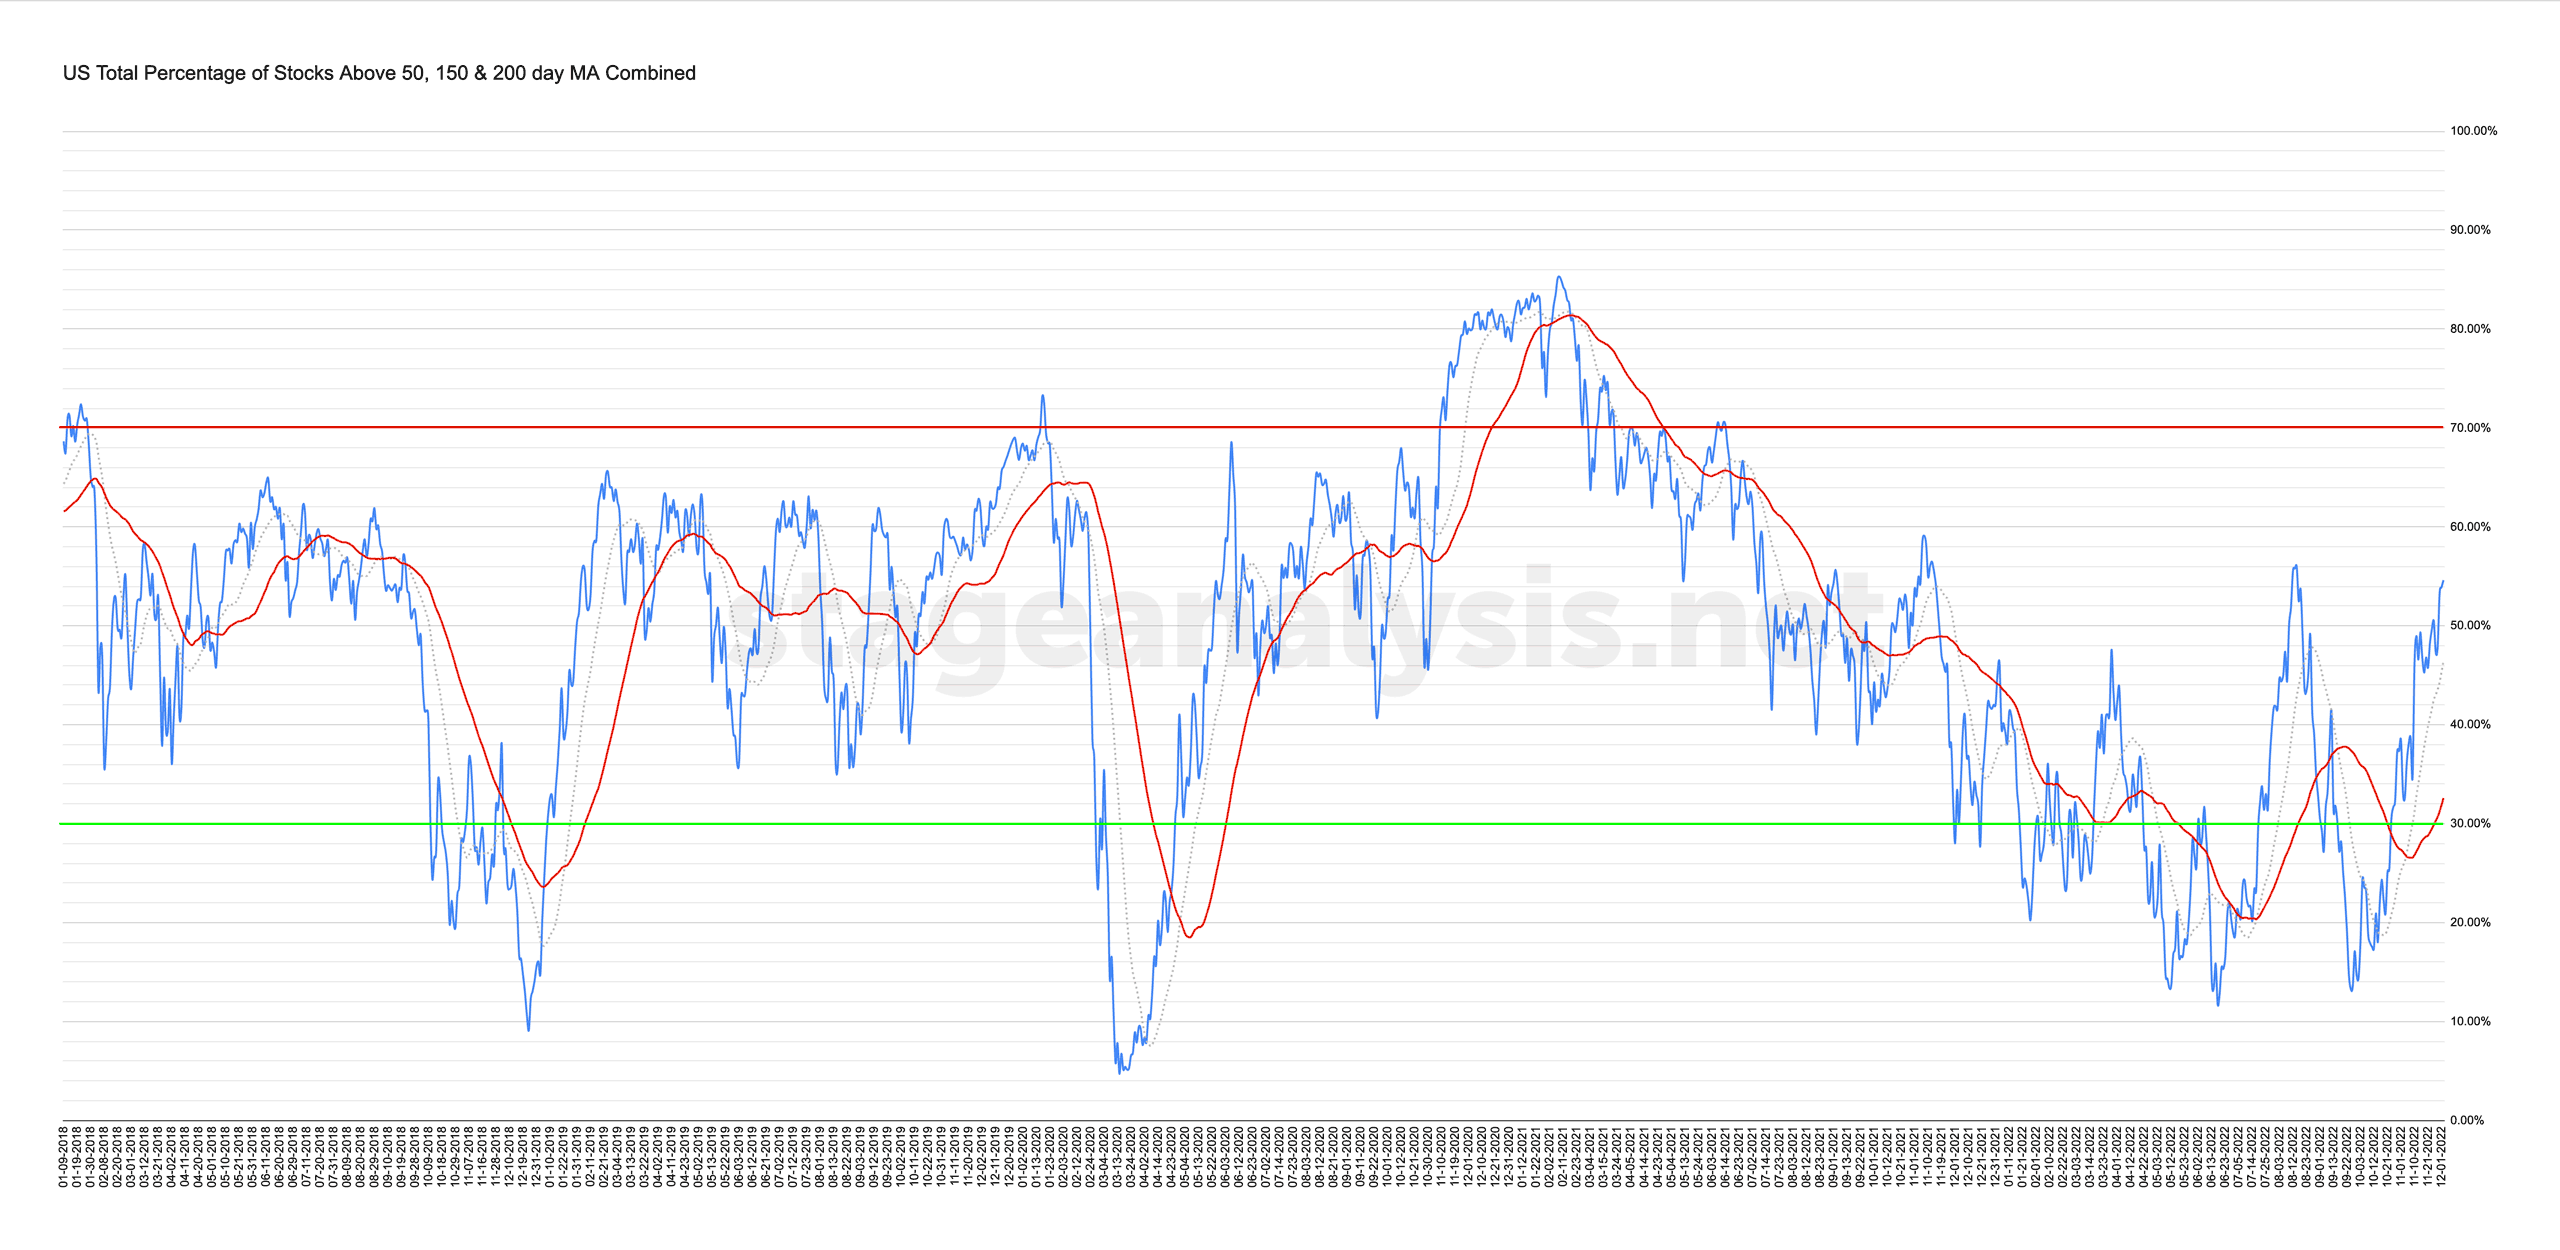
54.63% (+4.13% 1wk)
Status: Positive Environment in the Stage 1 zone
The US Total Percentage of Stocks above their 50 Day, 150 Day & 200 Day Moving Averages (shown above) added a further +4.13% this week, closing at 54.63%, and so has moved into the upper middle of the range, which keeps the status as a Positive Environment in the Stage 1 zone, and continues to be more than +20% above its own 50 day MA.
So the combined percentage continues to move higher in Stage 1 and towards the Stage 2 zone. But for it to change to Stage 2 we'd need to see the total percentage of stocks continue to expand and move strongly above the 60% level. Which is now within potential reach. However, it is not a forgone conclusion, as Stage 1 is the neutral zone, and so a return to Stage 4 also shouldn't be ruled out, but the short-term trend continues to edge higher for the time being. So that remains the path of least resistance currently.
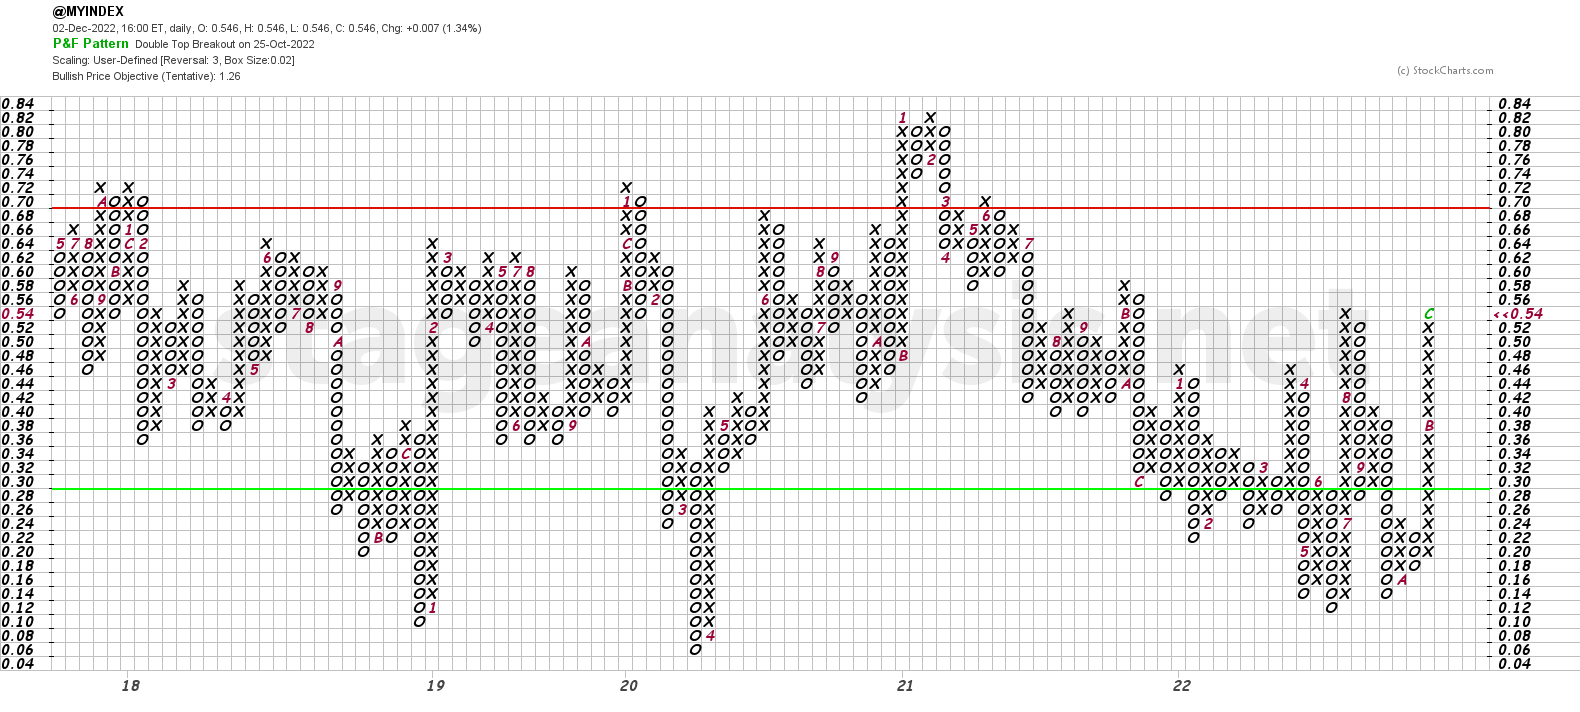
The Point and Figure chart (shown above) added a further +2 Xs to its current column and so the P&F strategy remains on Offense (as it's in a column of Xs) and on Bull Confirmed status, and has remained on a bullish status since the 18th October when reversed up to Bull Alert status.
Become a Stage Analysis Member:
To see more like this – US Stocks watchlist posts, detailed videos each weekend, use our unique Stage Analysis tools, such as the US Stocks & ETFs Screener, Charts, Market Breadth, Group Relative Strength and more...
Join Today
Disclaimer: For educational purpose only. Not investment advice. Seek professional advice from a financial advisor before making any investing decisions.