
Bitcoin - Stage 1
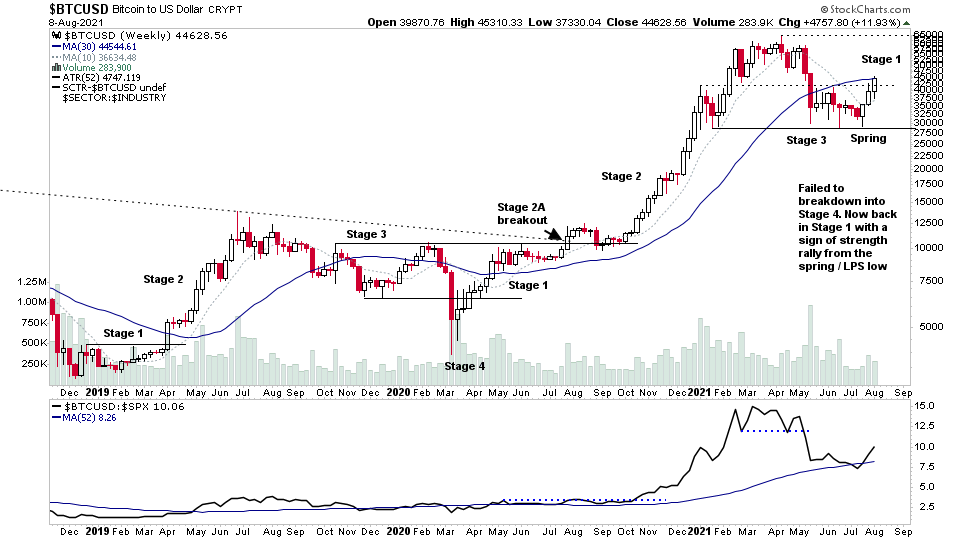
Bitcoin is at a pivotal point once more as it moves back into Stage 1 on a weekly basis, (which is what we use to determine the major Stages), following multiple failed attempts to breakdown into Stage 4, which then reversed into a Spring / Last Point of Support (LPS).
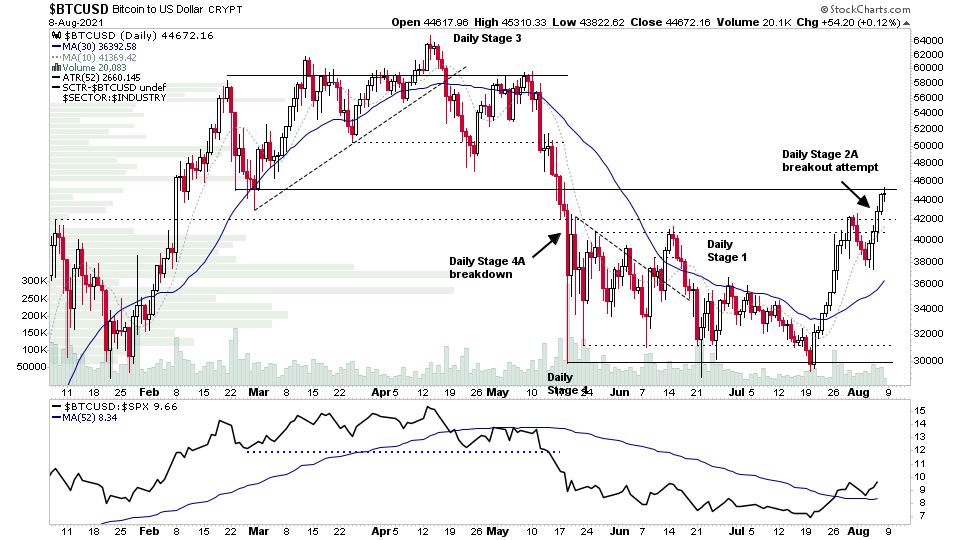
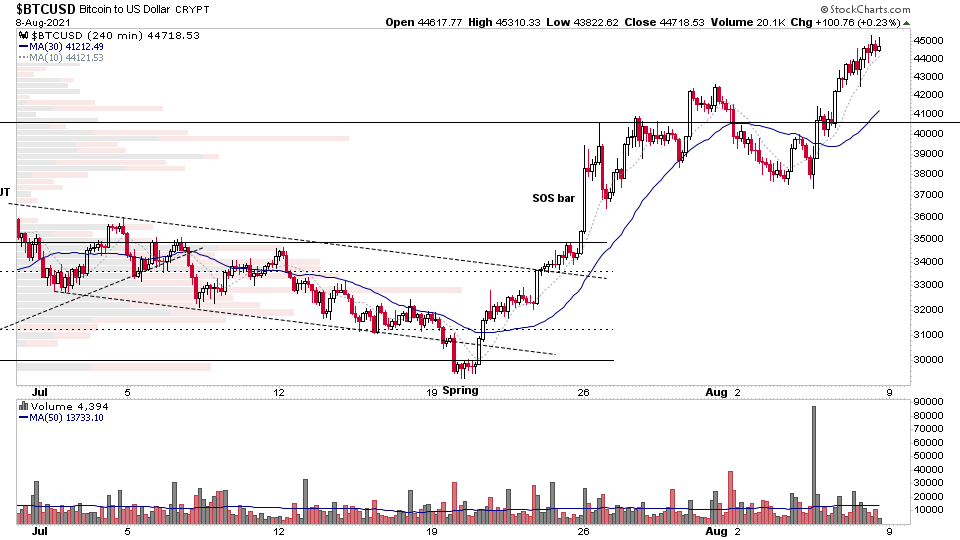
Since the July low, Bitcoin has had a sign of strength rally which has taken above the 3 month lower base that had formed, which is very clear on the Daily chart. You'll note on the Daily timeframe that Bitcoin has made a Stage 2A breakout attempt this week on that timeframe. But as I said previously, the major Stages are determined on the weekly timeframe. So although potentially in Stage 2 on the daily timeframe, it is only just moving into Stage 1 on the weekly timeframe. So is a sign of strength rally within a weekly Stage 1.
It's now approaching an area of logical resistance from the previous higher base breakdown. So progress may be limited to the upside in the short term and so it could see some consolidation or backing up action as the Stage 1 base defines the swing high and then develops further.
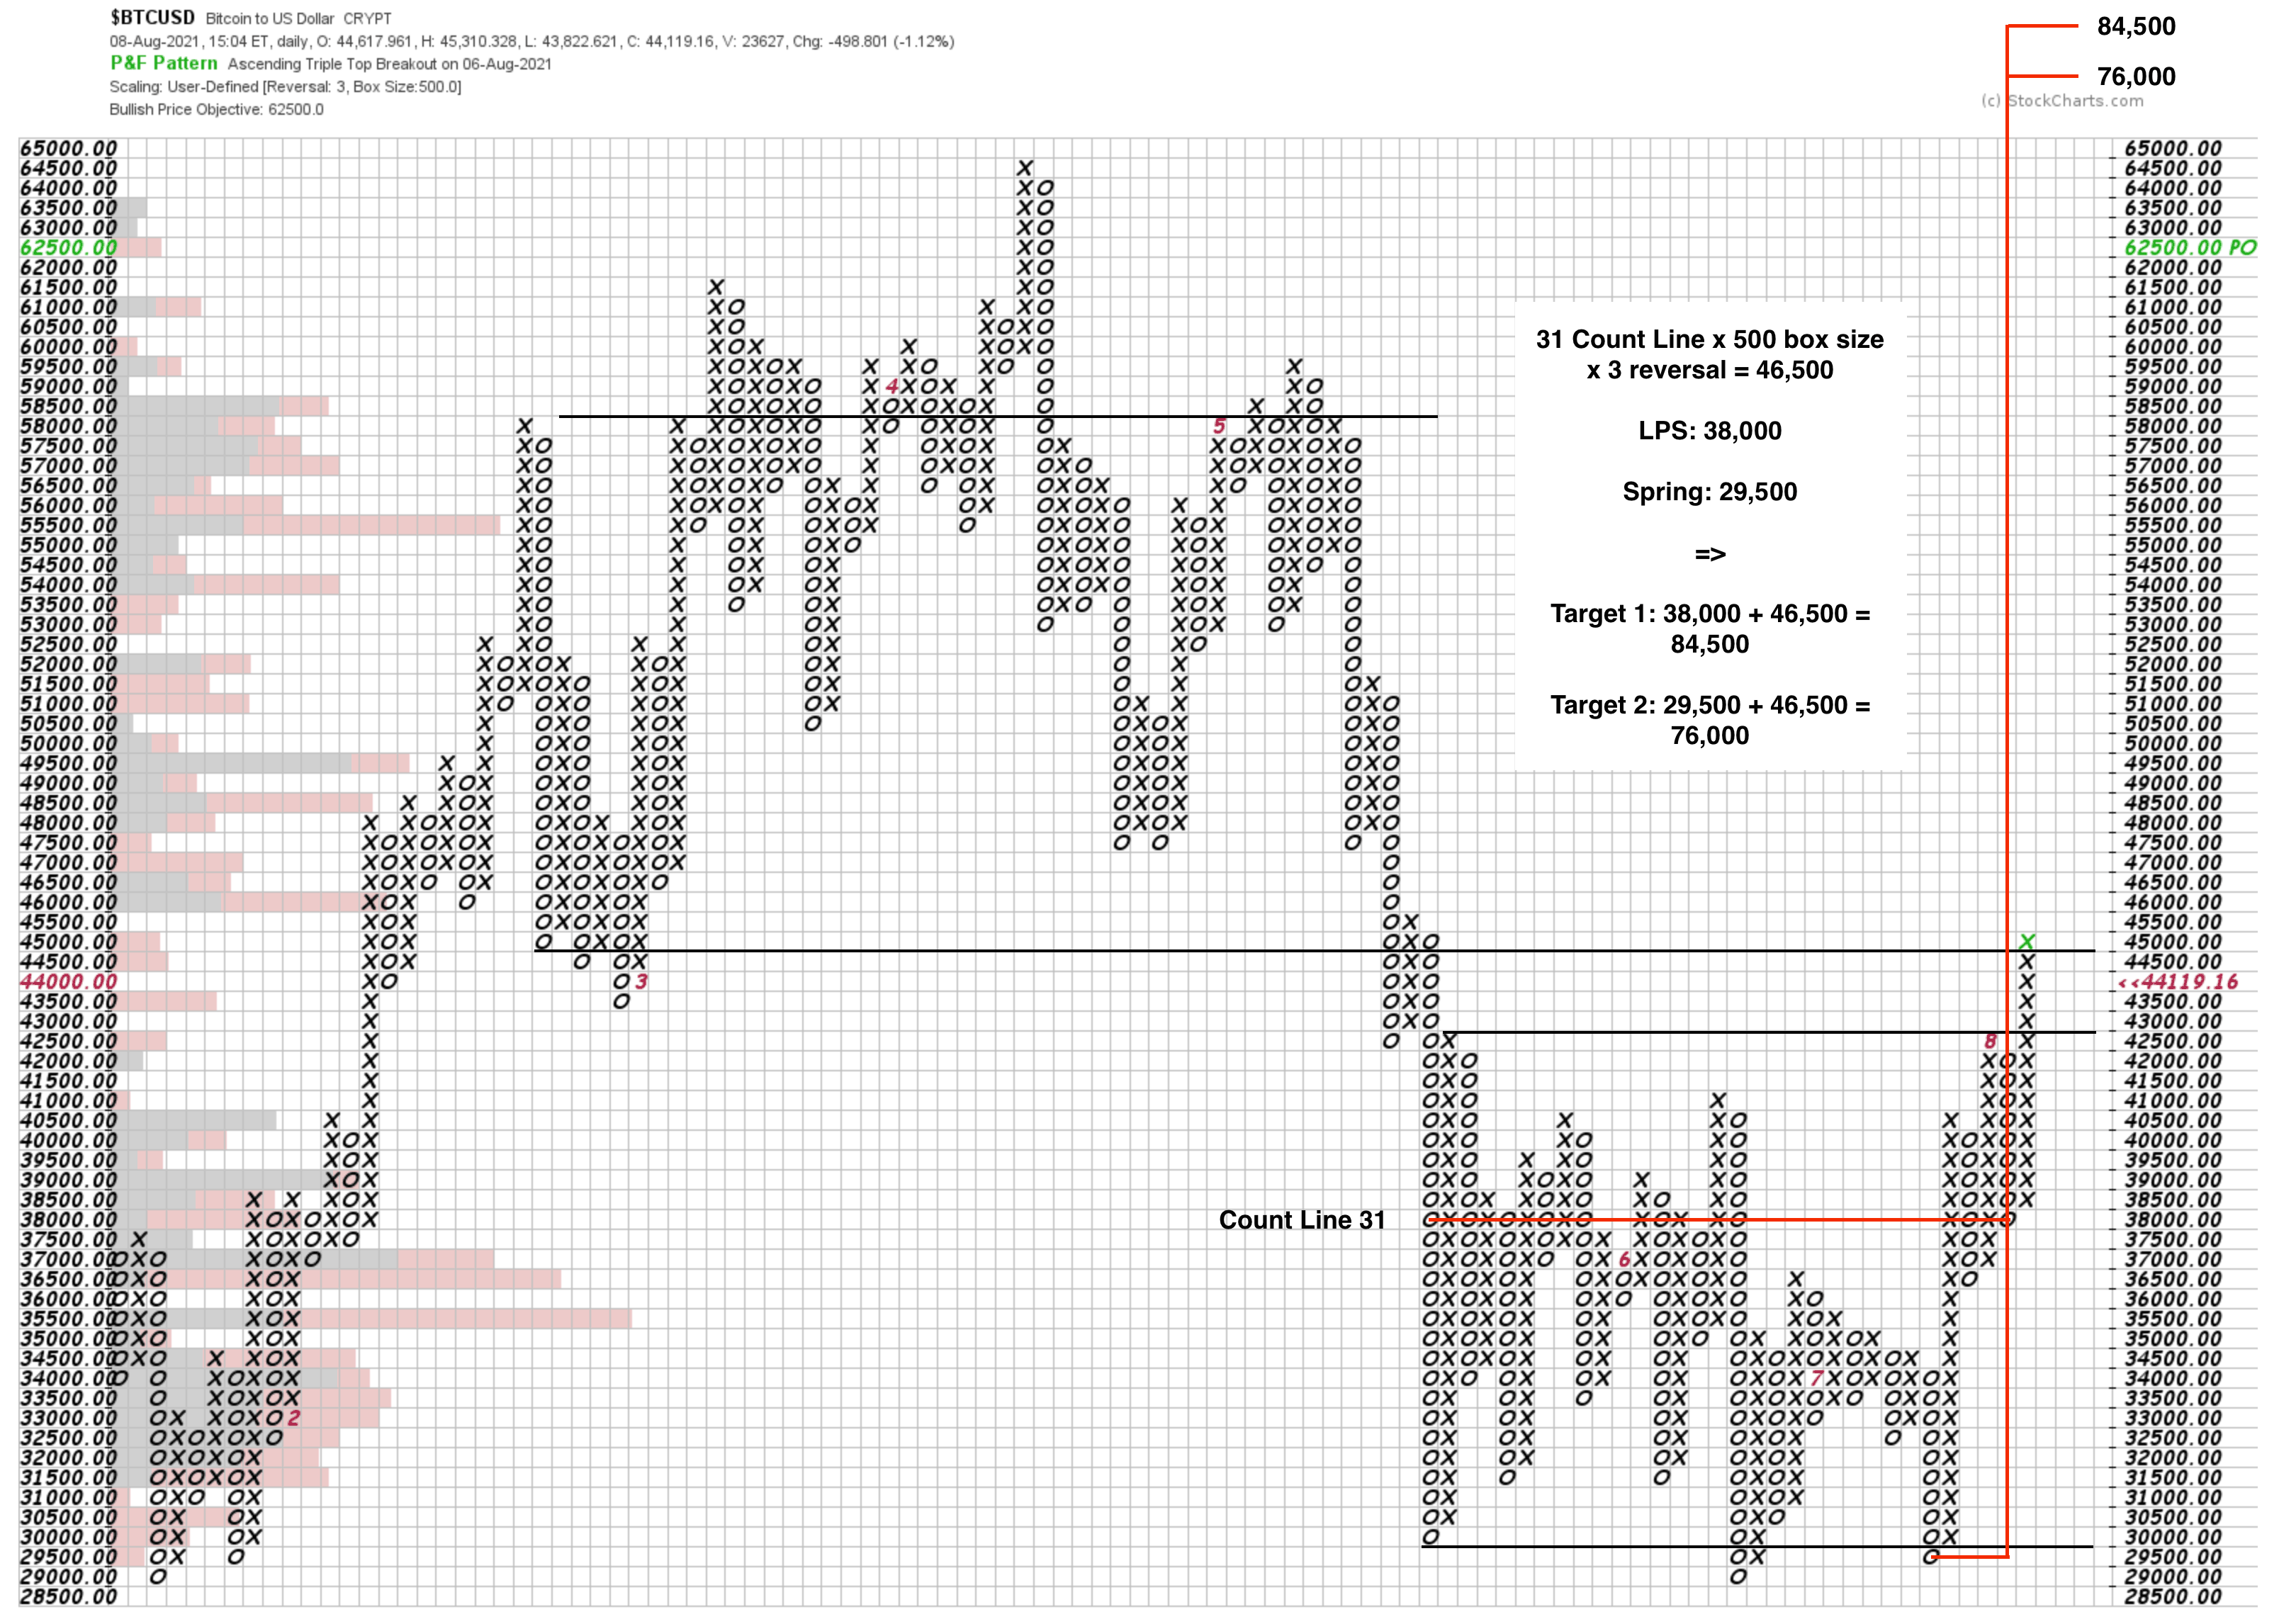
Point & Figure Horizontal Price Target (Wyckoff method)
The Wyckoff method P&F horizontal count line is 31 columns with a 500 box size by 3 reversal chart. So that gives a projection of 46,500, which added onto the Spring Low at 29,500 and the Last Point of Support (LPS) at 38,000, gives a target range of 76,000 to 84,500. Which is a greater than 100% potential Cause from the entire lower base.
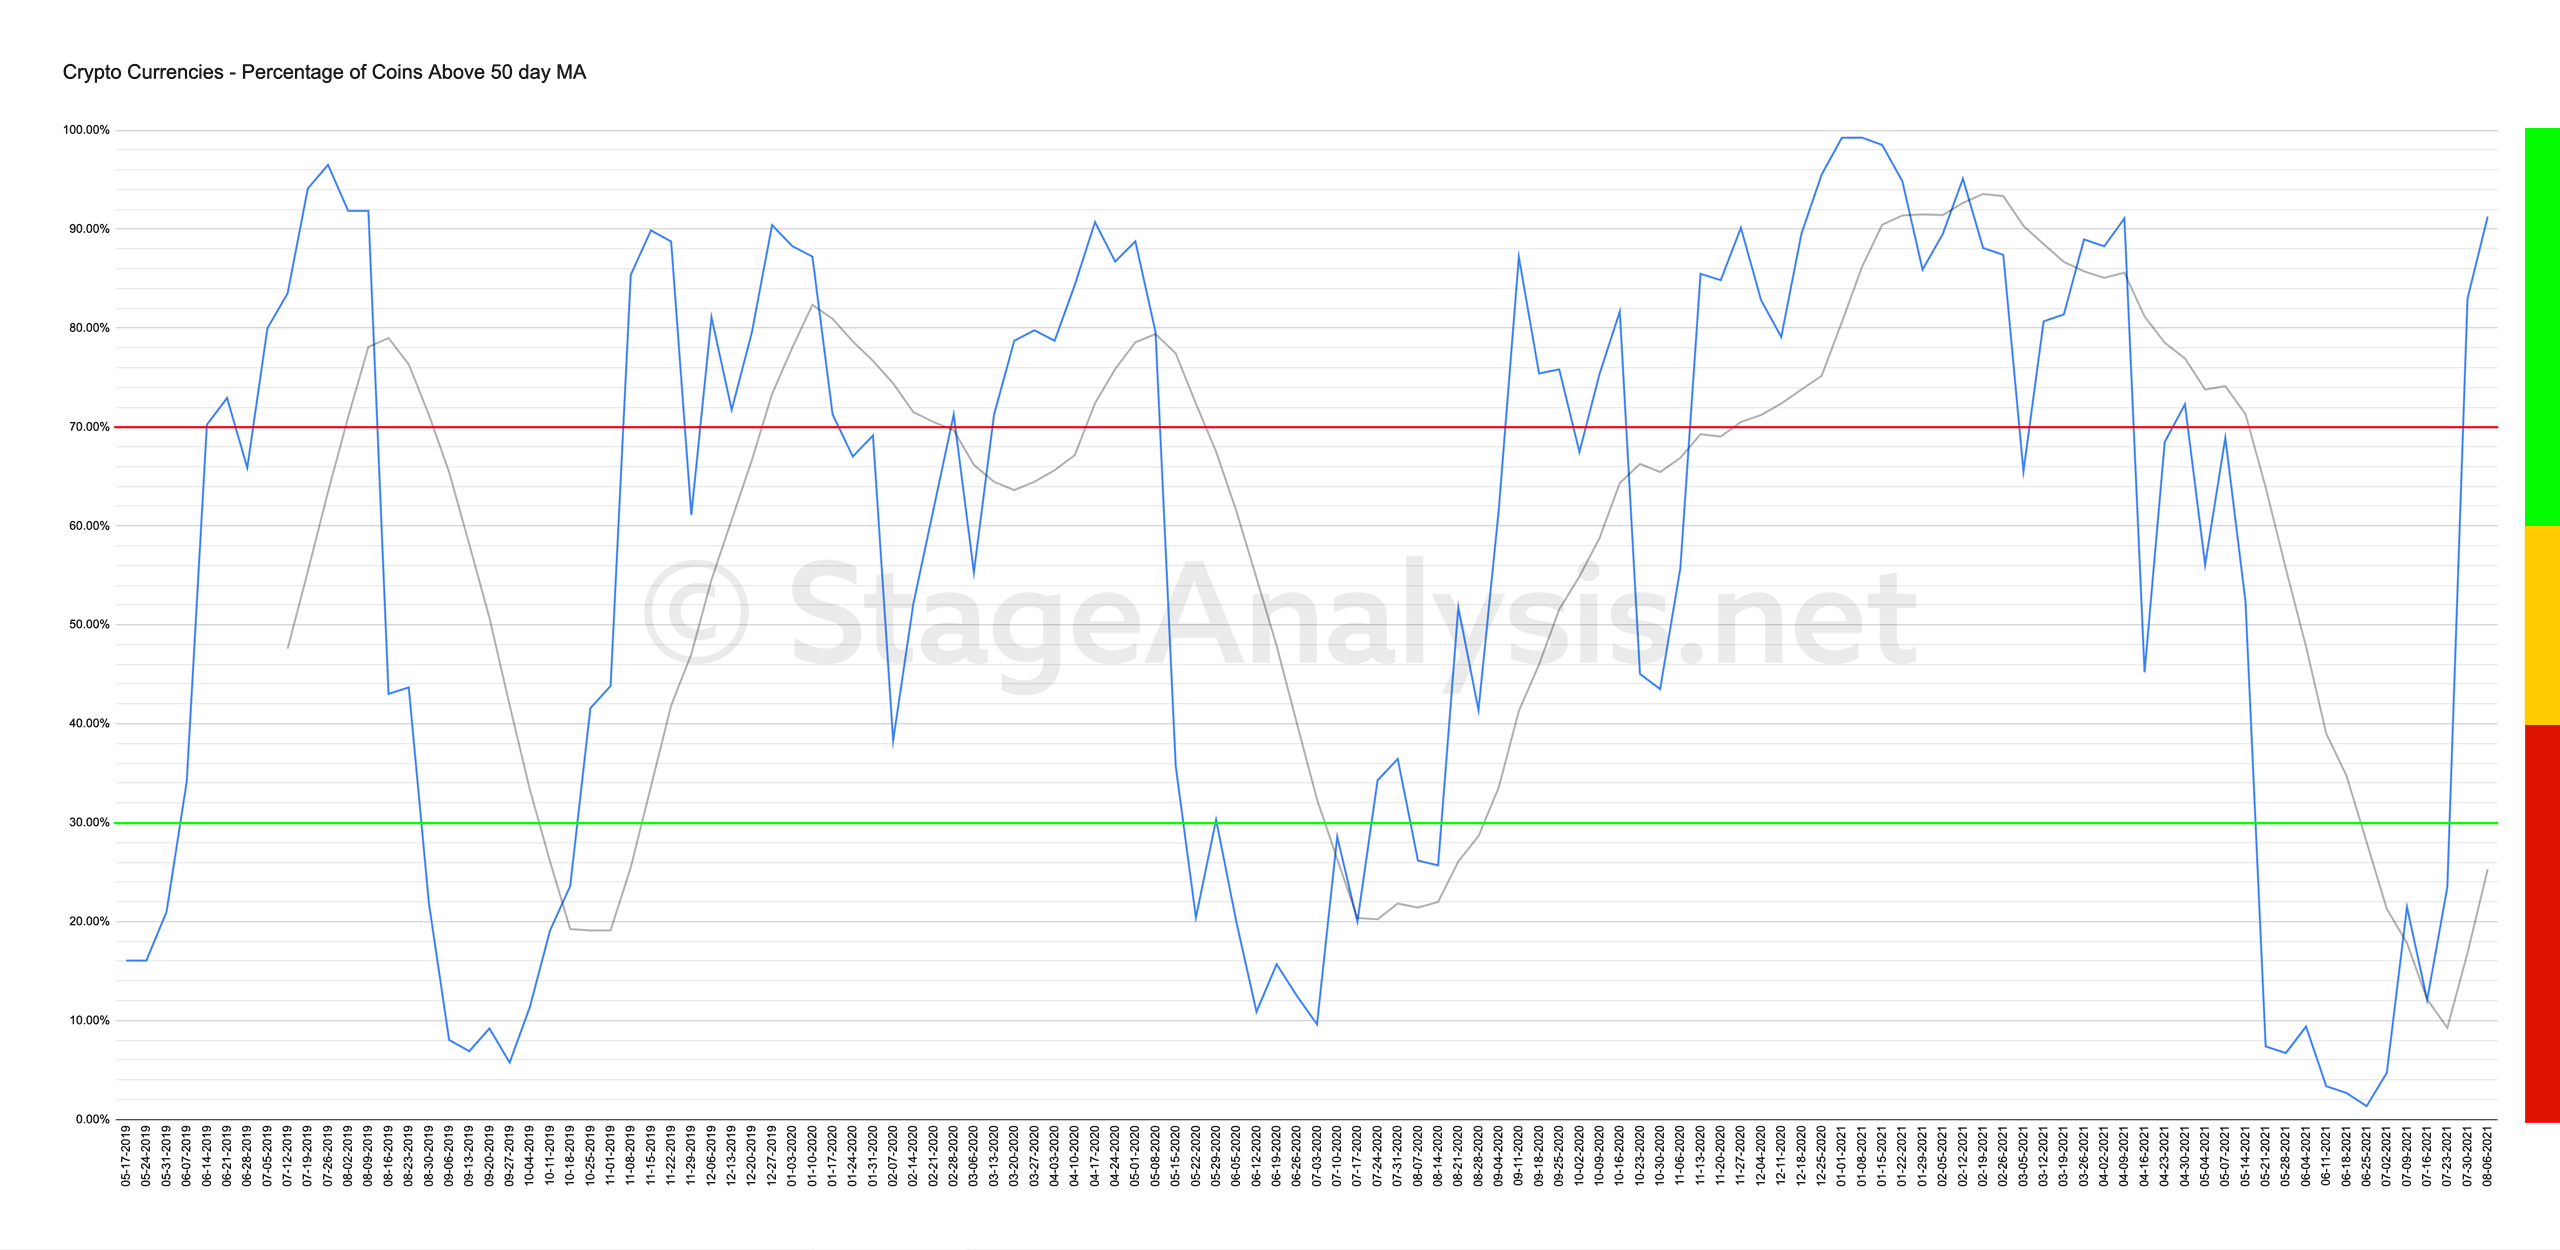
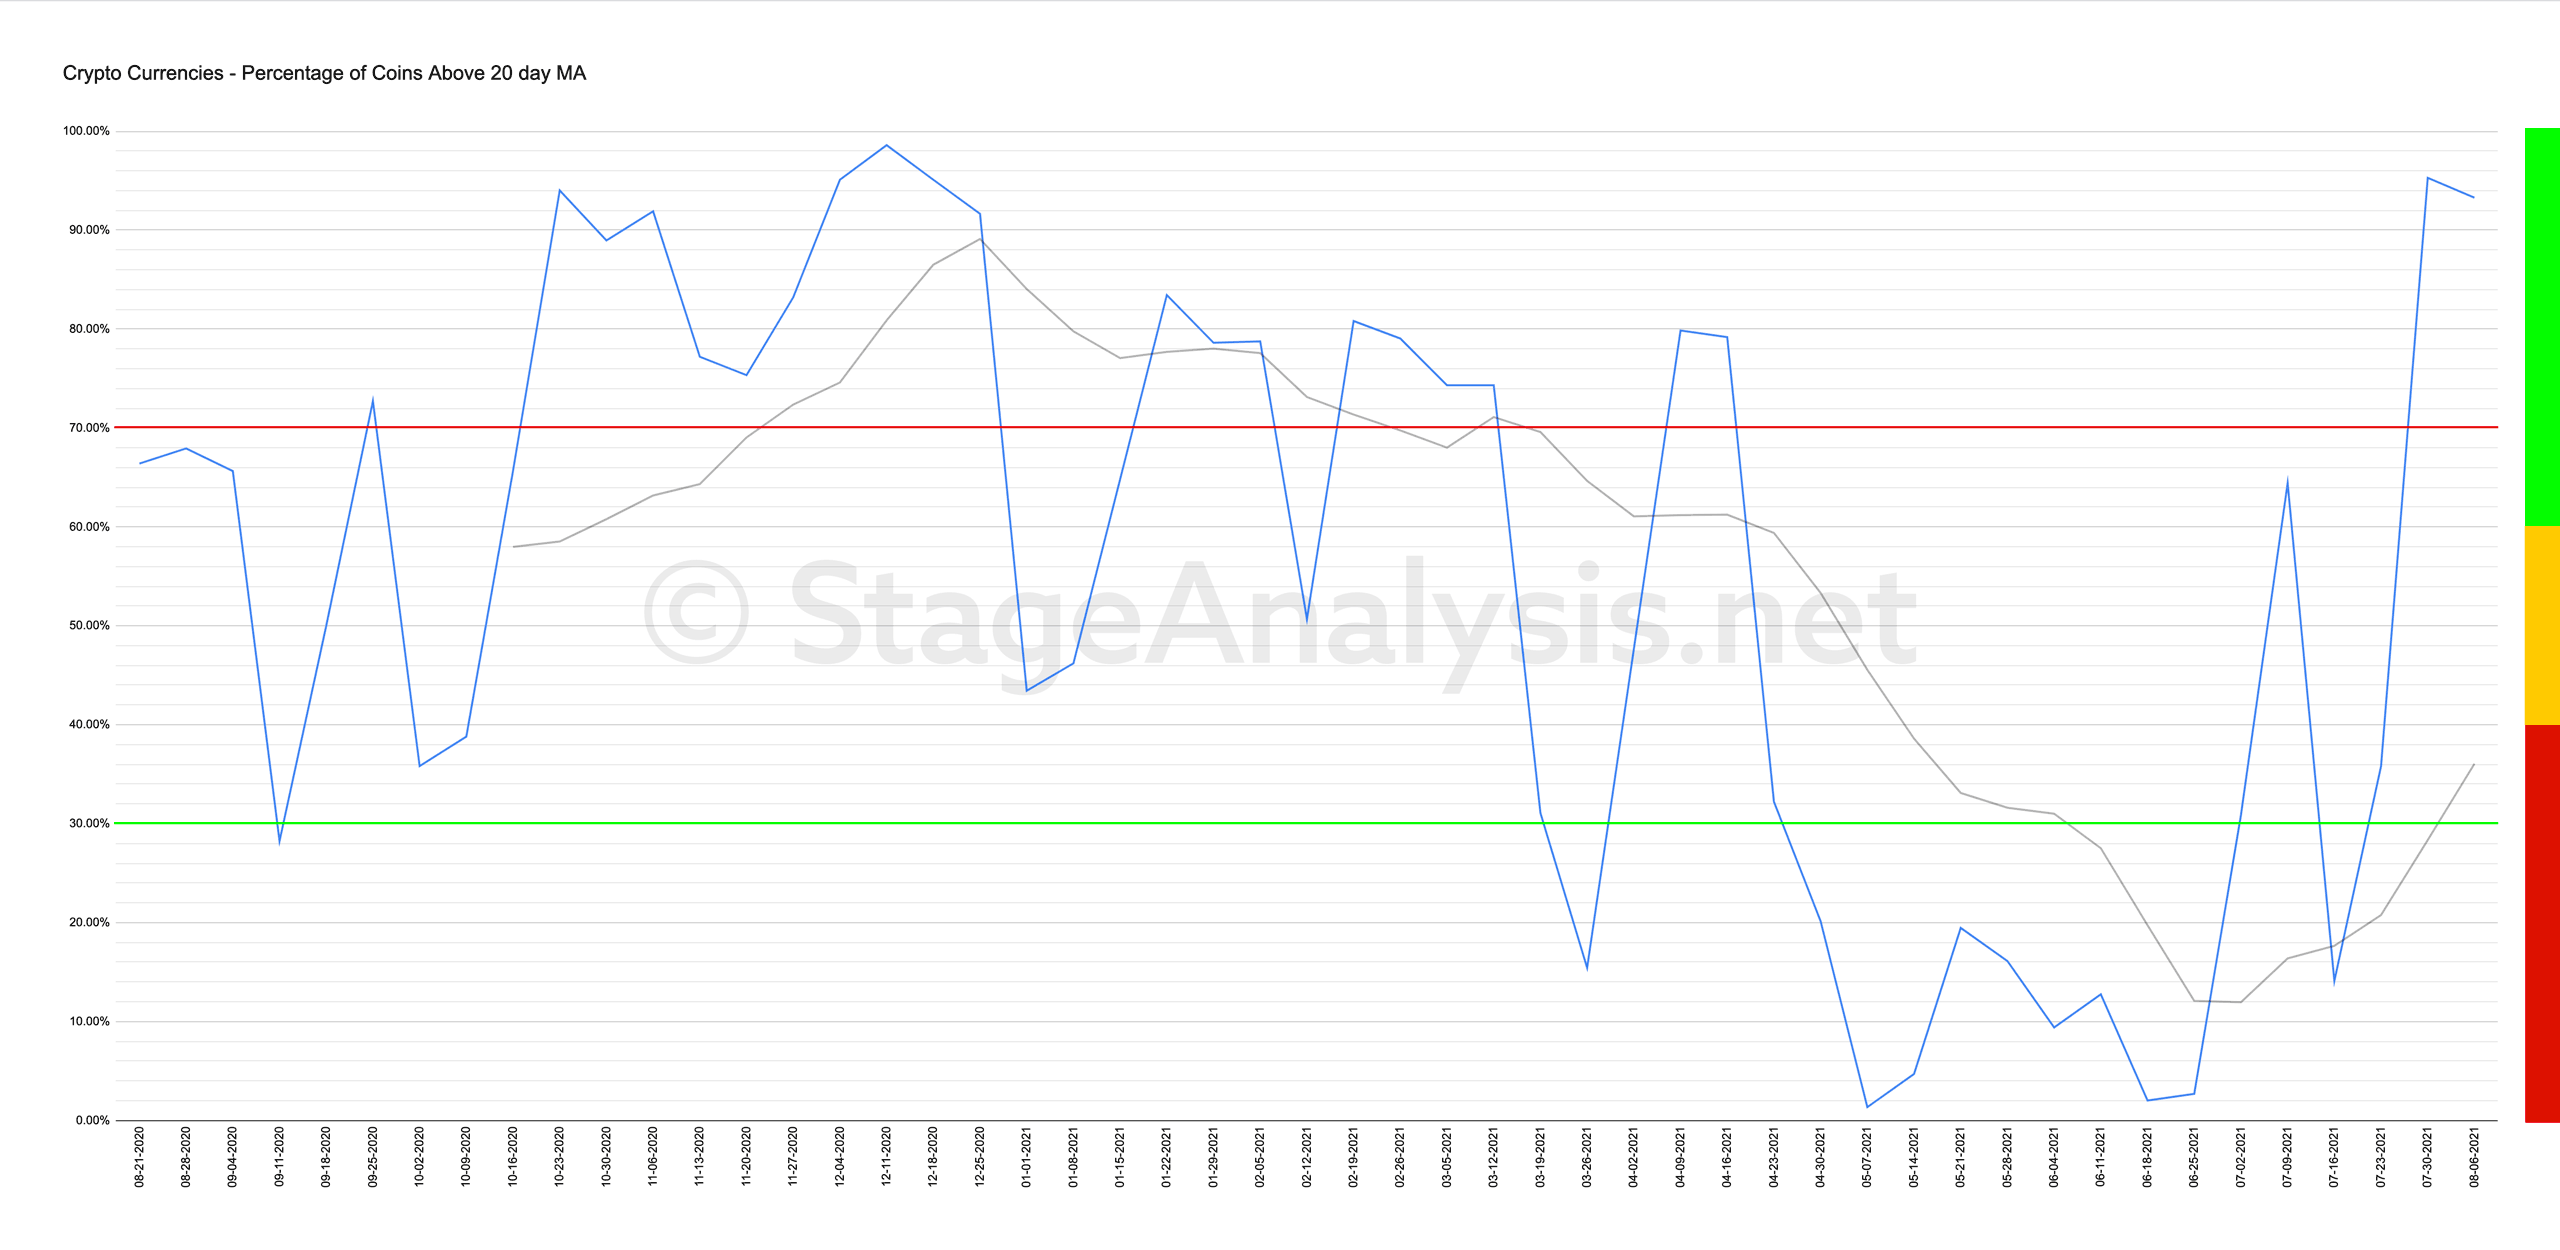
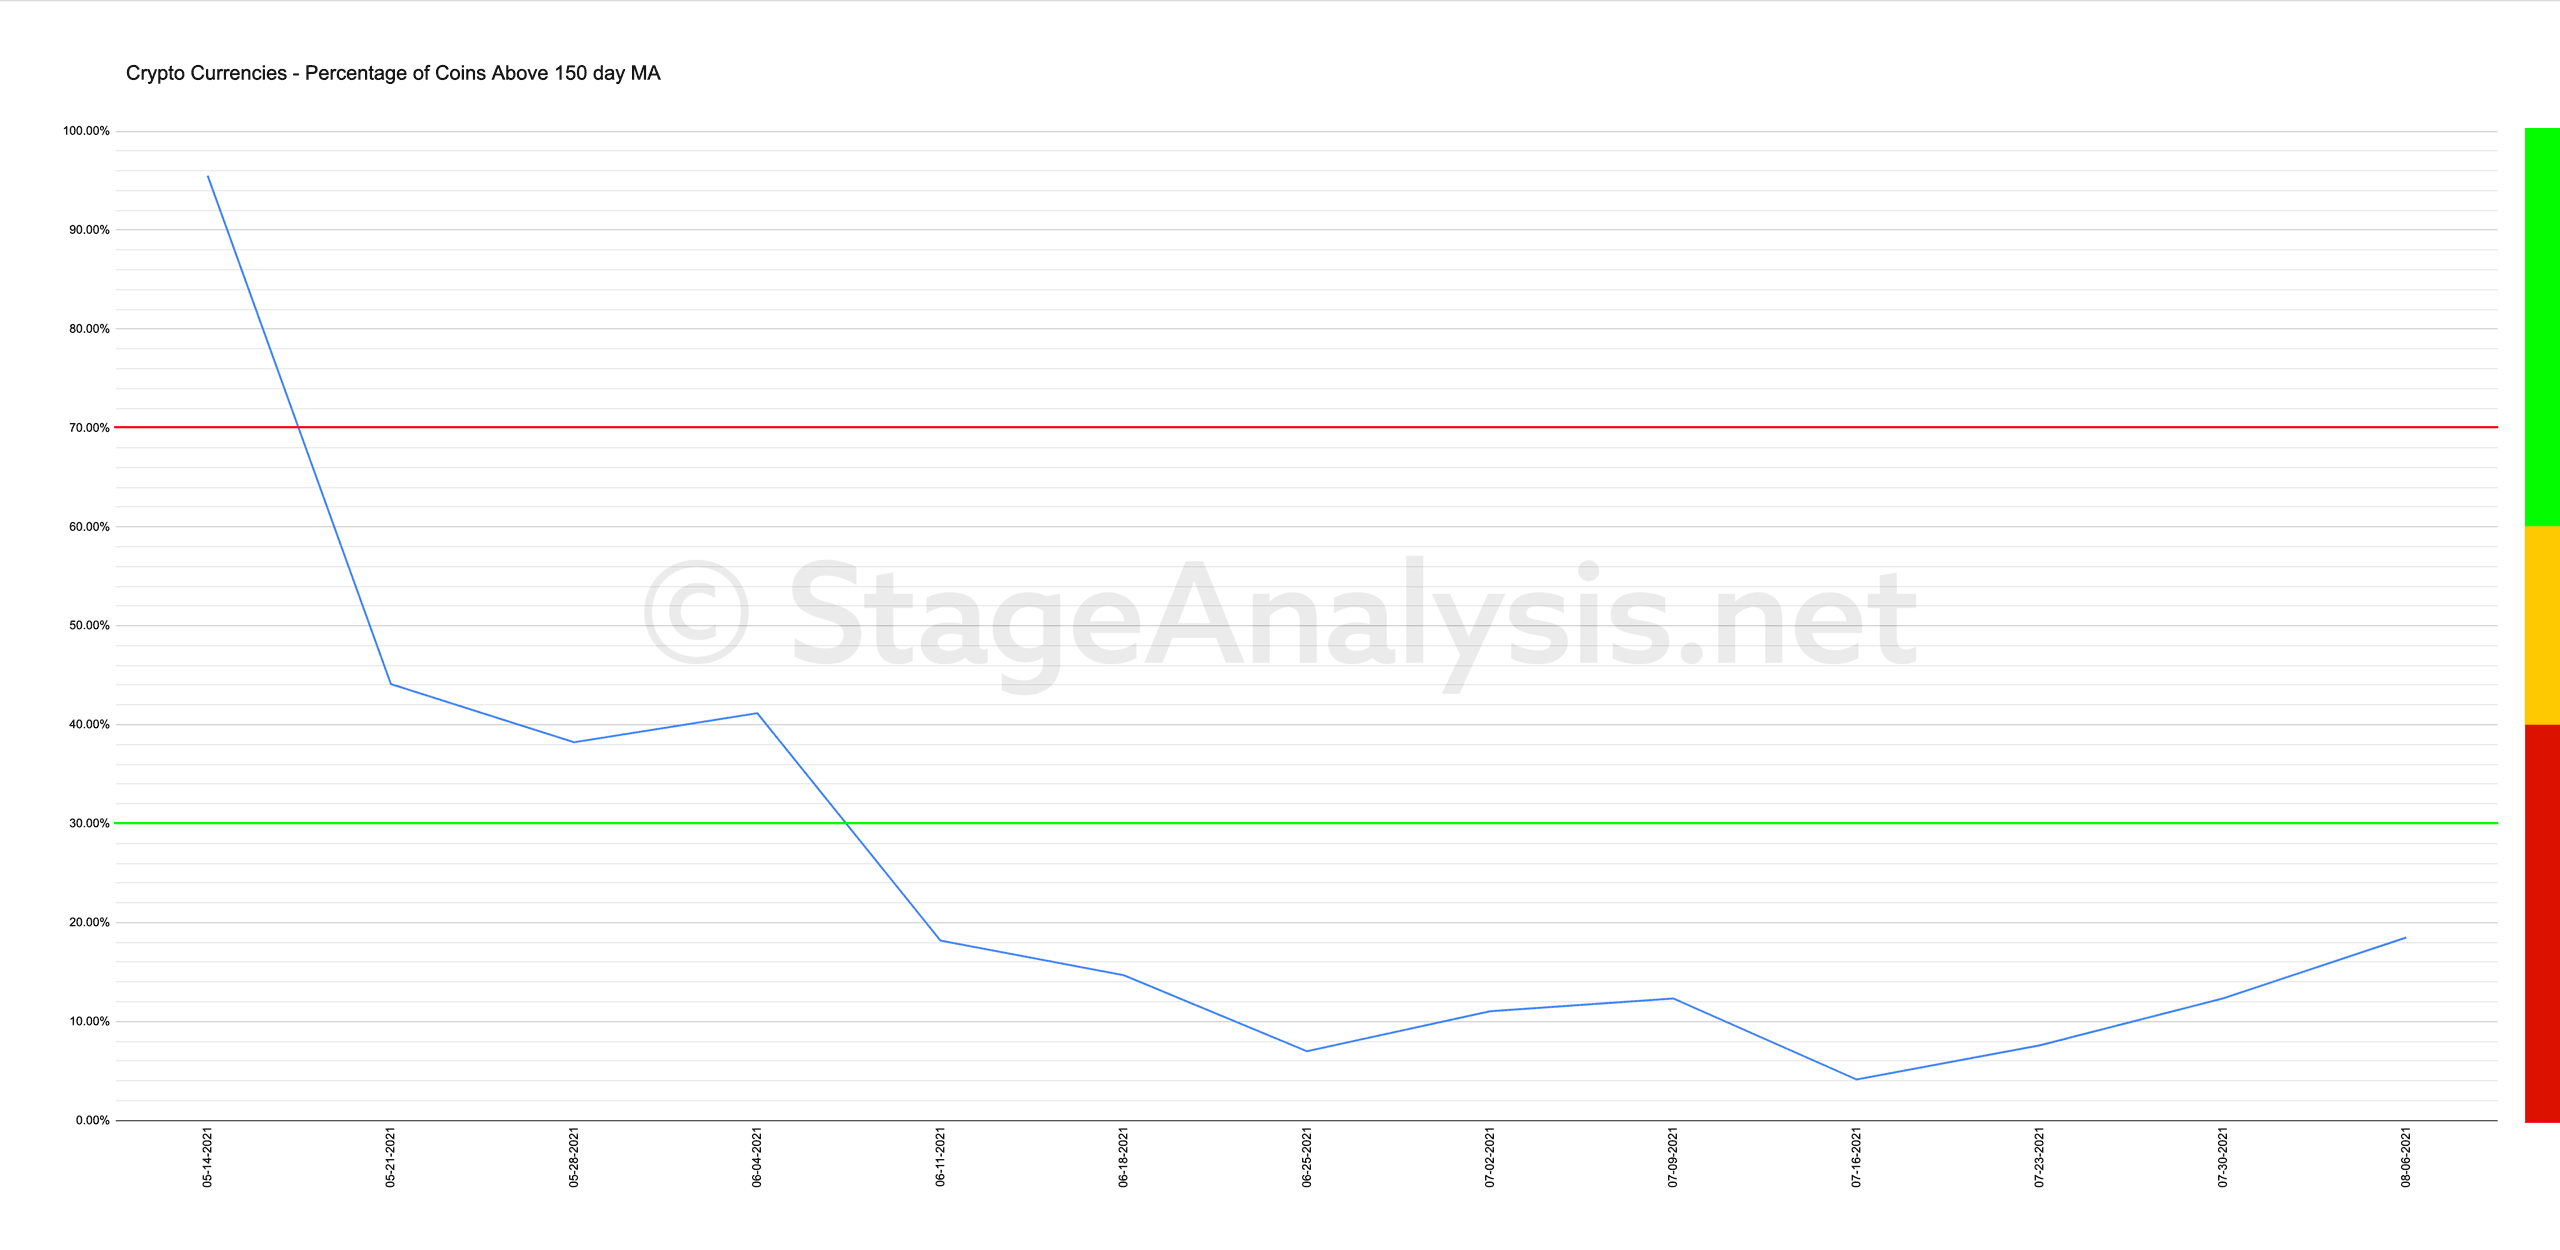
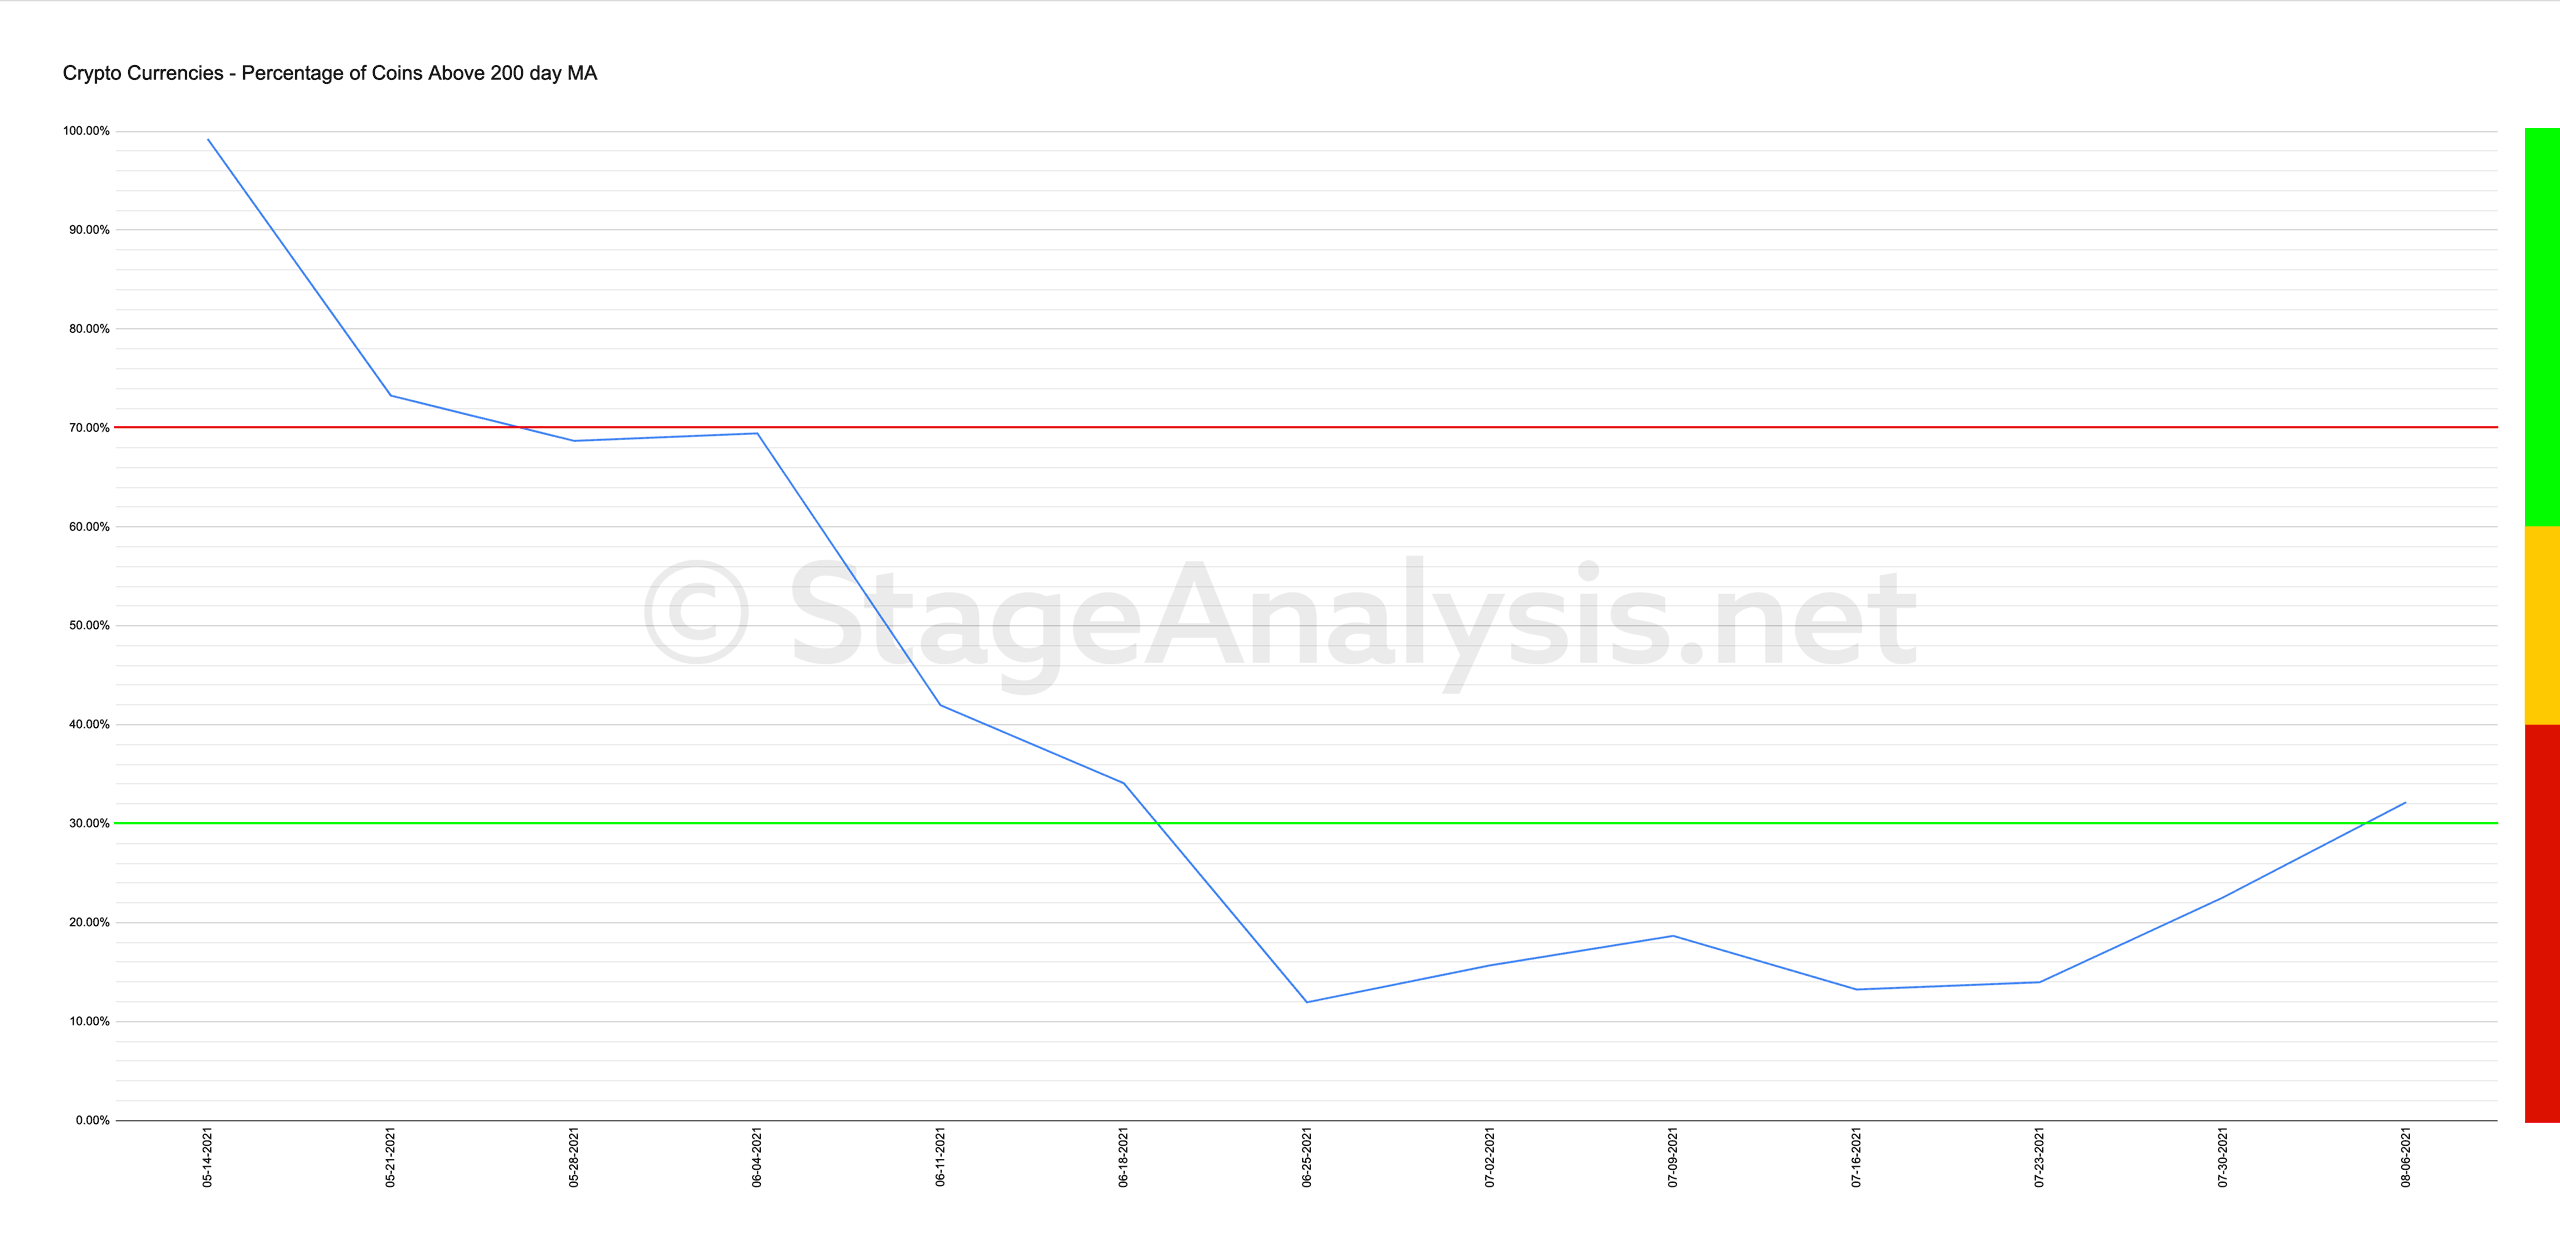
Percentage of Crypto Currencies Above Their Key Moving Averages (149 coins)
- % above 20 day MA: 93.29% (-2.01% 1 wk)
- % above 50 day MA: 91.28% (+8.28% 1 wk)
- % above 150 day MA: 18.49% (+6.16% 1 wk)
- % above 200 day MA: 32.17% (+9.63% 1 wk)
This is a custom breadth indicator that I created to help measure the strength and weakness of Crypto Currencies. The % above 50 day MA chart gave a bull signal 2 weeks ago as it moved out of the lower range and through the key 30% level, and has since had a breadth thrust, and now over 90% of Crypto Currencies that I track are back above their 50 day MA, with continued improvement in the medium and longer term measures also.
Want to learn more? Join Today.
Become a member of Stage Analysis to learn more about the Stage Analysis method and to see our regular posts and videos on US stocks and crypto.
Join today at https://www.getrevue.co/profile/stageanalysis/members
Disclaimer: For educational purpose only. Not investment advice. Seek professional advice from a financial advisor before making any investing decisions.
Disclaimer: For educational purpose only. Not investment advice. Seek professional advice from a financial advisor before making any investing decisions.